
| Company | Aug 25 | Sep 25 | Oct 25 | Nov 25 | Dec 25 | Jan 26 | Feb 26 | Mar 26 | Apr 26 | May 26 | Jun 26 | Jul 26 | 12-Mo |
|---|---|---|---|---|---|---|---|---|---|---|---|---|---|
| ADTN | +1% | +0% | +11% | -24% | +10% | +6% | +11% | +23% | +41% | -6% | -16% | -39% | -8% |
| AVNW | +6% | -0% | +9% | -11% | -3% | +2% | +15% | -10% | +1% | -23% | +25% | -8% | -5% |
| HLIT | +13% | +6% | +5% | -11% | +3% | -2% | +9% | -16% | +27% | +32% | +8% | -29% | +36% |
| CIEN | +1% | +55% | +30% | +8% | +15% | +8% | +38% | +11% | +36% | +10% | -15% | -23% | +306% |
| CALX | +5% | +3% | +11% | -19% | -4% | -16% | +16% | -5% | -11% | -9% | -6% | -4% | -37% |
| VIAV | +12% | +12% | +39% | +1% | -1% | +37% | +21% | +12% | +57% | -7% | -2% | -23% | +268% |
Source: Yahoo Finance monthly adjusted close.
Executive Summary
Rating: SELL | ADTN
Measured from adjusted close on 2026-08-11 to 2026-09-25. Sell ratings are correct when the stock falls; Hold is tracked as a +/-10% range. Daily-close data, not intraday. Calls are tracked for 182 days from publication, then frozen as a final record.
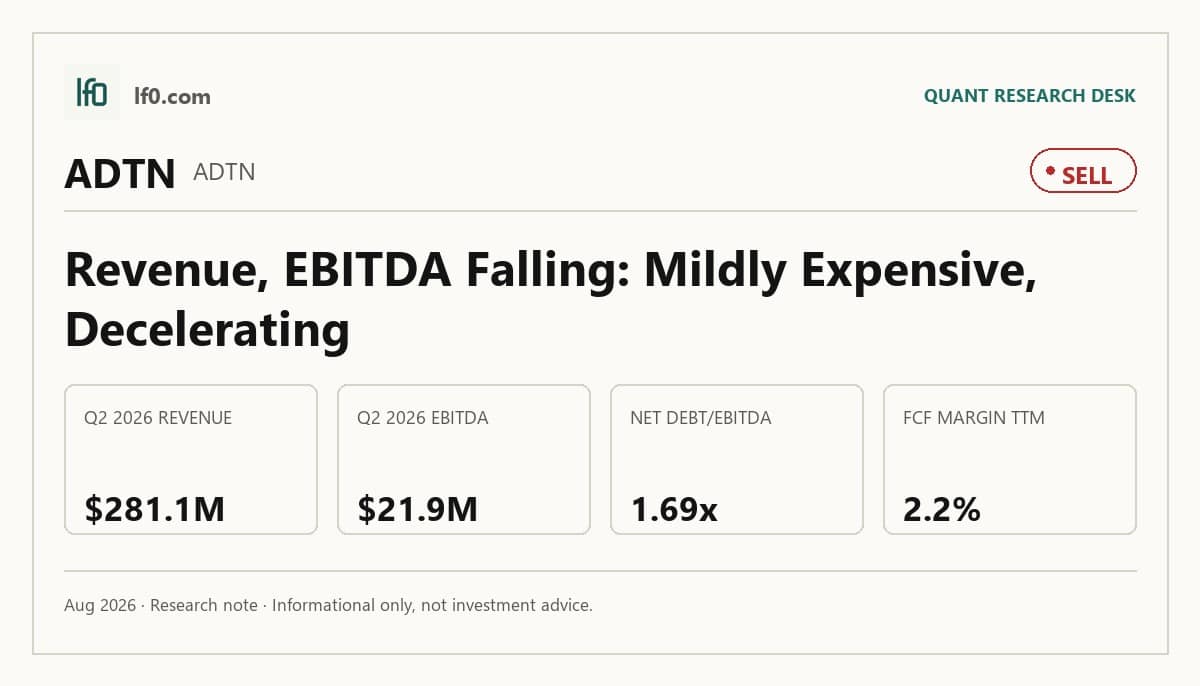
I would put my rating as a Sell because ADTRAN is still trading as if the 2025 reset has already become durable, while the latest figures show revenue drifting lower and cash generation staying too thin to de-risk the equity. The company has a real interoperability-based edge in broadband access and optical networking, but that advantage is not yet translating into sustained operating leverage. TTM operating margin is -3.5%, net margin is -2.3%, and levered free cash flow is only $24.8M, so the business is still absorbing shocks rather than compounding them. I would raise my rating more towards a Hold if revenue can hold above $290M for two consecutive quarters and levered free cash flow moves above $40M over the next twelve months, meaning the reset is finally feeding through to cash.
Company Profile
ADTRAN Holdings designs and sells networking and communications equipment and software for service providers, enterprises, and government customers. Revenue comes from hardware, software, and services tied to passive optical networks, software-defined networking, Wi-Fi, Ethernet, and related access and edge systems, including the Mosaic One software as a service platform. The company was founded in 1985 and went public in 1994; the 2022 combination with ADVA Optical Networking SE broadened its European footprint and expanded the product set beyond broadband access alone. It operates across the United States, Europe, the Middle East and Africa, and Asia Pacific, with manufacturing split between in-house and subcontracted facilities.
Economic Moat
Business Model
The most durable edge here is the installed base around broadband access and optical networking products that must interoperate with carrier networks. Once a service provider qualifies an ADTRAN platform, replacing it means reworking network design, testing, and service workflows, and I feel that is hard to replicate quickly. Relationships with service providers, systems integrators, and value-added resellers help distribution, while the Mosaic One cloud platform adds software stickiness, but those are supporting advantages rather than the core defense. The 2022 ADVA combination widened the portfolio and customer reach, which helps the moat, yet it also raises execution complexity because more product families have to stay current at once.
Business & Operating Risks
The most material disclosed risk is the Wells Fargo Credit Agreement covenant stack, because a failure to comply has already resulted in events of default and could again accelerate debt, restrict dividends, and limit acquisitions. That pressure is not abstract: the company carries $242.7M of total debt, a current ratio of 1.8x, and only $319.2M of remaining borrowing capacity under covenant metrics, so a softer operating patch could tighten liquidity quickly. The DPLTA tied to Adtran Networks is the other major cash claim, with recurring annual compensation of about €7.9M and exit compensation that can rise materially if minority holders tender. In my view, these risks do not break the interoperability moat itself, but they do threaten the cash flow needed to monetize it.
Management Discussion & Analysis
Management is responding to the balance-sheet pressure, but mostly by reshaping liabilities rather than removing them. The company issued $201.3M of 3.75% convertible senior notes due 2030 and used the proceeds to pay down revolver borrowings, which lowers near-term refinancing pressure without shrinking the overall obligation stack. The DPLTA remains open, with management expecting the final appraisal decision in 2027, most likely 2028 or later, so the cash drain is still in front of investors. At the same time, the 2025 cost reset did show up in the numbers: gross margin improved to 38.5% TTM, and selling, general and administrative expense fell as a share of revenue, which tells me the operating base is cleaner even if it is not yet strong enough to support faster deleveraging. The company’s response is directionally right, but it has not yet proven to me that the margin recovery is durable enough to offset the covenant and DPLTA burden.
Recent Events
The January 2026 preliminary results, February 2026 full-year earnings release, and May 2026 first-quarter update all point to a company still in a reporting and reset phase rather than a new growth phase. That matters for the moat because the recent filings show the business is still trying to stabilize execution before it can fully monetize its installed base. The April 2026 compensation amendment is more revealing: ADTRAN removed the annual relative total shareholder return PSU award and shifted long-term incentives toward Adjusted EBIT over 2026 to 2028, which tells me management is trying to anchor pay to operating improvement rather than stock price alone. The May 2026 annual meeting was mostly governance housekeeping, so the recent events do not change the thesis much; they mainly confirm that the next leg of the story depends on execution, not structure.
Financial Analysis
Growth
ADTN — Financial Growth (Quarterly, USD Mil)
| Metric | 2025-03-31 | 2025-06-30 | 2025-09-30 | 2025-12-31 | 2026-03-31 | 2026-06-30 |
|---|---|---|---|---|---|---|
| REVENUE (USD Mil) | — | 265.1 | 279.4 | 291.6 | 286.1 | 281.1 |
| EBIT (USD Mil) | — | -12.7 | -1.1 | 6.4 | 7.1 | -3.7 |
| EBITDA (USD Mil) | — | 10.7 | 22.3 | 30.6 | 32 | 21.9 |
| NET INCOME (USD Mil) | — | -20.5 | -10.3 | -3.6 | -1.3 | -10.9 |
| DILUTED EPS | -0.1 | -0.2 | -0.1 | 0 | 0 | — |
Source: Yahoo Finance — Quarterly Financial Statements
Revenue was $265.1M in Q2 2025, $279.4M in Q3 2025, $291.6M in Q4 2025, $286.1M in Q1 2026, and $281.1M in Q2 2026. The trend is flatter than it first looks: the business improved into late 2025, but the last two quarters show a mild pullback rather than a clean re-acceleration. EBITDA followed the same pattern, rising to $32M in Q1 2026 before slipping to $21.9M in Q2 2026, which tells me the operating base is still sensitive to revenue mix and volume. That is consistent with a network-equipment business that depends on project timing, but it also means the moat has not yet translated into stable top-line momentum.
Profitability
ADTN — Profitability (TTM)
| Metric | TTM |
|---|---|
| Operating Margin (TTM) | -3.5% |
| Net Margin (TTM) | -2.3% |
| Return on Assets (TTM) | -0.1% |
| Return on Equity (TTM) | -3.2% |
| Gross Margin (TTM) | 38.5% |
| EBITDA Margin (TTM) | 8.5% |
Source: Yahoo Finance — Trailing Twelve Months (TTM)
TTM gross margin was 38.5%, which is respectable, but EBITDA margin was only 8.5% and operating margin was -3.5%, so too much of the gross profit is still being consumed by overhead. Net margin was -2.3%, which means the company is still below breakeven on GAAP earnings even after EBITDA turns positive. Return on assets was -0.069% and return on equity was -3.17%, so capital is not yet earning an acceptable return. The key cross-check is simple: the installed-base moat described above is real, but it is not yet producing the operating leverage needed to turn gross profit into durable equity returns.
Valuation
ADTN — Valuation Multiples
| Metric | Value |
|---|---|
| Market Cap (USD Mil) | 632 |
| Enterprise Value (USD Mil) | 1,142 |
| Forward P/E | 13.1 |
| Price/Sales (TTM) | 0.6 |
| Price/Book (mrq) | 4.9 |
| EV/Revenue | 1 |
| EV/EBITDA | 11.8 |
| Beta (5Y Monthly) | 1.49 |
| FCF Yield % (TTM) | 3.9% |
| Forward EPS (USD) | 0.6 |
| Analyst Target Price – Low (USD) | 11 |
| Analyst Target Price – Mean (USD) | 14.7 |
| Analyst Target Price – High (USD) | 21 |
| # Analyst Opinions | 6 |
Source: Yahoo Finance
ADTRAN trades at 1.0x EV/revenue, 0.6x price/sales, and 11.8x EV/EBITDA, while forward P/E is 13.1x on forward EPS of $0.59. I think that is a fair-to-slightly-cheap multiple for a business with a 38.5% gross margin and a 3.9% FCF yield, but not cheap enough to ignore the negative operating margin and the 1.7x net debt/EBITDA load. On the analysis here, I would put fair value in a range of roughly $11–$15 per share, which sits around the analyst mean target of $14.7 and inside the published $11–$21 range from six analysts. My own EPS view is roughly $0.55–$0.65, which is close to the $0.59 forward EPS consensus; that suggests the market is not wildly misreading earnings power, but it is also not paying up for a faster margin recovery than the numbers justify. The valuation case is therefore tied to execution: if cash conversion improves before leverage does, the stock can re-rate; if not, the current multiple already looks about right.
Leverage
ADTN — Leverage & Coverage (Quarterly)
| Metric | Value |
|---|---|
| Total Debt/Equity % (mrq) | 49.7 |
| Current Ratio (mrq) | 1.8 |
| Total Debt (mrq, USD Mil) | 242.7 |
| Operating Cash Flow (TTM, USD Mil) | 93 |
| Levered Free Cash Flow (TTM, USD Mil) | 24.8 |
| Net Debt/EBITDA (TTM) | 1.7 |
| FCF Margin % (TTM) | 2.2% |
Source: Yahoo Finance — Quarterly Financial Statements
Total debt was $242.7M, net debt/EBITDA was 1.7x, and the current ratio was 1.8x, so the balance sheet is workable but not a source of upside. Operating cash flow was $93M TTM and levered free cash flow was $24.8M, which means only a small slice of earnings is reaching equity holders after capital spending and other claims. FCF margin was 2.2%, so the company still has little room for error if revenue softens or refinancing costs rise. In my view, this is the main reason the stock deserves a discount to the stronger peers: the business can service its debt, but it cannot yet use the balance sheet to accelerate growth or buy back much stock.
Insider Activity
The insider tape is one-way selling. There were five open-market sales totaling about $2.5M, and no open-market purchases in the 2024-12-31 to 2026-05-20 window. Christoph Glingener accounted for three of the sales, while Wilson James Denson Jr. and Jacqueline Hourigan Rice accounted for the rest. I read that as a mild negative, not a thesis breaker, because it does not prove anything on its own, but it does not suggest insiders are leaning in ahead of a clear inflection either.
Comparable Analysis
Growth
| Company | Revenue TTM (USD Mil) | Revenue Growth YoY % | EBITDA TTM (USD Mil) | Diluted EPS TTM |
|---|---|---|---|---|
| ADTN | 1,138.2 | 6.1% | 96.7 | -0.3 |
| AVNW | 434.1 | -11.2% | 31 | 0.7 |
| HLIT | 397.3 | 43.4% | 41.3 | 0.1 |
| CIEN | 5,569.1 | 39.5% | 785.7 | 3 |
| CALX | 1,111.2 | 21.3% | 79.1 | 0.8 |
| VIAV | 1,518.3 | 52.5% | 236.6 | -0.1 |
Source: Yahoo Finance
ADTN’s revenue growth of 6.1% TTM trails CIEN at 39.5%, VIAV at 52.5%, HLIT at 43.4%, and CALX at 21.3%, while it only beats AVNW at -11.2%. That leaves ADTN as the slowest grower in the group, so I would not pay a growth premium for it unless the earnings base starts to inflect. CIEN pairs 39.5% growth with a much larger revenue base and 3.0 diluted EPS TTM, which is why its higher multiple is easier to justify than ADTN’s.
Valuation
| Company | Trailing P/E | Forward P/E | EV/Revenue | EV/EBITDA | Price/Sales (TTM) | Price/Book (mrq) | Market Cap (USD Mil) | Enterprise Value (USD Mil) | Beta (5Y Monthly) | FCF Yield % (TTM) | Forward EPS | Analyst Target Price – Low | Analyst Target Price – Mean | Analyst Target Price – High | # Analyst Opinions |
|---|---|---|---|---|---|---|---|---|---|---|---|---|---|---|---|
| ADTN | — | 13.1 | 1 | 11.8 | 0.6 | 4.9 | 632 | 1,142 | 1.49 | 3.9% | 0.6 | 11 | 14.7 | 21 | 6 |
| AVNW | 30.4 | 7.4 | 0.7 | 9.6 | 0.6 | 1 | 272 | 299 | 0.70 | -3.0% | 2.8 | 25 | 31.6 | 42 | 8 |
| HLIT | 143.1 | 14.7 | 3.2 | 31 | 3.1 | 3.5 | 1,242 | 1,281 | 1.32 | -6.6% | 0.8 | 8 | 15.3 | 20 | 7 |
| CIEN | 129.6 | 40.2 | 9.9 | 70.3 | 9.8 | 19 | 54,856 | 55,258 | 1.31 | 1.3% | 9.6 | 270 | 565.7 | 720 | 19 |
| CALX | 52.1 | 17.2 | 2 | 28.1 | 2.2 | 3.5 | 2,495 | 2,223 | 1.24 | 2.5% | 2.3 | 52 | 62.3 | 85 | 6 |
| VIAV | — | 19.6 | 5.9 | 37.6 | 6.2 | 6.3 | 9,473 | 8,894 | 1.23 | — | 2 | 44 | 61.4 | 70 | 7 |
Source: Yahoo Finance
ADTN’s 1.0x EV/revenue and 11.8x EV/EBITDA sit well below CIEN at 9.9x and 70.3x, and below VIAV at 5.9x and 37.6x, but the discount reflects weaker growth and thinner margins rather than a clear mispricing. On a peer-implied basis, I would frame fair value around $11–$15 per share, which is roughly in line with the analyst mean of $14.7 and the six-name consensus band. A $1 investment a year ago would be worth $0.89 in ADTN, versus $0.97 in AVNW, $1.33 in HLIT, $4.15 in CIEN, $0.67 in CALX, and $3.43 in VIAV, so the market has not rewarded ADTN for its lower headline multiple. In my view, the stock is cheaper than the fastest growers, but the discount is justified until the company shows that revenue and cash flow can move together.
Profitability
| Company | Operating Margin (TTM) | Net Margin (TTM) | Return on Assets (TTM) | Return on Equity (TTM) | Gross Margin (TTM) | EBITDA Margin (TTM) |
|---|---|---|---|---|---|---|
| ADTN | -3.5% | -2.3% | -0.1% | -3.2% | 38.5% | 8.5% |
| AVNW | 1.3% | 2.1% | 2.5% | 3.4% | 32.4% | 7.1% |
| HLIT | 16.8% | -10.6% | 2.6% | 2.1% | 48.3% | 10.4% |
| CIEN | 15.2% | 7.9% | 6.7% | 15.5% | 43.0% | 14.1% |
| CALX | 7.4% | 4.6% | 4.1% | 6.9% | 56.6% | 7.1% |
| VIAV | 13.7% | -2.0% | 3.5% | -2.7% | 61.7% | 15.6% |
Source: Yahoo Finance
ADTN’s gross margin of 38.5% is above AVNW at 32.4%, but below HLIT at 48.3%, CALX at 56.6%, VIAV at 61.7%, and CIEN at 43.0%. EBITDA margin is 8.5%, which is only modestly ahead of AVNW and CALX at 7.1%, while operating margin is -3.5% versus CIEN at 15.2% and HLIT at 16.8%. That gap tells me ADTN is still converting too little gross profit into operating profit, so the peer comparison supports caution rather than a rerating.
Leverage
| Company | Total Debt/Equity % (mrq) | Current Ratio (mrq) | Total Debt (mrq, USD Mil) | Operating Cash Flow TTM (USD Mil) | Free Cash Flow TTM (USD Mil) | Net Debt/EBITDA (TTM) | FCF Margin % (TTM) |
|---|---|---|---|---|---|---|---|
| ADTN | 49.7 | 1.8 | 242.7 | 93 | 24.8 | 1.7 | 2.2% |
| AVNW | 39.2 | 2 | 106.7 | 21 | -8.1 | 0.9 | -1.9% |
| HLIT | 36.9 | 2.3 | 131.1 | 56 | -81.9 | 0.5 | -20.6% |
| CIEN | 54.6 | 2.7 | 1,580.6 | 1,032.8 | 700.9 | 0.5 | 12.6% |
| CALX | 2 | 2.8 | 14 | 109.5 | 61.5 | -2.3 | 5.5% |
| VIAV | 44.3 | 1.8 | 641.9 | — | — | 0 | — |
Source: Yahoo Finance
ADTN’s net debt/EBITDA of 1.7x is higher than AVNW at 0.9x, HLIT at 0.5x, CIEN at 0.5x, CALX at -2.3x, and VIAV at 0.0x, so it is more levered than the cash-rich names. Its 2.2% FCF margin is also well below CIEN at 12.6%, and that gap matters because the stronger balance sheets are not just less risky, they also have more room to invest through the cycle. In other words, ADTN’s valuation discount is partly a leverage discount, not just a growth discount.
Conclusion
The key tension is that ADTRAN’s moat is real, but the numbers still show a business that is not yet converting that moat into durable cash generation. Revenue is only holding around the high-$200M range, operating margin is still negative, and levered free cash flow is just $24.8M, so the current setup does not yet justify a more aggressive rating.
I would raise my rating more towards a Hold if revenue can stay above $290M for two consecutive quarters, meaning the recent stabilization is holding through a softer patch, and if levered free cash flow moves above $40M over the next twelve months, which would show the business is finally turning gross profit into cash at a better pace. A cleaner path to a Buy would require operating margin turning positive, because that would tell me overhead is being absorbed rather than merely offset by gross profit. On the downside, I would move from Sell toward Strong Sell if revenue slips back below $280M in a quarter and EBITDA falls under $20M, since that would tell me the current margin base is not stable enough to support the $0.59 forward EPS and would likely keep the stock pinned near a low EV/revenue multiple.
Weighing both sides, I think the bear case is more likely to show up first because the company has not yet proven to me that the 2025 cost reset can hold through a weaker demand period. I would rather wait for one more quarter of stable revenue and better free cash flow before moving off Sell.
What to Watch Next
- Revenue above $290M for two straight quarters — would support a move toward Hold.
- Levered free cash flow above $40M over the next twelve months — would show better cash conversion.
- Operating margin turning positive — would signal the reset is finally creating operating leverage.
- Revenue below $280M with EBITDA under $20M — would strengthen the bear case.
- Net debt/EBITDA staying near 1.7x or rising — would keep refinancing risk in focus.
What’s your take? I rated Adtran Holdings (ADTN) SELL above — but the goal here is to get this right, not just to publish an opinion. What would you add to this analysis, or which risk or catalyst do you think I’m under- or over-weighting? Tell me in the comments.
Sources
- SEC 10-K Annual Report — filed 2026-02-26
- SEC 8-K Filing (2026-05-18)
- SEC 8-K Filing (2026-05-05)
- SEC 8-K Filing (2026-04-07)
- SEC 8-K Filing (2026-02-26)
- SEC 8-K Filing (2026-01-22)
- SEC Form 4 Insider Transaction (2026-05-22)
- SEC Form 4 Insider Transaction (2026-05-11)
- SEC Form 4 Insider Transaction (2026-04-03)
- SEC 10-K Annual Report — FY2026
- SEC 10-K Annual Report — FY2025
- SEC 10-K Annual Report — FY2024
- SEC 10-K Annual Report — FY2023
- SEC 10-K Annual Report — FY2022
Data sourced from Yahoo Finance and SEC EDGAR. Not investment advice.
Leave a Comment