
| Company | Aug 25 | Sep 25 | Oct 25 | Nov 25 | Dec 25 | Jan 26 | Feb 26 | Mar 26 | Apr 26 | May 26 | Jun 26 | Jul 26 | 12-Mo |
|---|---|---|---|---|---|---|---|---|---|---|---|---|---|
| CLOV | -9% | +17% | +15% | -29% | -6% | -5% | -7% | -16% | +56% | +45% | +32% | -20% | +44% |
| ALHC | +19% | +7% | -3% | +14% | +3% | +14% | -15% | -8% | +28% | -32% | +55% | -38% | +8% |
| OSCR | +19% | +14% | -5% | -0% | -20% | -0% | -5% | -16% | +61% | +20% | +28% | +9% | +122% |
| MOH | +15% | +6% | -20% | -3% | +17% | +3% | -14% | -13% | +46% | -11% | +32% | -14% | +24% |
| CI | +13% | -4% | -15% | +13% | -0% | -0% | +6% | -7% | +9% | -5% | -0% | +1% | +7% |
| EVH | -4% | -12% | -21% | -37% | -5% | -20% | +1% | -30% | +64% | +5% | +37% | -43% | -69% |
Source: Yahoo Finance monthly adjusted close.
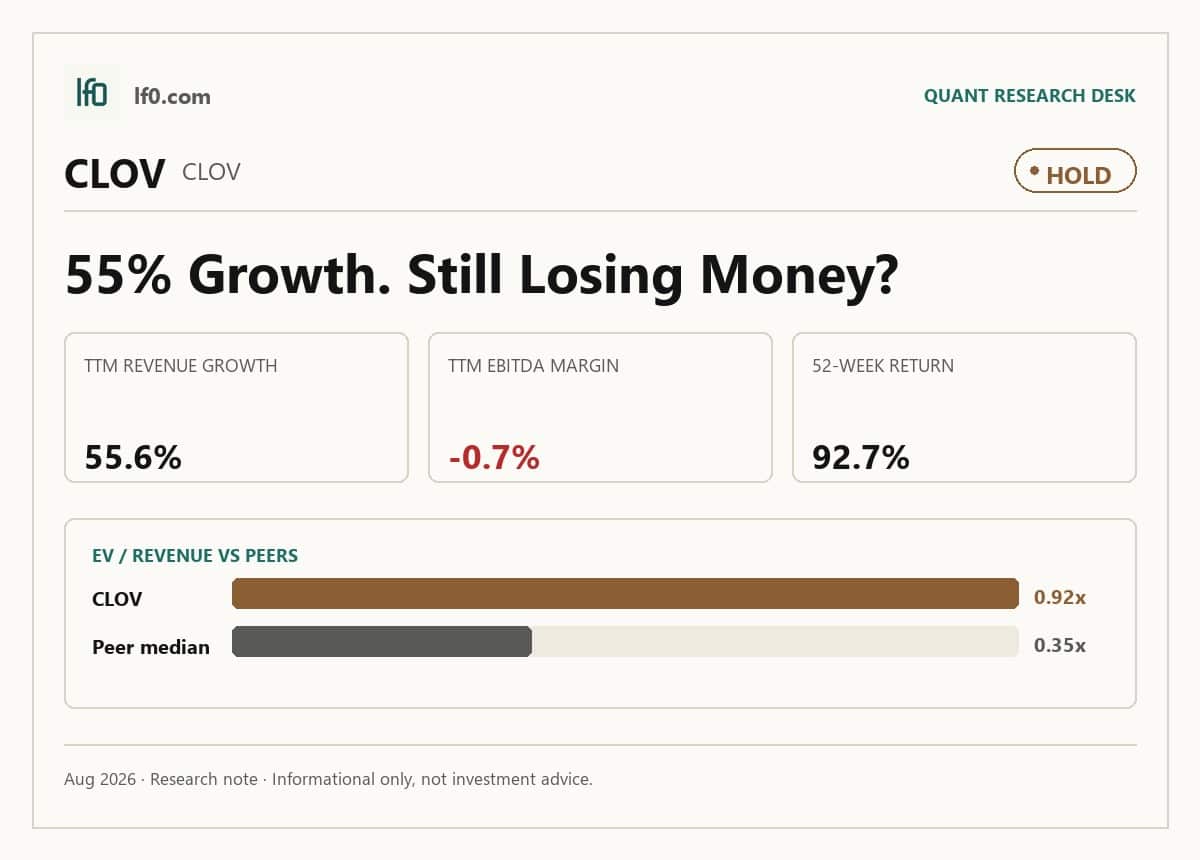
Executive Summary
Rating: HOLD | CLOV
Measured from adjusted close on 2026-08-10 to 2026-09-25. Sell ratings are correct when the stock falls; Hold is tracked as a +/-10% range. Daily-close data, not intraday. Calls are tracked for 182 days from publication, then frozen as a final record.
I would put my rating as a Hold because Clover Health has finally shown a profitable quarter, but the latest inflection is not yet enough to prove that the model has moved beyond volatility. Revenue reached $749.2M in Q1 2026 and EBITDA turned positive at $27.8M, yet trailing EBITDA margin was still -0.7% and free cash flow yield was only 2.9%, so the market is still paying for execution that has not fully shown up in the trailing numbers. I would raise my rating more towards a Buy if Clover can keep revenue above $700M in the next two quarters while holding EBITDA margin positive, because that would tell me the Q1 step-up was not a one-off.
Company Profile
Clover Health Investments Corp. provides Medicare Advantage insurance and physician enablement software. It earns premiums from Medicare Advantage members and pays providers to use Clover Assistant, a cloud-based platform that curates data from more than 100 sources and supports point-of-care decisions. The company also launched Counterpart Health in 2024 to sell the same platform externally as software and tech-enabled services. Clover was incorporated in 2019, went public in 2020 through a SPAC merger, and as of January 1, 2026 its Medicare Advantage plans operated in five states and 203 counties while its PPO plans were licensed in 45 states and Washington, D.C. It is remote-first, has no headquarters, and had 724 employees at December 31, 2025.
Economic Moat
Business Model
The core moat claim is not the insurance book itself; it is the data loop around Clover Assistant. In my view, the platform is harder to copy than the interface suggests because it combines beneficiary data with provider-generated data, then feeds that usage back into clinical rules and machine-learning models. That feedback loop is reinforced by workflow integration with Epic, Cerner, and Athena, so a rival would need to match both the software and the embedded clinical context. Clover Home Care extends the same model into high-acuity, home-based primary care, and Counterpart Health broadens the addressable market without requiring a new product build.
Business & Operating Risks
The main disclosed risk is that medical costs and risk adjustment can outrun the premium model. Clover’s Medicare Advantage bids are set a year in advance, CMS can retroactively adjust payments, and the company must spend at least 85% of premium dollars on care, so pricing error can quickly become margin pressure. A second risk is adoption: the filing highlights provider resistance, integration problems, and weak brand recognition as threats to Clover Assistant and Counterpart Assistant. Regulatory exposure is also broad, including DOJ scrutiny, HIPAA, the Anti-Kickback Statute, and possible FDA oversight of Clover Assistant. These risks do not break the moat outright, but they do threaten the managed-cost advantage the platform is supposed to create if adoption or clinical performance disappoints.
Management Discussion & Analysis
Management appears to be responding to those risks by pushing membership growth and externalizing the platform, but it has not yet proven to me that the operating model is stable. The company entered 2026 with more than 153,000 members and over 97% in PPO plans, while 2025 revenue rose 40.3% to $1.9B; however, net medical claims also rose 55.9% to $1.6B and adjusted EBITDA fell to $21.7M from $70.1M in 2024. That tells me scale is still outrunning cost discipline, even as management keeps leaning on the same software-led care narrative. The March 2026 CFO transition adds another layer of execution risk, because the new finance lead now has to show that the Q1 2026 profit inflection can hold.
Recent Events
The most important recent event was the CFO handoff in March 2026, when Peter Kuipers stepped down and Clay Thornton became interim chief financial officer. I read that as a test of reporting discipline and capital allocation rather than a threat to the moat itself. Clover also issued its full-year 2025 earnings release in February 2026 and followed with shareholder Q&A in March and May, which suggests management is still trying to explain the operating model to investors rather than relying on a self-evident rerating catalyst. The recent events do not change the moat thesis, but they do show that execution remains under a microscope.
Financial Analysis
Growth
CLOV — Financial Growth (Quarterly, USD Mil)
| Metric | 2025-03-31 | 2025-06-30 | 2025-09-30 | 2025-12-31 | 2026-03-31 | 2026-06-30 |
|---|---|---|---|---|---|---|
| REVENUE (USD Mil) | 462.3 | 477.6 | 496.6 | 487.7 | 749.2 | — |
| EBIT (USD Mil) | -1.3 | -10.6 | -24.4 | -49.3 | 27.3 | — |
| EBITDA (USD Mil) | -0.8 | -10.2 | -24 | -48.9 | 27.8 | — |
| NET INCOME (USD Mil) | -1.3 | -10.6 | -24.4 | -49.3 | 27.3 | — |
| DILUTED EPS | — | 0 | -0.1 | -0.1 | 0.1 | 0.1 |
Source: Yahoo Finance — Quarterly Financial Statements
Clover’s revenue rose from $462.3M in Q1 2025 to $749.2M in Q1 2026, a 62.0% increase that is much stronger than the prior three quarters’ low-single-digit year-over-year growth. That step-up matters because it suggests the business is finally scaling into a larger base, not just grinding out incremental membership gains. EBITDA also moved from losses in 2025 to $27.8M in Q1 2026, which is the first sign that the growth engine is beginning to cover fixed costs.
Profitability
CLOV — Profitability (TTM)
| Metric | TTM |
|---|---|
| Operating Margin (TTM) | 3.8% |
| Net Margin (TTM) | -0.7% |
| Return on Assets (TTM) | -1.8% |
| Return on Equity (TTM) | -5.1% |
| Gross Margin (TTM) | 18.5% |
| EBITDA Margin (TTM) | -0.7% |
Source: Yahoo Finance — Trailing Twelve Months (TTM)
TTM operating margin was 3.8%, gross margin was 18.5%, EBITDA margin was -0.7%, net margin was -0.7%, ROA was -1.8%, and ROE was -5.1%. The spread between gross margin and operating margin shows the company still carries a heavy opex load, so the model is not yet converting revenue into durable earnings power. I would watch EBITDA margin first, because a sustained positive margin would tell me the business is moving from growth funded by capital to growth funded by operations. The latest quarter was profitable, but the trailing numbers still say the turnaround is incomplete.
Valuation
CLOV — Valuation Multiples
| Metric | Value |
|---|---|
| Market Cap (USD Mil) | 2,410 |
| Enterprise Value (USD Mil) | 2,285 |
| Trailing P/E | — |
| Forward P/E | 30.5 |
| Price/Sales (TTM) | 1 |
| Price/Book (mrq) | 7.1 |
| EV/Revenue | 0.9 |
| EV/EBITDA | -127.3 |
| Beta (5Y Monthly) | 2.48 |
| FCF Yield % (TTM) | 2.9% |
| Forward EPS (USD) | 0.1 |
| Analyst Target Price – Low (USD) | 5 |
| Analyst Target Price – Mean (USD) | 5.2 |
| Analyst Target Price – High (USD) | 5.5 |
| # Analyst Opinions | 3 |
Source: Yahoo Finance
Clover trades at 0.9x EV/Revenue, 1.0x price/sales, and 7.1x price/book, with a market cap of $2.4B and enterprise value of $2.3B. Forward P/E is 30.5x on forward EPS of $0.1, which means the market is already discounting a move to sustained earnings rather than just one profitable quarter. On the analysis here, I would put fair value in a range of about $3-$5.5 per share. That range sits inside the $5–$5.5 analyst target band from three opinions, so the consensus is not wildly off, but I think the market is still paying up for a profitability reset that has only just started. The current price near 5.6 leaves little room for disappointment, especially with leverage still thin and cash conversion only modest.
Leverage
CLOV — Leverage & Coverage (Quarterly)
| Metric | Value |
|---|---|
| Current Ratio (mrq) | 1.5 |
| Operating Cash Flow (TTM, USD Mil) | 77 |
| Levered Free Cash Flow (TTM, USD Mil) | 69 |
| Net Debt/EBITDA (TTM) | 13.5 |
| FCF Margin % (TTM) | 2.8% |
Source: Yahoo Finance — Quarterly Financial Statements
Clover has no debt, a current ratio of 1.5x, and $243.1M of cash, so there is no refinancing wall in front of it. Operating cash flow was $77M TTM and levered free cash flow was $69.1M, which gives the company some breathing room while it tries to turn the Q1 2026 profit into a repeatable pattern. Net debt/EBITDA of 13.5x is not a useful leverage read in the usual sense because debt is zero and EBITDA is still small; the cleaner takeaway is that the balance sheet is cash-backed, but not yet a source of real flexibility. That matters because the equity case depends on margin improvement doing the heavy lifting, not on debt paydown.
Insider Activity
The insider tape is one-sided. The transactions shown are all open-market sales, including sales by the CEO, a director, and another senior executive, so I see weak internal conviction at a time when the stock has already rerated sharply. That does not prove the thesis is wrong, but it does tell me management has not been stepping in as buyers.
Comparable Analysis
Growth
| Company | Revenue TTM (USD Mil) | Revenue Growth YoY % | Diluted EPS TTM |
|---|---|---|---|
| CLOV | 2,475.9 | 55.6% | -0.1 |
| ALHC | 4,577.3 | 31.6% | 0.2 |
| OSCR | 15,318.6 | 70.4% | 1.3 |
| MOH | 42,469 | -5.7% | 0.2 |
| CI | 282,382 | 6.7% | 24.2 |
| EVH | 2,097 | 46.9% | -4.5 |
Source: Yahoo Finance
Clover’s 55.6% TTM revenue growth is faster than ALHC at 31.6% and CI at 6.7%, but slower than OSCR at 70.4% and EVH at 46.9%. That puts CLOV in the middle of the growth pack, so the market can justify some premium for expansion, but not a top-of-group multiple unless the growth starts to show up in cash generation.
Valuation
| Company | Forward P/E | EV/Revenue | EV/EBITDA | Price/Sales (TTM) | Price/Book (mrq) | Market Cap (USD Mil) | Enterprise Value (USD Mil) | Beta (5Y Monthly) | FCF Yield % (TTM) | Forward EPS | Analyst Target Price – Low | Analyst Target Price – Mean | Analyst Target Price – High | # Analyst Opinions |
|---|---|---|---|---|---|---|---|---|---|---|---|---|---|---|
| CLOV | 30.5 | 0.9 | -127.3 | 1 | 7.1 | 2,410 | 2,285 | 2.48 | 2.9% | 0.1 | 5 | 5.2 | 5.5 | 3 |
| ALHC | 19 | 0.6 | 29.9 | 0.6 | 11.1 | 2,959 | 2,610 | 1.13 | 6.4% | 0.8 | 16 | 24.1 | 30 | 13 |
| OSCR | 16.8 | 0 | 0.8 | 0.6 | 5.2 | 8,898 | 532 | 2.38 | 7.8% | 1.7 | 19 | 28.2 | 39 | 10 |
| MOH | 20.6 | 0.1 | 13.6 | 0.2 | 2.5 | 10,466 | 5,293 | 0.75 | 6.7% | 9.7 | 147 | 209.1 | 266 | 17 |
| CI | 8.5 | 0.4 | 7.8 | 0.3 | 1.8 | 75,475 | 99,556 | 0.32 | 10.6% | 33.5 | 290 | 341.4 | 400 | 24 |
| EVH | 11.2 | 0.6 | 21.3 | 0.2 | 1.2 | 464 | 1,301 | 0.78 | 39.8% | 0.4 | 3 | 5.8 | 8 | 13 |
Source: Yahoo Finance
CLOV trades at 0.9x EV/Revenue and 1.0x price/sales, versus ALHC at 0.6x and 0.6x, OSCR at 0.0x and 0.6x, MOH at 0.1x and 0.2x, CI at 0.4x and 0.3x, and EVH at 0.6x and 0.2x. The more telling cash metric is CLOV’s 2.9% FCF yield, which trails ALHC, OSCR, MOH, CI, and EVH, so I feel the market is already paying for a recovery that still needs to show up in cash. That gap is wider than the growth gap alone would justify, which is why I think the stock screens richer than the operating trend would normally support.
Profitability
| Company | Operating Margin (TTM) | Net Margin (TTM) | Return on Assets (TTM) | Return on Equity (TTM) | Gross Margin (TTM) | EBITDA Margin (TTM) |
|---|---|---|---|---|---|---|
| CLOV | 3.8% | -0.7% | -1.8% | -5.1% | 18.5% | -0.7% |
| ALHC | 3.2% | 0.9% | 3.1% | 20.0% | 12.6% | 1.9% |
| OSCR | 8.0% | 3.6% | 4.5% | 34.3% | 20.2% | 4.3% |
| MOH | 1.4% | -0.0% | 1.2% | -0.2% | 8.4% | 0.9% |
| CI | 4.0% | 2.3% | 4.5% | 16.8% | 9.1% | 4.5% |
| EVH | -1.3% | -24.1% | -0.8% | -67.0% | 17.2% | 2.9% |
Source: Yahoo Finance
CLOV’s 18.5% gross margin is above ALHC, EVH, and MOH, but its 3.8% operating margin, -0.7% net margin, and -0.7% EBITDA margin lag OSCR, CI, and ALHC. The read-through is that the problem is not gross profit generation; it is operating leverage, which is still weaker than the better peers. In other words, the moat may be helping at the service layer, but it has not yet translated into peer-leading returns.
Leverage
| Company | Current Ratio (mrq) | Operating Cash Flow TTM (USD Mil) | Free Cash Flow TTM (USD Mil) | Net Debt/EBITDA (TTM) | FCF Margin % (TTM) |
|---|---|---|---|---|---|
| CLOV | 1.5 | 77 | 69 | 13.5 | 2.8% |
| ALHC | 1.7 | 205.6 | 188.6 | -4.2 | 4.1% |
| OSCR | 1.1 | 4,418.6 | 692.5 | -12.3 | 4.5% |
| MOH | 1.7 | 365 | 700.2 | -12.7 | 1.7% |
| CI | 0.8 | 10,277 | 7,980.1 | 1.9 | 2.8% |
| EVH | 1.2 | 54.3 | 184.3 | 14 | 8.8% |
Source: Yahoo Finance
CLOV is cleaner than most peers on debt because it has no funded debt and a 1.5x current ratio, while ALHC, OSCR, MOH, CI, and EVH all carry meaningful leverage. The offset is that CLOV’s cash conversion is still thin at a 2.8% FCF margin, so the balance sheet advantage is defensive rather than offensive. I think that is why the market gives CLOV some credit for safety, but not enough to treat it like a self-funding compounder yet.
Conclusion
I would put my rating as a Hold because the key tension is now clear: Clover has finally produced a profitable quarter, but the trailing numbers still do not show durable earnings power. Q1 2026 revenue of $749.2M and EBITDA of $27.8M are encouraging, yet TTM EBITDA margin remains -0.7% and free cash flow yield is only 2.9%, so the latest improvement has not yet become a full-year pattern.
I would move from Hold to Buy if Clover can keep revenue above $700M in the next two quarters and hold EBITDA margin positive, because that would tell me the Q1 inflection is repeatable and that the platform is starting to fund itself. I would move from Hold to Sell if revenue growth falls back below 20% year over year or if free cash flow margin slips under 2.0%, because that would suggest the Q1 jump was a one-quarter step-up rather than a durable run rate. Another reason I would turn more cautious is continued insider selling without offsetting purchases, since the current tape already shows management distributing stock while the equity trades near 5.6.
For now, I think the balance of evidence still favors patience over aggression. The balance sheet gives Clover time, but the market is already paying for execution, so I want to see another quarter of positive EBITDA before I move higher on the scale.
What’s your take? I rated Clover Health (CLOV) HOLD above — but the goal here is to get this right, not just to publish an opinion. What would you add to this analysis, or which risk or catalyst do you think I’m under- or over-weighting? Tell me in the comments.
Sources
- SEC 10-K Annual Report — filed 2026-02-27
- SEC 8-K Filing (2026-05-18)
- SEC 8-K Filing (2026-05-06)
- SEC 8-K Filing (2026-04-01)
- SEC 8-K Filing (2026-03-06)
- SEC 8-K Filing (2026-02-26)
- SEC 8-K Filing (2026-01-14)
- SEC Form 4 Insider Transaction (2026-05-28)
- SEC Form 4 Insider Transaction (2026-05-19)
- SEC Form 4 Insider Transaction (2026-05-18)
- SEC 10-K Annual Report — FY2026
- SEC 10-K Annual Report — FY2025
- SEC 10-K Annual Report — FY2024
- SEC 10-K Annual Report — FY2023
- SEC 10-K Annual Report — FY2022
Data sourced from Yahoo Finance and SEC EDGAR. Not investment advice.
Leave a Comment