
| Company | Sep 25 | Oct 25 | Nov 25 | Dec 25 | Jan 26 | Feb 26 | Mar 26 | Apr 26 | May 26 | Jun 26 | Jul 26 | Aug 26 | 12-Mo |
|---|---|---|---|---|---|---|---|---|---|---|---|---|---|
| BAM | -5% | -5% | -2% | -1% | -5% | -5% | -5% | +8% | +2% | -8% | +8% | +7% | -11% |
| BLK | +4% | -7% | -3% | +3% | +5% | -5% | -9% | +11% | -2% | -8% | +13% | +6% | +5% |
| BX | -0% | -14% | +1% | +5% | -8% | -19% | +1% | +9% | -6% | +1% | +9% | +13% | -13% |
| APO | -2% | -7% | +6% | +10% | -7% | -22% | +7% | +16% | +0% | -8% | +6% | +9% | +2% |
| KKR | -7% | -9% | +4% | +4% | -10% | -23% | +5% | +13% | -8% | -4% | +11% | +8% | -21% |
Source: Yahoo Finance monthly adjusted close.
Quick Thesis
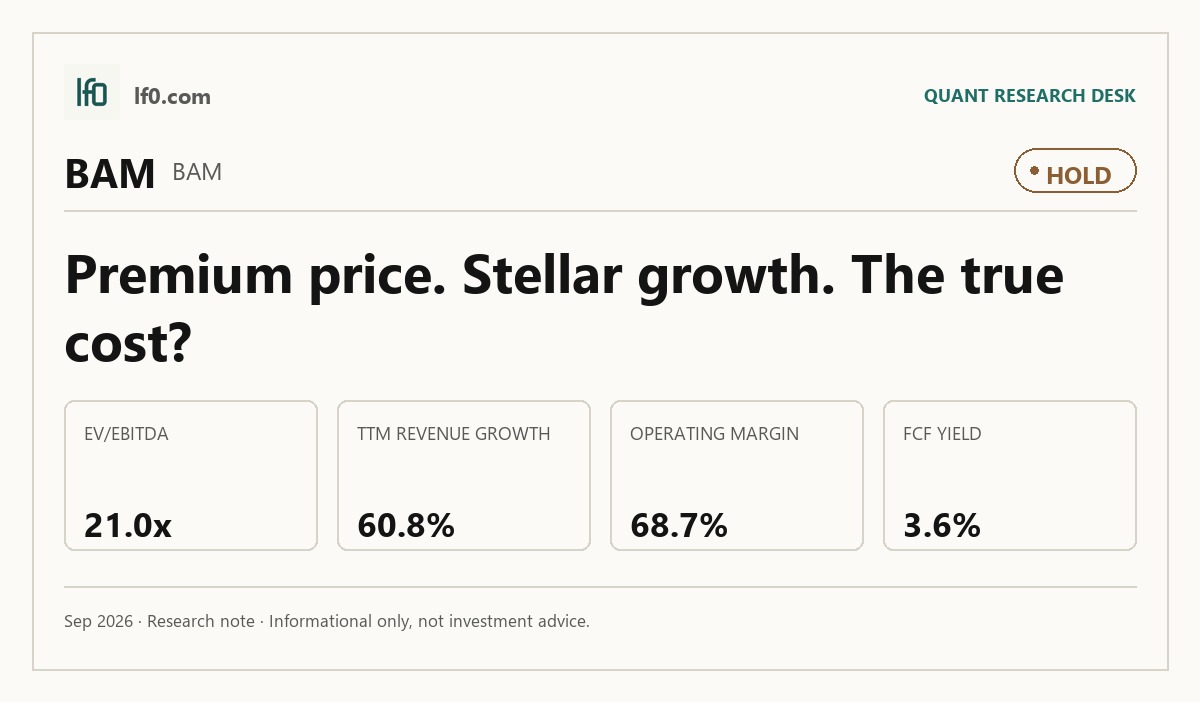
- Rated hold because the premium multiple already discounts Brookfield’s fee-growth quality.
- Strongest strength: 87% of $603B fee-bearing capital is long-dated or perpetual.
- Main risk: regulatory and compliance exposure across many jurisdictions.
- Valuation is rich at 21.0x EV/EBITDA and 14.0x EV/Revenue.
- I would turn more constructive if fee-bearing capital moves above $650B and FCF yield improves.
Executive Summary
Rating: HOLD | BAM
We’ll begin tracking this call’s performance since publication once sufficient adjusted-close data is available.
I would put my rating as a Hold because Brookfield Asset Management’s quality is excellent, but the stock already prices in much of that durability. Fee-bearing capital reached $602.7B at December 31, 2025, and 87% of it was long-dated or perpetual, which gives the fee base real visibility. The issue is valuation: at 21.0x EV/EBITDA and 14.0x EV/Revenue, the market is paying up for continued execution rather than for a clear margin of safety. I would become more constructive if fee-bearing capital moves above $650B, meaning the platform is still compounding at scale, and if FCF yield moves closer to 4.5%, which would give investors a better cash return for the same quality.
Company Profile
Brookfield Asset Management is a global alternative asset manager focused on infrastructure, renewable power and transition, private equity, real estate, and credit. It earns management fees, incentive fees, and carried interest by raising client capital and deploying it across long-duration assets. As of December 31, 2025, it had over $1T of assets under management and $603B of fee-bearing capital, with 87% of that capital long-dated or perpetual. The company is headquartered in New York, operates across 32 global offices, and has over 5,800 investment and asset management professionals. Class A shares trade on the NYSE and TSX under BAM.
Economic Moat
Business Model
Brookfield’s deepest structural edge is the combination of long-dated fee-bearing capital and operating expertise. In my view, that mix is hard for a competitor to copy quickly because it requires both permanent client relationships and the ability to buy, improve, and recycle large assets at scale. Fee-bearing capital was $603B at December 31, 2025, and 87% was long-dated or perpetual, so the earnings base is more stable than a shorter-duration fundraising model. That moat is reinforced by more than $1T of assets under management, over 2,400 institutional clients, and 32 global offices, which widen sourcing and distribution.
The platform also looks broader than it did a year ago. The 2026 filing shows over 5,800 professionals and 55 unique active strategies, versus a much smaller operating footprint in the prior year, and that expansion matters because it gives Brookfield more ways to gather capital and cross-sell products. Newer vehicles such as Brookfield AI Infrastructure Fund, Brookfield Infrastructure Structured Solutions Fund, Catalytic Transition Fund, Brookfield Private Equity Fund, and Brookfield Real Estate Income Trust extend the franchise into more channels. In my view, the moat is not just scale; it is the combination of scale, product breadth, and operating know-how.
Business & Operating Risks
The most material disclosed risk is regulatory and compliance drag. Brookfield operates across the U.S., Europe, the U.K., Canada, Brazil, Colombia, Australia, India, and South Korea, and the filing flags broker-dealer, investment adviser, anti-bribery, sanctions, foreign investment screening, sustainability, and data rules as separate layers of exposure. That matters because the business depends on uninterrupted fundraising and deployment, so a control failure could slow capital raising, raise costs, or damage the franchise’s reputation.
A second risk is dependence on investor confidence. The filing ties poor performance, conflicts of interest, and employee misconduct directly to the risk of capital withdrawals or lower fee commitments, which would hit fee revenue and carried interest rather than just sentiment. A third risk is leverage and covenant pressure: Brookfield is subject to debt covenants that can limit borrowing, distributions, equity issuance, and acquisitions, and higher rates can raise funding costs. The disclosed risks do not threaten the moat itself, but they do threaten the pace at which the moat can compound if compliance or capital markets turn less friendly.
Management Discussion & Analysis
Management is signaling a capital-light, fee-growth-first posture, and I think that is the right response to the risks above. Fee-bearing capital rose to $602.7B at December 31, 2025 from $538.5B a year earlier, while fee revenues increased to $5.5B from $4.7B, so the franchise is still gathering assets and converting scale into recurring fees. The $2.5B of senior note issuance in 2025, including $600M of 5-year bonds at 4.653% and $400M of 10-year bonds at 5.298%, extends funding visibility but also shows the balance sheet is being used to support growth rather than to de-risk aggressively.
Management also repurchased $412M of shares in 2025 while paying $2.8B of dividends, which tells me capital return remains active but secondary to platform expansion. Deployable corporate liquidity was only $3B at December 31, 2025, while uncalled private fund commitments were $110.9B, so the company still needs a functioning fundraising engine to keep the model working. The key point is that management is responding to the disclosed risks by keeping liquidity available and pushing the fee base higher, although realized carried interest remains the cleaner proof point I would want to see more consistently.
Recent Events
The most significant development I see is the $1.0B senior note issuance on April 17, 2026, split between $550.0M due 2031 at 4.832% and $450.0M due 2036 at 5.298%. In my view, that strengthens the thesis by extending funding visibility and locking in long-dated capital at fixed coupons, which supports Brookfield Asset Management’s ability to keep deploying into fee-bearing assets without near-term refinancing pressure.
The May 7, 2026 annual and special meeting was also cleanly supportive. All 12 director nominees were elected, the external auditor was reappointed, and shareholders approved both the new Management Share Option Plan and amendments to the Escrowed Stock Plan. I read that as continuity at the top and a compensation framework that should help retain investment talent, which matters for a manager whose edge depends on sourcing and executing large capital allocations.
The May 8 and May 11, 2026 8-Ks were routine results and press-release filings, with no additional strategic disclosure. Recent events therefore leave the investment case materially unchanged, but the debt raise and shareholder approvals modestly strengthen it by reinforcing balance-sheet flexibility and management continuity.
Financial Analysis
Growth
BAM — Financial Growth (Quarterly, USD Mil)
| Metric | 2025-06-30 | 2025-09-30 | 2025-12-31 | 2026-03-31 | 2026-06-30 |
|---|---|---|---|---|---|
| REVENUE (USD Mil) | 1,153 | 1,140 | 1,236 | 1,242 | 1,200 |
| EBIT (USD Mil) | 713 | 822 | 966 | 954 | 1,445 |
| EBITDA (USD Mil) | 724 | 838 | 976 | 967 | 1,458 |
| NET INCOME (USD Mil) | 620 | 724 | 560 | 617 | 904 |
| DILUTED EPS | 0.4 | 0.4 | 0.3 | 0.4 | 0.6 |
Source: Yahoo Finance — Quarterly Financial Statements
Brookfield’s revenue was broadly flat to slightly up through Q1 2026, then eased in Q2 2026. Revenue was $1.153B in Q2 2025, $1.140B in Q3 2025, $1.236B in Q4 2025, $1.242B in Q1 2026, and $1.200B in Q2 2026. That latest step-down is modest, not thesis-breaking, but it does show the business is still sensitive to timing in fee realization and market-linked income. EBITDA moved more sharply, from $724M in Q2 2025 to $1.458B in Q2 2026, and net income rose from $620M to $904M, so the earnings base is still expanding even when revenue is choppy. I could not identify a clean explanation for the Q2 2026 EBITDA jump from the filing itself, which is worth flagging because the margin expansion is too large to treat as routine.
Profitability
BAM — Profitability (TTM)
| Metric | TTM |
|---|---|
| Operating Margin (TTM) | 68.7% |
| Net Margin (TTM) | 48.9% |
| Return on Assets (TTM) | 13.0% |
| Return on Equity (TTM) | 26.8% |
| Gross Margin (TTM) | 74.4% |
| EBITDA Margin (TTM) | 66.8% |
Source: Yahoo Finance — Trailing Twelve Months (TTM)
TTM gross margin of 74.4% and EBITDA margin of 66.8% show Brookfield keeps most of each dollar after direct costs, which is exactly what I want to see in a fee-based asset manager. Operating margin of 68.7% sits only 5.7 points below EBITDA margin, so overhead is well controlled and the platform is scaling without much operating drag. Net margin of 48.9% is lower by 19.9 points, which tells me below-the-line items still matter, so I weight operating and EBITDA margins more heavily than net margin here. ROA of 13% and ROE of 26.8% show strong capital efficiency, and the gap between them suggests leverage is amplifying returns rather than masking weak asset productivity.
Valuation
BAM — Valuation Multiples
| Metric | Value |
|---|---|
| Current Share Price (USD) | 46 |
| Market Cap (USD Mil) | 73,490 |
| Enterprise Value (USD Mil) | 80,431 |
| Trailing P/E | 26.6 |
| Forward P/E | 21.2 |
| Price/Sales (TTM) | 12.8 |
| Price/Book (mrq) | 9.8 |
| EV/Revenue | 14 |
| EV/EBITDA | 21 |
| Beta (5Y Monthly) | 1.26 |
| FCF Yield % (TTM) | 3.6% |
| Forward EPS (USD) | 2.2 |
| Analyst Target Price – Low (USD) | 44 |
| Analyst Target Price – Mean (USD) | 57.5 |
| Analyst Target Price – High (USD) | 70 |
| # Analyst Opinions | 18 |
Source: Yahoo Finance
Brookfield trades at 26.6x trailing P/E and 21.2x forward P/E, with 12.8x Price/Sales, 9.78x Price/Book, 14.0x EV/Revenue, and 21.0x EV/EBITDA. The market is also paying a 4.07% FCF yield on a business with 46.62% FCF margin, so investors are clearly underwriting durable fee growth and cash conversion. Analyst targets cluster from $44 to $70, with a $57.5 mean across 18 opinions, which tells me there is real coverage and the Street is not wildly off base.
On my read, fair value sits around $44–$58 per share. That range sits mostly inside the analyst consensus band and slightly below the current price, which makes sense because I give more weight to the cash-flow yield and leverage profile than to the headline growth rate alone. On earnings, I would frame a reasonable range around 2.17 of forward EPS, versus Brookfield’s own 2.2 forward EPS and materially below BlackRock’s 64.3 and Blackstone’s 7.5 on a like-for-like basis. That comparison matters because Brookfield’s premium is not being driven by the biggest per-share earnings base in the group; it is being driven by a steadier fee stream and better margin quality.
Leverage
BAM — Leverage & Coverage (Quarterly)
| Metric | Value |
|---|---|
| Total Debt/Equity % (mrq) | 34.5 |
| Current Ratio (mrq) | 1.3 |
| Total Debt (mrq, USD Mil) | 4,089 |
| Operating Cash Flow (TTM, USD Mil) | 2,341 |
| Levered Free Cash Flow (TTM, USD Mil) | 2,674.4 |
| Net Debt/EBITDA (TTM) | 0.7 |
| FCF Margin % (TTM) | 46.6% |
Source: Yahoo Finance — Quarterly Financial Statements
Brookfield’s leverage is modest and the cash profile is strong. Total debt/equity is 34.5%, current ratio is 1.3x, and total debt is $4.1B, which gives the balance sheet room to absorb a downturn without immediate funding stress. Operating cash flow is $2.3B and levered free cash flow is $2.7B, so cash generation comfortably covers debt service needs and supports capital returns. Net debt/EBITDA is 0.7x and FCF margin is 46.6%, which tells me the business is converting earnings into cash efficiently.
The one thing I would watch is the quality of that cash conversion. The leverage profile looks clean, but the model still depends on continuous fundraising across multiple jurisdictions, so a slowdown in fee-bearing capital growth would hit fee revenue quickly even if the balance sheet itself stayed intact. In other words, the leverage risk is not a classic solvency problem; it is a compounding problem if growth slows before the premium multiple has time to earn itself.
Insider Activity
The insider transaction record here is limited to five Form 4 filings from 2025-12-31 to 2026-03-31, and none of them are open-market purchases or sales. I read that as neutral rather than informative on alignment, because the activity is entirely non-market and does not show insiders buying or selling at market prices.
Comparable Analysis
Growth
| Company | Revenue TTM (USD Mil) | Revenue Growth YoY % | Diluted EPS TTM |
|---|---|---|---|
| BAM | 5,737 | 60.8% | 1.7 |
| BLK | 27,299 | 30.6% | 40.9 |
| BX | 15,483.3 | 28.6% | 4.4 |
| APO | 35,598 | 63.8% | 2.7 |
| KKR | 25,833.1 | 7.8% | 3 |
Source: Yahoo Finance
Brookfield’s revenue growth of 60.8% TTM is ahead of Blackstone’s 28.6%, BlackRock’s 30.6%, and KKR’s 7.8%, and only slightly behind Apollo’s 63.8%. That is a strong result, but it also means Brookfield is already near the top of the group, so the market is paying for continued scale gains rather than a catch-up trade. In my view, the growth premium is justified on a top-line basis, but it is not obviously cheap.
Valuation
| Company | Current Share Price (USD) | Trailing P/E | Forward P/E | EV/Revenue | EV/EBITDA | Price/Sales (TTM) | Price/Book (mrq) | Market Cap (USD Mil) | Enterprise Value (USD Mil) | Beta (5Y Monthly) | FCF Yield % (TTM) | Forward EPS | Analyst Target Price – Low | Analyst Target Price – Mean | Analyst Target Price – High | # Analyst Opinions |
|---|---|---|---|---|---|---|---|---|---|---|---|---|---|---|---|---|
| BAM | 46 | 26.6 | 21.2 | 14 | 21 | 12.8 | 9.8 | 73,490 | 80,431 | 1.26 | 3.6% | 2.2 | 44 | 57.5 | 70 | 18 |
| BLK | 1,066.7 | 26.1 | 16.6 | 6.3 | 15.6 | 6.3 | 2.9 | 173,307 | 173,245 | 1.43 | 4.4% | 64.3 | 1,190 | 1,323.3 | 1,488 | 16 |
| BX | 124 | 28.2 | 16.6 | 8.1 | — | 9.6 | 11 | 148,229 | 125,259 | 1.56 | — | 7.5 | 119 | 144.4 | 184 | 21 |
| APO | 124.2 | 45.5 | 11.6 | 2.5 | — | 2.1 | 3.6 | 73,316 | 89,458 | 1.51 | — | 10.7 | 130 | 153.5 | 173 | 19 |
| KKR | 98.4 | 32.3 | 13.3 | 5.8 | — | 3.5 | 3.1 | 90,918 | 148,917 | 1.79 | — | 7.4 | 115 | 128.7 | 166 | 20 |
Source: Yahoo Finance
Brookfield’s 14.0x EV/Revenue and 21.0x EV/EBITDA are richer than BlackRock’s 6.3x and 15.6x, and far above Apollo’s 2.5x EV/Revenue and KKR’s 5.8x. Using peer EV/Revenue of 2.5x to 8.1x on Brookfield’s $5.7B TTM revenue gives an illustrative enterprise value of $14.4B to $46.4B, or roughly $6.5 to $27.0 per share after net debt and shares outstanding, which is far below the current $46.01 share price. That gap is the cleanest proof that the stock trades on a premium multiple, not on a peer-average cash-flow profile. Brookfield’s 3.6% FCF yield also trails BlackRock’s 4.4%, while BlackRock’s 0.1x net debt/EBITDA shows why investors are willing to pay up for balance-sheet safety as well as earnings quality.
Profitability
| Company | Operating Margin (TTM) | Net Margin (TTM) | Return on Assets (TTM) | Return on Equity (TTM) | Gross Margin (TTM) | EBITDA Margin (TTM) |
|---|---|---|---|---|---|---|
| BAM | 68.7% | 48.9% | 13.0% | 26.8% | 74.4% | 66.8% |
| BLK | 35.1% | 24.1% | 3.7% | 12.3% | 47.1% | 40.7% |
| BX | 54.4% | 22.7% | 14.3% | 31.4% | 100.0% | — |
| APO | 22.0% | 5.3% | 0.9% | 11.4% | 36.1% | — |
| KKR | 20.6% | 12.2% | 1.4% | 7.3% | 54.8% | — |
Source: Yahoo Finance
Brookfield separates itself on margins. Its 68.7% operating margin, 74.4% gross margin, 66.8% EBITDA margin, and 48.9% net margin all exceed BlackRock’s 35.1%, 47.1%, 40.7%, and 24.1%, while also topping Blackstone’s 54.4% and 22.7%, Apollo’s 22.0% and 5.3%, and KKR’s 20.6% and 12.2%. The margin premium is structural, not cyclical, because Brookfield’s fee-based model is closer to an asset-light platform than to a balance-sheet-heavy investment business.
Leverage
| Company | Total Debt/Equity % (mrq) | Current Ratio (mrq) | Total Debt (mrq, USD Mil) | Net Debt/EBITDA (TTM) | FCF Margin % (TTM) |
|---|---|---|---|---|---|
| BAM | 34.5 | 1.3 | 4,089 | 0.7 | 46.6% |
| BLK | 23.2 | 2.4 | 14,968 | 0.1 | 27.8% |
| BX | 68.2 | 0.9 | 15,296.1 | — | — |
| APO | 101 | 1.9 | 41,884 | — | — |
| KKR | 69.8 | 0.9 | 56,164 | — | — |
Source: Yahoo Finance
Brookfield’s 34.5% debt/equity and 0.7x net debt/EBITDA sit comfortably below Blackstone’s 68.2%, Apollo’s 101.0%, and KKR’s 69.8%, while its 46.6% FCF margin is far above BlackRock’s 27.8%. That combination explains part of the valuation premium: investors are paying for a cleaner balance sheet and stronger cash conversion, not just for growth. The leverage gap matters because it gives Brookfield more room to keep compounding without forcing equity dilution or defensive capital raising.
Conclusion
I would put my rating as a Hold because Brookfield’s moat is real, but the stock already prices in a lot of the quality. The tension I see is simple: fee-bearing capital reached $602.7B, 87% of it is long-dated or perpetual, and margins are excellent, yet the shares still trade at 21.0x EV/EBITDA and only 3.6% FCF yield. In other words, the business is doing what it should, but the market is already paying for that outcome.
I would raise my rating more toward a Buy if fee-bearing capital moves above $650B, meaning the platform is still compounding at scale, and if FCF yield moves closer to 4.5%, which would show the stock is offering a better cash return for the same quality. A cleaner bull case would also include realized carried interest turning more consistently positive, because that would convert part of the current mark-to-market earnings into cash and make the 2025 to 2026 earnings step-up look more durable.
I would move from Hold to Sell if fee-bearing capital stalls below $600B for two consecutive quarters or if net debt/EBITDA drifts above 1.0x, because that would tell me the balance sheet is being used to support growth without enough new capital coming in. The other bear trigger is a visible slowdown in fee revenue growth from the $5.5B level in 2025, since that would mean the market is paying a premium multiple for a platform that is no longer compounding as fast as the current valuation assumes.
My final view is still Hold. The business quality is high enough to deserve a premium, but the current price leaves too little room for a stumble, so I want to see the next leg of fee-bearing capital growth before I get more aggressive.
What to Watch Next
- Fee-bearing capital above $650B — would support a move toward Buy.
- FCF yield near 4.5% — would improve the cash-return case.
- Realized carried interest turning consistently positive — would strengthen earnings durability.
- Net debt/EBITDA above 1.0x — would weaken the balance-sheet cushion.
- Fee revenue growth slowing from $5.5B — would argue the premium multiple is less justified.
What’s your take? I rated Brookfield Asset Management (BAM) HOLD above — but the goal here is to get this right, not just to publish an opinion. What would you add to this analysis, or which risk or catalyst do you think I’m under- or over-weighting? Tell me in the comments.
Sources
- SEC 10-K Annual Report — filed 2026-03-02
- SEC 8-K Filing (2026-05-11)
- SEC 8-K Filing (2026-05-08)
- SEC 8-K Filing (2026-05-08)
- SEC 8-K Filing (2026-05-06)
- SEC 8-K Filing (2026-04-17)
- SEC 8-K Filing (2026-04-16)
- SEC Form 4 Insider Transaction (2026-04-02)
- SEC Form 4 Insider Transaction (2026-03-24)
- SEC Form 4 Insider Transaction (2026-02-24)
- SEC 10-K Annual Report — FY2026
- SEC 10-K Annual Report — FY2025
Data sourced from Yahoo Finance and SEC EDGAR. Not investment advice.
Leave a Comment