
| Company | Sep 25 | Oct 25 | Nov 25 | Dec 25 | Jan 26 | Feb 26 | Mar 26 | Apr 26 | May 26 | Jun 26 | Jul 26 | Aug 26 | 12-Mo |
|---|---|---|---|---|---|---|---|---|---|---|---|---|---|
| SIMO | +19% | +3% | -9% | +4% | +28% | +9% | -13% | +95% | +27% | +20% | -24% | -2% | +214% |
| SNDK | +114% | +78% | +12% | +6% | +143% | +10% | -0% | +73% | +55% | +34% | -47% | +29% | +2886% |
| SWKS | +3% | +1% | -14% | -4% | -12% | +8% | -10% | +31% | +12% | -13% | -8% | +8% | -8% |
| WDC | +50% | +25% | +9% | +6% | +45% | +12% | -3% | +61% | +22% | +20% | -15% | -17% | +462% |
| MXL | +2% | -6% | +3% | +12% | -0% | +0% | -0% | +307% | +31% | +38% | -48% | -10% | +281% |
| SYNA | -2% | +4% | -3% | +8% | +11% | -1% | -14% | +34% | +47% | -10% | -14% | -10% | +38% |
Source: Yahoo Finance monthly adjusted close.
Quick Thesis
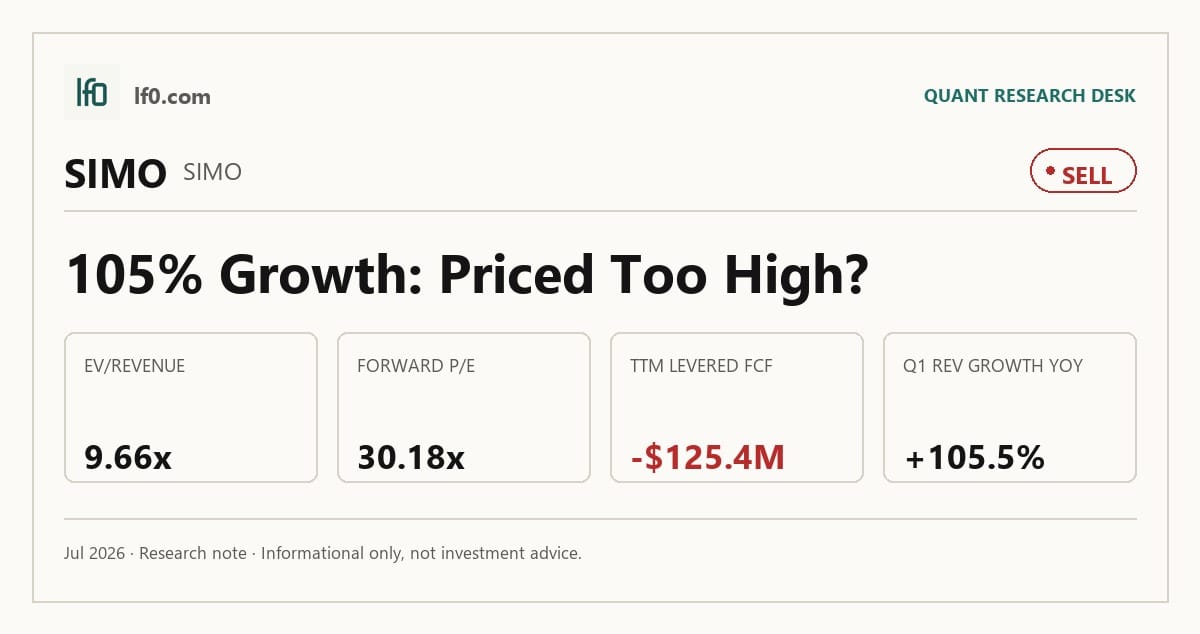
- Rated Sell — the stock prices in a recovery before cash generation has turned.
- Strongest point: Q2 2026 revenue reached $451M, up 127% year over year.
- Biggest risk: levered free cash flow was -$196.9M TTM.
- Valuation is rich at 7.0x EV/revenue and 37.2x EV/EBITDA.
- I would turn more constructive only if free cash flow turns positive and holds for two quarters.
Executive Summary
Rating: SELL | SIMO
We’ll begin tracking this call’s performance since publication once sufficient adjusted-close data is available.
I would put my rating as a Sell because the market is already discounting a durable earnings recovery, but the company has not yet converted that rebound into positive cash flow. Revenue reached $451M in Q2 2026, up from $198.7M a year earlier, and diluted EPS rose to $4.0, so the operating rebound is real; the issue is that TTM levered free cash flow was -$196.9M and FCF yield was -2.1%, which tells me the business is still consuming cash at the current run rate.
In my view, the key tension is between accelerating sales and weak cash conversion. I would raise my rating toward Buy if free cash flow turns positive and stays there for two consecutive quarters, because that would show the earnings recovery is funding itself rather than relying on working-capital release. If revenue slips back below $342.1M in a quarter, roughly the Q1 2026 run rate, I would move further toward Hold or lower because that would suggest the Q2 step-up was cyclical rather than durable.
Company Profile
Silicon Motion Technology Corp. designs NAND flash controllers and SSD solutions for solid-state storage devices. Its revenue comes mainly from SSD controllers for PCs, data centers and client devices, eMMC and UFS controllers for smartphones and IoT devices, and smaller single-chip SSD products for industrial, commercial and automotive uses.
The company was incorporated in the Cayman Islands in 2005 and has been listed on Nasdaq through ADSs since June 2005, with each ADS representing four ordinary shares. It operates globally from Hong Kong, with major sites in Hsinchu and Taipei, Taiwan; Shanghai and Shenzhen, China; and Milpitas, California. A new Taipei office building is under construction and is expected to be completed by end-2029.
Economic Moat
Business Model
The core advantage is Silicon Motion’s controller intellectual property base. In my view, that is hard to replicate quickly because the company has spent more than 20 years building NAND flash controller know-how, holds 3,276 patents and 1,035 pending applications worldwide as of April 7, 2026, and has shipped more than six billion NAND flash controllers over the past decade.
That depth matters because the controllers support NAND from Kioxia, Micron, Samsung, SK Hynix, Sandisk and YMTC, which makes the design-in base broad and sticky. The fabless model also helps: capital and engineering are focused on design, firmware and qualification rather than wafer fabrication, so the moat is rooted in technical depth rather than manufacturing scale.
Business & Operating Risks
The main disclosed risk is customer concentration. Sales to the five largest customers were 61.0% of net revenue in 2023, 66.0% in 2024 and 66.0% in 2025, while customers above 10.0% of net revenue were 45.0%, 57.0% and 58.0% in those same years. A loss or delay at a major account could move the whole model quickly, so this is not boilerplate risk language.
NAND price volatility and supply dependence are the next issue. The company wrote down NAND components and SSDs in inventory for $3.9M in 2023, $0.3M in 2024 and $0.3M in 2025, which shows the cycle has already affected results. It also depends on adequate NAND supply and outside foundries, primarily TSMC and secondarily SMIC, with no long-term agreements in place.
The moat is still intact, but these risks do pressure the edge. The concentration risk does not break the controller franchise itself, yet it does make the business more vulnerable to customer-level order swings and pricing pressure than the patent count alone would suggest.
Management Discussion & Analysis
Management is still investing for growth while returning cash to shareholders. It paid $67.2M of dividends in 2025 and repurchased $24.3M of ADSs, yet it also ended the year with $201.8M of cash and cash equivalents. That tells me the balance sheet is not under strain, but the company is not behaving like a business with excess cash conversion either.
The product mix shift is the most important operating signal. eMMC and UFS controller sales increased 20% to 25% in 2025 and helped gross margin rise to 48.3% from 45.9%, which supports the idea that the company is moving toward higher-value mobile storage rather than simply chasing volume. I see that as a positive for the moat because it suggests the controller franchise is still earning design wins in newer sockets.
At the same time, operating cash flow fell to $61.4M in 2025 from $77.1M in 2024 and $149.1M in 2023, so the earnings recovery has not yet translated into stronger cash generation. That is the gap management still has to close.
Recent Events
The most visible recent development is the new Taipei office building, which received its construction license in September 2025 and is expected to be completed by end-2029. I read that as a long-duration capacity and talent investment, not a short-term earnings lever.
The company also continued to emphasize product expansion into MonTitan enterprise SSD controllers and boot-drive solutions for hyperscalers and AI network accelerators. That does not yet look like a full enterprise pivot, but it does show the controller platform is being extended into higher-value sockets rather than staying confined to legacy client storage.
Financial Analysis
Growth
SIMO — Financial Growth (Quarterly, USD Mil)
| Metric | 2025-06-30 | 2025-09-30 | 2025-12-31 | 2026-03-31 | 2026-06-30 |
|---|---|---|---|---|---|
| REVENUE (USD Mil) | 198.7 | 242 | 278.5 | 342.1 | 451 |
| EBIT (USD Mil) | 22.3 | 29.2 | 31.7 | 52.2 | 200.3 |
| EBITDA (USD Mil) | 29.8 | 37.3 | 39.2 | 61.2 | 209.6 |
| NET INCOME (USD Mil) | 16.3 | 39.1 | 47.7 | 66.8 | 136.1 |
| DILUTED EPS | 0.5 | 1.2 | 1.4 | 2 | 4 |
Source: Yahoo Finance — Quarterly Financial Statements
Revenue accelerated sharply across the last four reported quarters, from $198.7M in Q2 2025 to $451M in Q2 2026. That is 127.0% year-over-year growth, and the step-up from $342.1M to $451M suggests the business is still gaining momentum rather than merely lapping an easy comparison.
EBITDA rose from $29.8M to $209.6M over the same period, while diluted EPS increased from 0.5 to 4.0. The growth is strong enough to support the thesis, but the real question is whether it can be sustained without another working-capital tailwind.
Profitability
SIMO — Profitability (TTM)
| Metric | TTM |
|---|---|
| Operating Margin (TTM) | 22.4% |
| Net Margin (TTM) | 22.1% |
| Return on Assets (TTM) | 10.1% |
| Return on Equity (TTM) | 31.6% |
| Gross Margin (TTM) | 48.9% |
| EBITDA Margin (TTM) | 18.9% |
Source: Yahoo Finance — Trailing Twelve Months (TTM)
TTM gross margin was 48.9%, which shows the controller franchise still carries meaningful pricing power. Operating margin was 22.4% and net margin was 22.1%, so the business is already profitable on an operating basis and not just at the gross-profit line.
EBITDA margin was 18.9%, which is below operating margin and tells me the cost structure still needs scrutiny. ROA was 10.1% and ROE was 31.6%, so returns are strong, but the spread also shows leverage is amplifying equity returns rather than the company being purely asset-light.
Valuation
SIMO — Valuation Multiples
| Metric | Value |
|---|---|
| Current Share Price (USD) | 271.7 |
| Market Cap (USD Mil) | 9,214 |
| Enterprise Value (USD Mil) | 9,225 |
| Trailing P/E | 31.8 |
| Forward P/E | 17.1 |
| Price/Sales (TTM) | 7 |
| Price/Book (mrq) | 8.8 |
| EV/Revenue | 7 |
| EV/EBITDA | 37.2 |
| Beta (5Y Monthly) | 1.70 |
| FCF Yield % (TTM) | -2.1% |
| Forward EPS (USD) | 15.9 |
| Analyst Target Price – Low (USD) | 325 |
| Analyst Target Price – Mean (USD) | 369.7 |
| Analyst Target Price – High (USD) | 450 |
| # Analyst Opinions | 10 |
Source: Yahoo Finance
The stock trades at 7.0x price to sales, 7.0x EV/revenue, 31.8x trailing P/E and 17.1x forward P/E. At $271.7 per share, the market is paying for a recovery that is already visible in the income statement, not for cash generation that has already normalized.
That is why the negative cash-flow profile matters. FCF yield was -2.1% and operating cash flow was -$66.6M TTM, so the valuation is not backed by current cash conversion. The 37.2x EV/EBITDA multiple looks demanding in that context, even though the balance sheet itself is not stressed.
Analyst coverage is real, with 10 opinions and a target range of $325 to $450, centered at $370. My own fair-value range is lower, at roughly $240 to $330, because I weight the negative free cash flow and the customer-concentration risk more heavily than the consensus appears to. That range sits below the analyst mean but still overlaps the low end of the published targets, which tells me the market is not wildly mispricing the stock, just leaning more aggressively into the recovery than I am.
On earnings, I would frame fair EPS at roughly $14 to $17, anchored by the current 15.9 forward EPS estimate. That is not a cheap multiple on a cash basis, but it is also not extreme if the company can keep margins near current levels. Relative to peers, the EPS profile is respectable, yet the stock still looks rich on a like-for-like cash-generation basis because the better peer names are already producing positive free cash flow.
Leverage
SIMO — Leverage & Coverage (Quarterly)
| Metric | Value |
|---|---|
| Total Debt/Equity % (mrq) | 6.9 |
| Current Ratio (mrq) | 2.5 |
| Total Debt (mrq, USD Mil) | 72.5 |
| Operating Cash Flow (TTM, USD Mil) | -66.6 |
| Levered Free Cash Flow (TTM, USD Mil) | -196.8 |
| Net Debt/EBITDA (TTM) | 0 |
| FCF Margin % (TTM) | -15.0% |
Source: Yahoo Finance — Quarterly Financial Statements
Total debt was $72.49M and the current ratio was 2.523x, so near-term liquidity is comfortable. Net debt/EBITDA was -0.0x, reflecting a net cash position, and total debt/equity was 6.924%, which is low.
The problem is cash conversion, not leverage. Operating cash flow was -$66.64M TTM and levered free cash flow was -$196.8M TTM, so the company is not funding itself from operations at the moment. That leaves room for execution, but it also means the thesis depends on a real cash inflection rather than just earnings growth.
Insider Activity
The insider record shown here is limited to one open-market sale by Duann Shii Tyng on 2026-05-06 for 1,500 shares at $245.00. I would not overread a single transaction, but the absence of offsetting insider buying does not help the case when free cash flow is still negative.
Comparable Analysis
Growth
| Company | Revenue TTM (USD Mil) | Revenue Growth YoY % | EBITDA TTM (USD Mil) | Diluted EPS TTM |
|---|---|---|---|---|
| SIMO | 1,313.6 | 127.0% | 248 | 8.6 |
| SNDK | 20,248 | 371.6% | 12,617 | 73.8 |
| SWKS | 4,014.1 | -3.1% | 880.2 | 1.9 |
| WDC | 12,919 | 43.8% | 5,002 | 26.9 |
| MXL | 568.9 | 55.2% | -22.4 | -1.2 |
| SYNA | 1,197.2 | 8.9% | 92.8 | -12.6 |
Source: Yahoo Finance
SIMO’s revenue growth of 127.0% TTM is well above SWKS’s -3.1% and SYNA’s 8.9%, but below SNDK’s 371.6% and WDC’s 43.8%. That puts SIMO in the middle of a very wide peer spread, and the market is clearly rewarding the rebound.
Valuation
| Company | Current Share Price (USD) | Trailing P/E | Forward P/E | EV/Revenue | EV/EBITDA | Price/Sales (TTM) | Price/Book (mrq) | Market Cap (USD Mil) | Enterprise Value (USD Mil) | Beta (5Y Monthly) | FCF Yield % (TTM) | Forward EPS | Analyst Target Price – Low | Analyst Target Price – Mean | Analyst Target Price – High | # Analyst Opinions |
|---|---|---|---|---|---|---|---|---|---|---|---|---|---|---|---|---|
| SIMO | 271.7 | 31.8 | 17.1 | 7 | 37.2 | 7 | 8.8 | 9,214 | 9,225 | 1.70 | -2.1% | 15.9 | 325 | 369.7 | 450 | 10 |
| SNDK | 1,792.5 | 24.3 | 6.8 | 12.7 | 20.4 | 13 | 17 | 262,455 | 257,795 | — | 2.9% | 264.7 | 1,000 | 2,125.1 | 3,600 | 23 |
| SWKS | 89.7 | 46.5 | 18.1 | 3.3 | 15 | 3.4 | 2.4 | 13,503 | 13,238 | 1.52 | 3.3% | 5 | 52 | 68.4 | 85 | 17 |
| WDC | 445.3 | 16.5 | 14 | 12.3 | 31.7 | 12.4 | 21.3 | 160,534 | 158,740 | 2.18 | 1.4% | 31.7 | 420 | 664.9 | 1,050 | 24 |
| MXL | 86.7 | — | 33.2 | 13.1 | -331.7 | 13.8 | 16.2 | 7,866 | 7,440 | 3.94 | 0.2% | 2.6 | 40 | 94.5 | 125 | 11 |
| SYNA | 93.4 | — | 14.2 | 3.4 | 43.9 | 3.1 | 3.9 | 3,707 | 4,076 | 1.94 | 4.0% | 6.6 | 105 | 130.3 | 170 | 9 |
Source: Yahoo Finance
SIMO trades at 7.0x EV/revenue and 31.8x trailing P/E, versus SWKS at 3.3x EV/revenue and 46.5x trailing P/E, SYNA at 3.4x EV/revenue and no trailing P/E, WDC at 12.3x EV/revenue and 16.5x trailing P/E, and SNDK at 12.7x EV/revenue and 24.3x trailing P/E. On FCF yield, SIMO is -2.1% versus positive yields for SNDK, SWKS, WDC, MXL and SYNA, which is the more telling comparison because the stock is being priced ahead of its current cash generation.
Using peer EV/revenue of 3.1x to 13.0x on SIMO’s $1.3B revenue implies an illustrative enterprise value of about $4.1B to $17.1B, or roughly $119 to $503 per share after net cash. That range brackets the current price, so the stock is not obviously cheap or obviously stretched on sales alone; the real debate is whether the cash conversion catches up.
Profitability
| Company | Operating Margin (TTM) | Net Margin (TTM) | Return on Assets (TTM) | Return on Equity (TTM) | Gross Margin (TTM) | EBITDA Margin (TTM) |
|---|---|---|---|---|---|---|
| SIMO | 22.4% | 22.1% | 10.1% | 31.6% | 48.9% | 18.9% |
| SNDK | 78.5% | 56.5% | 43.9% | 91.6% | 71.5% | 62.3% |
| SWKS | 8.8% | 7.2% | 3.4% | 5.1% | 40.7% | 21.9% |
| WDC | 43.6% | 72.9% | 20.8% | 130.9% | 48.9% | 38.7% |
| MXL | -2.4% | -18.2% | -4.9% | -21.3% | 57.5% | -3.9% |
| SYNA | -2.8% | -41.0% | -1.5% | -42.2% | 44.7% | 7.8% |
Source: Yahoo Finance
SIMO’s gross margin of 48.9% and EBITDA margin of 18.9% sit below SNDK’s 71.5% and 62.3%, but above SWKS’s 40.7% and 21.9% and SYNA’s 44.7% and 7.8%. Operating margin of 22.4% is solid, and it compares favorably with SWKS’s 8.8% and SYNA’s -2.8%, which tells me the controller model is still producing decent operating leverage.
Leverage
| Company | Total Debt/Equity % (mrq) | Current Ratio (mrq) | Total Debt (mrq, USD Mil) | Operating Cash Flow TTM (USD Mil) | Free Cash Flow TTM (USD Mil) | Net Debt/EBITDA (TTM) | FCF Margin % (TTM) |
|---|---|---|---|---|---|---|---|
| SIMO | 6.9 | 2.5 | 72.5 | -66.6 | -196.8 | 0 | -15.0% |
| SNDK | 1.3 | 2.3 | 201 | 11,671 | 7,720.9 | -0.4 | 38.1% |
| SWKS | 11.9 | 3.1 | 681.1 | 716.2 | 448.8 | -0.1 | 11.2% |
| WDC | 13.4 | 1.3 | 1,191 | 3,929 | 2,268.8 | -0.1 | 17.6% |
| MXL | 30.6 | 1.8 | 148.2 | 16.5 | 14.4 | -3.7 | 2.5% |
| SYNA | 94.3 | 1.1 | 876.8 | 149.4 | 149.7 | 4.7 | 12.5% |
Source: Yahoo Finance
SIMO’s total debt/equity of 6.924% and current ratio of 2.523x are cleaner than SYNA’s 94.3% debt/equity and 1.1x current ratio, and better than MXL’s 30.6% and 1.8x. The catch is free cash flow: SIMO’s -15.0% FCF margin trails the positive margins at SWKS, WDC, SYNA and SNDK, so the balance sheet is not the problem, but the business is not yet funding itself the way the stronger peers are.
Conclusion
The tension in this name is simple: the operating rebound is real, but the cash conversion still is not. Revenue reached $451M in Q2 2026 and EPS rose to 4.0, which tells me the franchise is recovering; however, TTM levered free cash flow remained -$196.9M and FCF yield was -2.1%, so the market is still paying for a recovery that has not yet shown up in cash.
I would move toward Buy if free cash flow turns positive and stays there for two consecutive quarters, because that would tell me the earnings rebound is self-funding rather than dependent on working-capital release. I would also want to see revenue hold above $342.1M a quarter, roughly the Q1 2026 level, because a drop back below that would suggest the Q2 spike was cyclical rather than durable. On the downside, if operating cash flow stays negative while the company keeps returning cash through dividends and buybacks, I would become more cautious because the current capital-return policy would be running ahead of underlying cash creation.
My final view is Sell. The growth and margin recovery are strong enough to keep the bull case alive, but the valuation already assumes more cash discipline than the company has shown so far. I want to see positive free cash flow before I am willing to pay this multiple.
What to Watch Next
- Free cash flow turns positive for two straight quarters — would support moving toward Buy.
- Revenue holds above $342.1M per quarter — would argue the Q2 spike is durable.
- FCF margin turns positive — would show earnings are converting into cash.
- EBITDA margin moves closer to operating margin — would confirm operating leverage is improving.
- Customer concentration eases from 66.0% at the top five customers — would reduce single-account risk.
What’s your take? I rated Silicon Motion (SIMO) SELL above — but the goal here is to get this right, not just to publish an opinion. What would you add to this analysis, or which risk or catalyst do you think I’m under- or over-weighting? Tell me in the comments.
Sources
Data sourced from Yahoo Finance and SEC EDGAR. Not investment advice.
Leave a Comment