| Company | Sep 25 | Oct 25 | Nov 25 | Dec 25 | Jan 26 | Feb 26 | Mar 26 | Apr 26 | May 26 | Jun 26 | Jul 26 | Aug 26 | 12-Mo |
|---|---|---|---|---|---|---|---|---|---|---|---|---|---|
| INTC | +38% | +19% | +1% | -9% | +26% | -2% | -3% | +114% | +21% | +22% | -35% | -1% | +268% |
| HPQ | -4% | +2% | -12% | -8% | -13% | -2% | +3% | +9% | +30% | -18% | +24% | +10% | +11% |
| DELL | +16% | +15% | -18% | -6% | -9% | +29% | +11% | +28% | +101% | +3% | -6% | +12% | +278% |
| XIACY | +2% | -20% | -4% | -5% | -10% | -2% | -6% | -9% | -5% | -22% | +32% | -5% | -49% |
| HPE | +9% | -1% | -10% | +10% | -10% | -0% | +12% | +21% | +50% | +5% | +6% | +9% | +136% |
| LNVGY | +4% | -2% | -15% | -5% | -5% | +10% | -3% | +26% | +104% | -4% | +3% | +27% | +171% |
Source: Yahoo Finance monthly adjusted close.
Quick Thesis
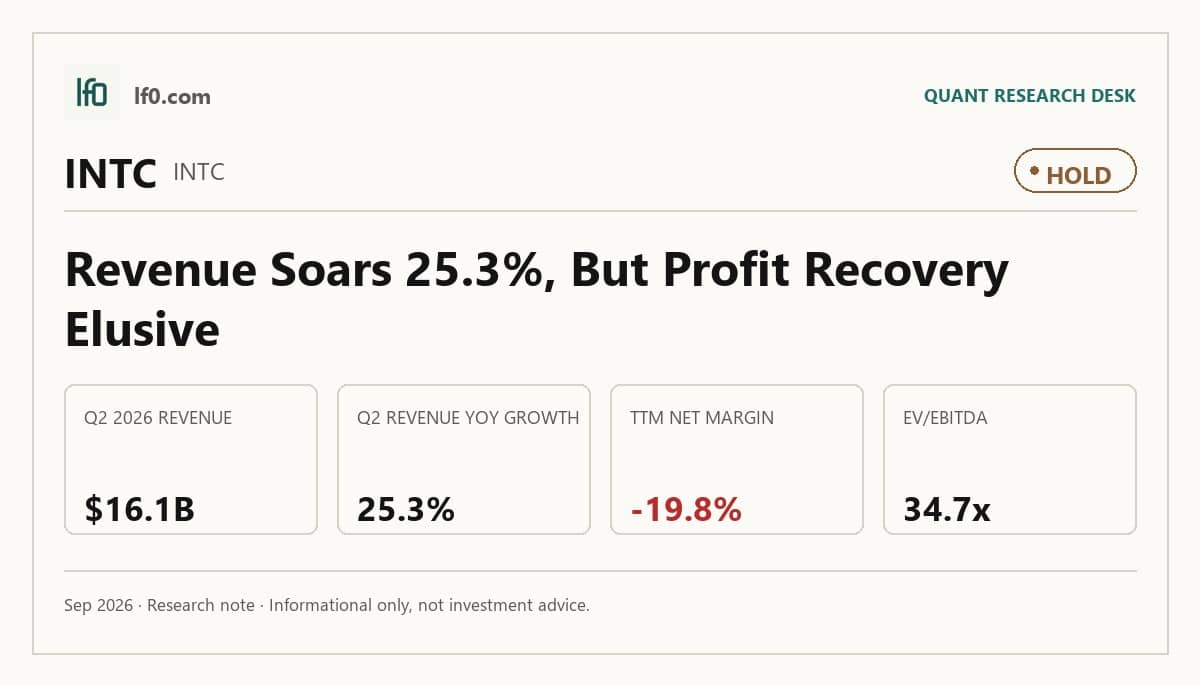
- Rated hold — revenue is recovering, but earnings quality is still too weak.
- Strongest support: $14.9B TTM operating cash flow and $4.9B levered free cash flow.
- Main risk: -19.8% TTM net margin and $50.5B of debt.
- Valuation is rich at 10.2x EV/revenue and 34.7x EV/EBITDA.
- I would turn more constructive if net margin turns positive and holds for two quarters.
Executive Summary
Rating: HOLD | INTC
We’ll begin tracking this call’s performance since publication once sufficient adjusted-close data is available.
I would put my rating as a hold because Intel’s revenue recovery is real, but the earnings base is still too unstable to justify the stock’s 10.2x EV/revenue and 52.7x forward P/E. Q2 2026 revenue of $16.1B was up 25.3% year over year, yet TTM net margin was still -19.8% and TTM free cash flow margin was only 8.5%, so the business is improving at the top line without yet proving that the improvement is durable enough for a higher rating. I would raise my rating more towards a buy if Intel can hold revenue above $16B for two more quarters and keep operating margin above 12.0%, because that would show the current run rate is not just a one-quarter spike and that the cost base is finally scaling with sales.
Company Profile
Intel designs and manufactures semiconductors for PCs, data centers, and foundry customers, with a business model that depends on high capital intensity and long production cycles. The company’s revenue base is large enough to matter, but the more important question is whether its manufacturing footprint can support better utilization and returns over time. That is why the current debate is less about demand alone and more about whether Intel can turn scale into consistent earnings and cash generation.
Economic Moat
Business Model
Intel’s moat still rests on manufacturing scale, process control, and the ability to keep strategic nodes in-house rather than relying on third parties. The April 8, 2026 repurchase of Apollo’s 49% interest in Fab 34, Intel’s Ireland manufacturing joint venture, for $14.2B gave Intel full ownership of a key asset, which should improve control over capacity planning and product timing. I view that as a real structural advantage only if the asset can be run at higher utilization, because ownership alone does not create returns.
Business & Operating Risks
The main disclosed risks are execution risk, capital intensity, and the possibility that heavy investment does not translate into durable profitability. The Fab 34 buyout and the related financing increase the pressure on Intel to convert manufacturing control into better margins and cash flow, because the company is now carrying more financial weight while it tries to prove the strategy. In my view, those risks do threaten the moat directly: if Intel cannot earn an adequate return on Fab 34, the advantage of owning the node outright becomes a costly burden rather than a source of strength.
Management Discussion & Analysis
Management is responding to those risks by tightening control of the asset base and extending the debt maturity profile. Intel issued $6.5B of senior notes across maturities from 2031 to 2066, which helps refinance the bridge financing tied to Fab 34 and reduces near-term liquidity pressure, but it also confirms that the buyout was funded with leverage rather than excess cash. I read that as a deliberate tradeoff: management is prioritizing strategic control now and asking the income statement to justify the balance-sheet cost later.
Recent Events
The April 24, 2026 accounting-officer change was small in absolute terms, but it fits the broader pattern of a company under active financial management. Scott Gawel resigned and David Zinsner became principal accounting officer, while the May 13 annual meeting saw all 11 directors elected and shareholder proposals on China exposure, human rights due diligence, and separating the chair and CEO roles fail. Those events do not change the moat by themselves, but they do show a board and management team that remain firmly in control as Intel works through a more levered phase.
Financial Analysis
Growth
INTC — Financial Growth (Quarterly, USD Mil)
| Metric | 2025-06-30 | 2025-09-30 | 2025-12-31 | 2026-03-31 | 2026-06-30 |
|---|---|---|---|---|---|
| REVENUE (USD Mil) | 12,859 | 13,653 | 13,674 | 13,577 | 16,128 |
| EBIT (USD Mil) | -2,542 | 4,856 | 621 | -3,682 | -10,498 |
| EBITDA (USD Mil) | 471 | 7,848 | 3,648 | -546 | -7,274 |
| NET INCOME (USD Mil) | -2,918 | 4,063 | -591 | -3,728 | -11,033 |
| DILUTED EPS | -0.7 | 0.9 | -0.1 | -0.7 | -2.2 |
Source: Yahoo Finance — Quarterly Financial Statements
Revenue rose from $12.9B in Q2 2025 to $16.1B in Q2 2026, a 25.3% increase year over year, but the path was uneven because Q1 2026 was still slightly below the prior year. That matters because it tells me the rebound is real but not yet smooth enough to call durable growth. EBITDA was far more volatile than revenue, swinging from $471M in Q2 2025 to $7.8B in Q3 2025 and then to -$7.3B in Q2 2026, so the operating model is still unstable. The revenue improvement is encouraging, but the earnings volatility says the business has not yet reached the kind of operating consistency that would justify a premium multiple on its own.
Profitability
INTC — Profitability (TTM)
| Metric | TTM |
|---|---|
| Operating Margin (TTM) | 12.2% |
| Net Margin (TTM) | -19.8% |
| Return on Assets (TTM) | 1.4% |
| Return on Equity (TTM) | -10.7% |
| Gross Margin (TTM) | 38.9% |
| EBITDA Margin (TTM) | 29.5% |
Source: Yahoo Finance — Trailing Twelve Months (TTM)
TTM gross margin was 38.9% and TTM EBITDA margin was 29.5%, which shows Intel still has meaningful product-level economics even after heavy operating costs. The problem is what happens below that line: TTM operating margin was 12.2%, but TTM net margin was -19.8%, so financing, restructuring, and other below-the-line items are still overwhelming the operating result. Return on assets was 1.4% and return on equity was -10.7%, which tells me the company is not yet turning its asset base into attractive equity returns. The key threshold I am watching is net margin turning positive and staying there, because that would show the recovery is reaching the bottom line rather than stopping at operating profit.
Valuation
INTC — Valuation Multiples
| Metric | Value |
|---|---|
| Current Share Price (USD) | 108.6 |
| Market Cap (USD Mil) | 574,071 |
| Enterprise Value (USD Mil) | 584,189 |
| Forward P/E | 52.7 |
| Price/Sales (TTM) | 10.1 |
| Price/Book (mrq) | 6.3 |
| EV/Revenue | 10.2 |
| EV/EBITDA | 34.7 |
| FCF Yield % (TTM) | 0.9% |
| Forward EPS (USD) | 2.1 |
| Analyst Target Price – Low (USD) | 75 |
| Analyst Target Price – Mean (USD) | 116.4 |
| Analyst Target Price – High (USD) | 200 |
| # Analyst Opinions | 43 |
Source: Yahoo Finance
Intel trades at 10.2x EV/revenue and 34.7x EV/EBITDA, which is a demanding valuation for a company with a -19.8% TTM net margin and only 0.9% FCF yield. Forward P/E is 52.7x on forward EPS of $2.06, so the market is clearly paying for a much cleaner earnings path than the current numbers show. Price/book is 6.26x, market cap is $574.1B, and enterprise value is $584.2B, which leaves little room for disappointment if the recovery stalls.
On the analysis here, I would put fair value in a broad range of roughly $75–$116, with the upper end aligned to the current analyst mean target of $116.4 and the lower end closer to the analyst low of $75. With 43 analyst opinions, there is a real consensus to compare against, and my range sits mostly below the mean because I weight the weak net margin and thin FCF yield more heavily than the consensus appears to. I also think the implied earnings path is rich relative to peers: Intel’s forward EPS of $2.06 is below DELL’s $29.1 and HPE’s $4.6, yet Intel trades at a much higher EV/revenue multiple than either. That gap tells me the market is already paying for a recovery that still needs to show up in cash and earnings.
Leverage
INTC — Leverage & Coverage (Quarterly)
| Metric | Value |
|---|---|
| Total Debt/Equity % (mrq) | 49 |
| Current Ratio (mrq) | 1.6 |
| Total Debt (mrq, USD Mil) | 50,537 |
| Operating Cash Flow (TTM, USD Mil) | 14,936 |
| Levered Free Cash Flow (TTM, USD Mil) | 4,866.4 |
| Net Debt/EBITDA (TTM) | 1.2 |
| FCF Margin % (TTM) | 8.5% |
Source: Yahoo Finance — Quarterly Financial Statements
Intel’s leverage is manageable, not a balance-sheet strength. Total debt was $50.5B, current ratio was 1.6, and net debt/EBITDA was 1.2x, so the company has enough liquidity to operate but not enough excess cushion to ignore execution risk. Operating cash flow was $14.9B TTM and levered free cash flow was $4.9B TTM, which means the business is generating cash, but not at a level that makes the debt load feel trivial. I would view the balance sheet as a support, not a moat: it can absorb the Fab 34 financing, but only if cash generation keeps improving.
Insider Activity
The insider transaction record I see is net selling, with two open-market sales in the visible table and no offsetting purchase. Chandrasekaran Nagasubramaniyan sold 21,024 shares at $118.28, and Miller Boise April sold 40,256 shares at $99.53. That does not tell me the thesis is broken, but it does tell me management is not signaling conviction through buying at these levels.
Comparable Analysis
Growth
| Company | Revenue TTM (USD Mil) | Revenue Growth YoY % | Diluted EPS TTM |
|---|---|---|---|
| INTC | 57,032 | 25.4% | -2.1 |
| HPQ | 59,162 | 12.5% | 2.6 |
| DELL | 151,197 | 57.7% | 17.2 |
| XIACY | 438,100.5 | -6.1% | 0.9 |
| HPE | 41,871 | 33.7% | 1.9 |
| LNVGY | 91,187.4 | 43.1% | 2.8 |
Source: Yahoo Finance
Intel’s revenue growth of 25.4% TTM sits above HPQ’s 12.5% and HPE’s 33.7% is stronger, while DELL’s 57.7% remains the fastest among the group. The catch is that Intel’s diluted EPS is still -2.1 TTM versus HPQ’s 2.6, DELL’s 17.2, HPE’s 1.9, and LNVGY’s 2.8, so the top-line rebound has not yet translated into earnings power.
Valuation
| Company | Current Share Price (USD) | Trailing P/E | Forward P/E | EV/Revenue | EV/EBITDA | Price/Sales (TTM) | Price/Book (mrq) | Market Cap (USD Mil) | Enterprise Value (USD Mil) | Beta (5Y Monthly) | FCF Yield % (TTM) | Forward EPS | Analyst Target Price – Low | Analyst Target Price – Mean | Analyst Target Price – High | # Analyst Opinions |
|---|---|---|---|---|---|---|---|---|---|---|---|---|---|---|---|---|
| INTC | 108.6 | — | 52.7 | 10.2 | 34.7 | 10.1 | 6.3 | 574,071 | 584,189 | 2.23 | 0.9% | 2.1 | 75 | 116.4 | 200 | 43 |
| HPQ | 34.4 | 13.1 | 11 | 0.6 | 8 | 0.5 | -337.3 | 31,022 | 37,192 | 1.21 | 10.9% | 3.1 | 19 | 29.7 | 72 | 17 |
| DELL | 568.1 | 33 | 19.5 | 2.5 | 21.7 | 2.4 | -256.8 | 361,180 | 384,894 | 1.41 | 1.7% | 29.1 | 480 | 576.9 | 735 | 25 |
| XIACY | 16.7 | 18.4 | 16.3 | 0 | 0.1 | 0.2 | 2.1 | 85,973 | 3,642 | 0.72 | -9.5% | 1 | 30.2 | 30.2 | 30.2 | 1 |
| HPE | 60.8 | 31.3 | 13.2 | 2.3 | 13.8 | 1.9 | 3 | 80,657 | 94,824 | 1.44 | 5.9% | 4.6 | 52 | 67.4 | 88 | 20 |
| LNVGY | 95.8 | 34.4 | 11.1 | 0.7 | 15.7 | 0.7 | 8.9 | 59,614 | 61,481 | 1.13 | -5.6% | 8.6 | 117.7 | 117.7 | 117.7 | 1 |
Source: Yahoo Finance
Intel’s 0.9% FCF yield TTM is far below HPQ’s 10.9%, HPE’s 5.9%, and DELL’s 1.7%, while its 10.2x EV/revenue and 52.7x forward P/E are much richer than HPQ’s 0.6x and 11.0x, HPE’s 2.3x and 13.2x, and DELL’s 2.5x and 19.5x. Using the peer EV/revenue range of 0.0x to 2.5x on Intel’s $57B TTM revenue gives an illustrative enterprise value range of about $0.6B to $145B, or roughly $5.8 to $27.0 per share after netting $10.1B of net debt and dividing by 5.3B shares. I think the market is already giving Intel credit for a recovery that still needs to show up in earnings, especially with forward EPS at $2.06 versus DELL’s $29.1 and HPE’s $4.6.
Profitability
| Company | Operating Margin (TTM) | Net Margin (TTM) | Return on Assets (TTM) | Return on Equity (TTM) | Gross Margin (TTM) | EBITDA Margin (TTM) |
|---|---|---|---|---|---|---|
| INTC | 12.2% | -19.8% | 1.4% | -10.7% | 38.9% | 29.5% |
| HPQ | 5.4% | 4.1% | 5.6% | — | 19.7% | 7.8% |
| DELL | 12.0% | 7.5% | 8.6% | — | 19.9% | 11.7% |
| XIACY | 4.0% | 7.5% | 2.6% | 12.6% | 21.4% | 6.5% |
| HPE | 12.6% | 6.7% | 2.6% | 10.9% | 36.6% | 16.5% |
| LNVGY | 0.1% | 0.9% | 3.0% | 14.7% | 15.9% | 4.3% |
Source: Yahoo Finance
Intel’s 38.9% gross margin and 29.5% EBITDA margin are well above HPQ’s 19.7% and 7.8%, HPE’s 36.6% and 16.5%, and DELL’s 19.9% and 11.7%, but its 12.2% operating margin is only modestly ahead of DELL’s 12.0% and HPE’s 12.6% because operating costs still absorb a large share of gross profit. The wider gap between gross margin and operating margin points to a scale and spending issue rather than a pure cost-of-revenue problem, so the business is improving at the chip level but has not yet converted that into peer-leading operating leverage.
Leverage
| Company | Total Debt/Equity % (mrq) | Current Ratio (mrq) | Total Debt (mrq, USD Mil) | Operating Cash Flow TTM (USD Mil) | Free Cash Flow TTM (USD Mil) | Net Debt/EBITDA (TTM) | FCF Margin % (TTM) |
|---|---|---|---|---|---|---|---|
| INTC | 49 | 1.6 | 50,537 | 14,936 | 4,866.4 | 1.2 | 8.5% |
| HPQ | — | 0.8 | 10,339 | 4,668 | 3,389.9 | 1.3 | 5.7% |
| DELL | — | 1 | 35,284 | 12,152 | 6,033.4 | 1.3 | 4.0% |
| XIACY | 14.6 | 1.5 | 39,276.8 | 8,137.9 | -8,155 | -2.9 | -1.9% |
| HPE | 76.5 | 1.1 | 20,321 | 6,694 | 4,738.6 | 2 | 11.3% |
| LNVGY | 81.6 | 1 | 6,666.2 | 3,186.9 | -3,329.4 | 0.1 | -3.6% |
Source: Yahoo Finance
Intel’s 49.0% debt/equity and 1.2x net debt/EBITDA are more conservative than HPE’s 76.5% and 2.0x, and close to HPQ’s 1.3x and DELL’s 1.3x, while its 8.5% FCF margin is above DELL’s 4.0% but below HPQ’s 5.7% and HPE’s 11.3%. That mix says the balance sheet is not the problem here; the issue is that Intel is still converting only a small slice of revenue into free cash flow, so leverage is manageable but not yet a source of valuation support.
Conclusion
I would put my rating as a hold because Intel’s strategic control over Fab 34 is improving, but the financial payoff has not yet caught up with the leverage and valuation the company is carrying. The April 2026 buyout and the debt refinancing strengthen the manufacturing footprint, yet Q2 2026 revenue of $16.1B still sits alongside a -19.8% TTM net margin and only 0.9% FCF yield, which tells me the market is paying for a cleaner earnings recovery than the current numbers justify.
I would raise my rating more towards a buy if Intel can hold revenue above $16B for two more quarters and keep operating margin above 12.0%, because that would show the current run rate is not just a one-quarter spike and that the cost base is finally scaling with sales. If TTM levered free cash flow moves above $6B, meaning cash generation is clearly expanding beyond the current $4.9B level, that would make the valuation easier to defend and would tell me the Fab 34 investment is starting to earn its keep.
I would move from hold to sell if revenue slips back below $14B in a quarter or if net margin stays negative after the Fab 34 buyout and debt refinancing, because that would mean the recent sales rebound was not translating into lasting profit power. A second warning sign would be net debt/EBITDA moving back above 1.5x, which would show the balance sheet is absorbing capital spending without a matching lift in cash flow.
Weighing both sides, I think the bear case is still a little more likely to show up first because the stock already prices in a clean earnings recovery that has not yet appeared in the TTM numbers. The strategic upside from Fab 34 is real, but until Intel proves that higher revenue can coexist with positive net margin and stronger free cash flow, I would stay on the sidelines rather than chase the rerating.
What to Watch Next
- Revenue above $16B for two more quarters — would support a move toward buy.
- Operating margin above 12.0% — would show the cost base is scaling with sales.
- TTM levered free cash flow above $6B — would strengthen the valuation case.
- Net margin turning positive and staying there — would confirm earnings quality is improving.
- Net debt/EBITDA above 1.5x — would raise balance-sheet risk and argue for caution.
What’s your take? I rated Intel (INTC) HOLD above — but the goal here is to get this right, not just to publish an opinion. What would you add to this analysis, or which risk or catalyst do you think I’m under- or over-weighting? Tell me in the comments.
Sources
- SEC 8-K Filing (2026-05-15)
- SEC 8-K Filing (2026-04-30)
- SEC 8-K Filing (2026-04-24)
- SEC 8-K Filing (2026-04-23)
- SEC 8-K Filing (2026-04-08)
- SEC 8-K Filing (2026-04-03)
- SEC Form 4 Insider Transaction (2026-06-02)
- SEC Form 4 Insider Transaction (2026-06-02)
- SEC Form 4 Insider Transaction (2026-06-02)
Data sourced from Yahoo Finance and SEC EDGAR. Not investment advice.
Leave a Comment