
| Company | Sep 25 | Oct 25 | Nov 25 | Dec 25 | Jan 26 | Feb 26 | Mar 26 | Apr 26 | May 26 | Jun 26 | Jul 26 | Aug 26 | 12-Mo |
|---|---|---|---|---|---|---|---|---|---|---|---|---|---|
| GLW | +22% | +9% | -5% | +4% | +18% | +46% | -10% | +21% | +10% | +41% | -46% | +8% | +124% |
| APH | +14% | +13% | +1% | -4% | +7% | +1% | -13% | +17% | +1% | +19% | -9% | -1% | +47% |
| COHR | +19% | +23% | +24% | +12% | +15% | +22% | -8% | +34% | +13% | +9% | -33% | +6% | +207% |
| KLAC | +24% | +12% | -3% | +3% | +18% | +7% | -3% | +19% | +10% | +57% | -39% | -4% | +102% |
| ENTG | +10% | -1% | -16% | +9% | +40% | +12% | -11% | +21% | -2% | +30% | -34% | +14% | +62% |
| LITE | +23% | +24% | +61% | +13% | +6% | +79% | +0% | +28% | -5% | +0% | -17% | +28% | +589% |
Source: Yahoo Finance monthly adjusted close.
Quick Thesis
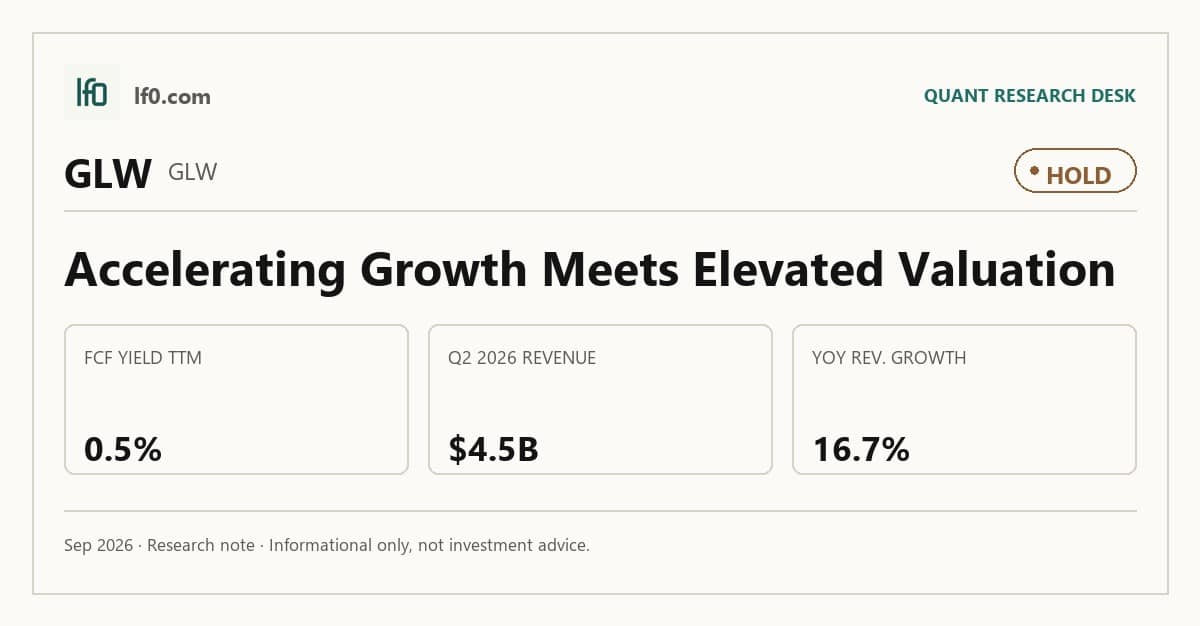
- Rated hold because valuation already discounts a cleaner cash-conversion profile than Corning is delivering.
- Strongest support: $734.5M of TTM levered free cash flow.
- Main risk: 0.5% TTM FCF yield on a 143.3B market value.
- Valuation looks rich versus peers at 36.9x EV/EBITDA.
- I would turn more constructive if FCF margin moves above 5.0%, meaning cash conversion is catching up with sales growth.
Executive Summary
Rating: HOLD | GLW
Measured from adjusted close on n/a to 2026-09-11. Sell ratings are correct when the stock falls; Hold is tracked as a +/-10% range. Daily-close data, not intraday. Calls are tracked for 182 days from publication, then frozen as a final record.
I would put my rating as a hold because Corning’s 16.7% year-over-year revenue growth in Q2 2026 is real, but the stock already prices in a much cleaner earnings conversion than the business delivers. The strongest support is $734.5M of TTM levered free cash flow, which shows the company still funds growth and returns without balance-sheet strain. The main risk is that FCF yield, at 0.5% TTM, is thin for a 143.3B market value, so any slip in Springboard execution or AI-related demand could compress the multiple quickly. I would turn more constructive if Corning’s FCF margin moves above 5.0%, meaning cash conversion is finally catching up with sales growth.
Company Profile
Corning Incorporated traces its origins to a glass business founded in 1851 and was incorporated in New York in December 1936; it changed its name from Corning Glass Works to Corning Incorporated in April 1989. It designs and manufactures materials and components across Optical Communications, Display, Specialty Materials, Automotive, and Life Sciences. Optical Communications sells optical fiber, cable, connectivity hardware, and integrated network solutions for carrier and data center networks, while Display supplies glass substrates for LCD and OLED panels. Specialty Materials sells Gorilla Glass and semiconductor optics, Automotive sells ceramic substrates, filters, and technical glass, and Life Sciences sells labware and consumables under Corning, Falcon, PYREX, and Axygen brands. Corning manufactures in 14 countries, employs 67,200 people in 44 countries, and trades on the New York Stock Exchange under GLW.
Economic Moat
Business Model
The fusion manufacturing process for large display glass is the most defensible part of the franchise because Corning invented it and still describes it as the cornerstone of its display-glass leadership. In my view, that process is hard to replicate quickly because it depends on process know-how, equipment tuning, and long learning curves rather than a single product launch. Optical Communications is the clearest secondary moat: Corning invented the world’s first low-loss optical fiber in 1970 and now pairs that legacy with a broad fiber, cable, connector, and preconnectorized platform portfolio for carrier networks and hyperscale data centers. Patent depth also helps, with about 11,375 unexpired patents worldwide at the end of 2025 and about 740 expiring between 2026 and 2028.
The business has shifted materially over five years. In 2022, Corning operated in five segments that included Display Technologies and Environmental Technologies, and it manufactured products at 119 plants in 15 countries; today the footprint spans 14 countries and the mix is more focused on display, optical, specialty materials, automotive, and life sciences. The 2025 pivot that matters most was the combination of Automotive Glass Solutions with Environmental Technologies into the Automotive segment, which broadened the auto franchise from emissions control into technical glass and optics. I also think the 2026 emphasis on AI and data centers is strategically important because Contour Flow Cable and Edge8 are positioned around fiber density and speed, which gives the optical franchise a more durable growth vector than legacy display alone.
Business & Operating Risks
Inflation, logistics, and supply-chain disruption are the most immediate threats because Corning’s manufacturing base depends on timely access to raw materials, utilities, equipment, and transport. The current 10-K warns that rising demand for key materials could disrupt Corning’s or suppliers’ ability to obtain them in time, and that shipment delays can come from transportation interruptions, labor strife, or capacity constraints. If input inflation forces price increases, customers may push out, cancel, or avoid purchases, so the risk is not just margin pressure but also volume loss. Single-supplier exposure and long lead times make the earnings hit larger than a normal commodity-cost swing because a shortage can interrupt output rather than simply raise cost.
Optical Communications and Display are the next major risk because the filing says they generate a significant amount of profits and cash flow, while both are exposed to pricing pressure, competition, and fluctuations in telecom and hyperscale data-center capital spending. That concentration matters because only 2 combined Optical Communications customers accounted for 28.0% of 2025 segment net sales and 3 Display customers accounted for 59.0%, so a single customer deferral can move results quickly. The new solar entry adds policy risk as well, since Corning is dependent on government manufacturing tax incentives and exposed to regulatory change before the business has scale. Taken together, these risks do not break the moat, but they do test whether Corning can keep its display and optical advantages from being diluted by concentration and policy exposure.
Management Discussion & Analysis
Management is signaling a heavier capital-deployment cycle, not a pause, and it is responding to the disclosed risks by leaning into scale and mix rather than retreating. Capital expenditures were $1.3B in 2025 and are expected to rise to about $1.7B in 2026, while the company kept a $1.5B revolving credit facility in place through July 28, 2030 and still had about $3B available under the 2019 share repurchase authorization as of December 31, 2025. That combination says Corning is willing to fund growth, return cash, and preserve liquidity at the same time, which is constructive only if the new spending earns returns above the cost of capital.
Springboard is the clearest forward signal. Management says it has already achieved both the $4B incremental annualized core sales target and the 20% core operating margin target a full year ahead of plan, and it is now guiding first-quarter 2026 core net sales of about $4.2B to $4.3B. I view that as evidence that the operating model is working, but the higher capex plan means investors should watch whether the next leg of spending converts into cash rather than just a larger asset base. Trade receivables rose to $2.8B from $2.1B and inventories to $3.1B from $2.7B, so growth is absorbing more working capital even as management emphasizes liquidity.
Management’s track record is better than its tone in earlier years would have suggested. In 2024, prior filings said the company was taking action to restore productivity ratios and raise price, and 2025 gross margin did improve to 36.4% from 33.0% in 2024, so that claim was confirmed by the numbers rather than left as a slogan. In 2023, management framed the goal as 6% to 8% core sales CAGR under the Strategy & Growth Framework, but the 2026 filing shows a much more aggressive Springboard target and says the company reached both growth and profitability milestones ahead of plan. I do not see a CEO or CFO change in the current filing or the prior-year context provided, so there is no obvious leadership-transition issue to flag.
Recent Events
The most important recent development is the May 6, 2026 partnership with NVIDIA, where Corning issued warrants for up to 18 million shares in exchange for a $500M strategic investment tied to AI infrastructure manufacturing. In my view, that strengthens the thesis because it gives Corning a direct role in the AI buildout rather than just selling components into it, and the $180.00 strike on the traditional warrant signals NVIDIA is paying for long-dated optionality on Corning’s manufacturing base.
The April 28, 2026 8-K also matters because Corning reorganized reporting into four segments, combining Display and Specialty Materials into Glass Innovations and grouping Hemlock, solar wafers, and solar modules into Solar. I read that as a cleaner way to show where the business is actually being managed, which should make the AI, optical, and solar exposure easier to underwrite. It does not change GAAP results, but it sharpens the strategic map.
The April 30, 2026 shareholder vote was routine in substance, with the board re-elected, pay approved, and PwC ratified, while the independent chair proposal failed. The signal there is continuity at the top, so the recent 8-Ks are net positive for the investment case because they pair a strategic AI partnership with a clearer segment structure and no governance disruption.
Financial Analysis
Growth
GLW — Financial Growth (Quarterly, USD Mil)
| Metric | 2025-06-30 | 2025-09-30 | 2025-12-31 | 2026-03-31 | 2026-06-30 |
|---|---|---|---|---|---|
| REVENUE (USD Mil) | 3,862 | 4,100 | 4,215 | 4,144 | 4,505 |
| EBIT (USD Mil) | 667 | 628 | 771 | 621 | 743 |
| EBITDA (USD Mil) | 1,007 | 965 | 1,122 | 978 | 1,134 |
| NET INCOME (USD Mil) | 469 | 430 | 540 | 371 | 559 |
| DILUTED EPS | 0.5 | 0.5 | 0.6 | 0.4 | 0.6 |
Source: Yahoo Finance — Quarterly Financial Statements
Revenue rose from $3.9B in Q2 2025 to $4.5B in Q2 2026, up 16.7% year over year, after moving through a softer Q1 2026 and then rebounding. EBITDA grew faster than revenue in Q2 2026, reaching $1.1B versus $1B a year earlier, while net income climbed to $559M from $469M in Q2 2025. That pattern matters because it shows the Springboard mix shift is starting to work, not just the top line, and it is consistent with the company’s push toward higher-value optical and AI-linked demand.
Profitability
GLW — Profitability (TTM)
| Metric | TTM |
|---|---|
| Operating Margin (TTM) | 15.6% |
| Net Margin (TTM) | 11.2% |
| Return on Assets (TTM) | 5.4% |
| Return on Equity (TTM) | 16.8% |
| Gross Margin (TTM) | 36.4% |
| EBITDA Margin (TTM) | 24.1% |
Source: Yahoo Finance — Trailing Twelve Months (TTM)
TTM operating margin was 15.6%, net margin was 11.2%, gross margin was 36.4%, and EBITDA margin was 24.1%. The 20.8-point gap between gross and operating margin shows Corning still carries a heavy opex and manufacturing overhead load, so I weight operating margin more than gross margin when judging scale. Return on assets was 5.37% and return on equity was 16.8%, which tells me leverage is amplifying equity returns rather than pure asset efficiency. The key watchpoint is whether operating margin can hold near 16.0% and keep moving toward the 20.0% core target, because that would confirm the profitability base is still expanding.
Valuation
GLW — Valuation Multiples
| Metric | Value |
|---|---|
| Market Cap (USD Mil) | 143,335 |
| Enterprise Value (USD Mil) | 150,777 |
| Trailing P/E | 75.3 |
| Forward P/E | 38.3 |
| Price/Sales (TTM) | 8.4 |
| Price/Book (mrq) | 12 |
| EV/Revenue | 8.9 |
| EV/EBITDA | 36.9 |
| Beta (5Y Monthly) | 1.15 |
| FCF Yield % (TTM) | 0.5% |
| Forward EPS (USD) | 4.3 |
| Analyst Target Price – Low (USD) | 129 |
| Analyst Target Price – Mean (USD) | 194.3 |
| Analyst Target Price – High (USD) | 238 |
| # Analyst Opinions | 16 |
Source: Yahoo Finance
Corning trades at 8.89x EV/revenue and 36.9x EV/EBITDA, with a 75.3x trailing P/E and 38.3x forward P/E. The market is pricing in a durable step-up in core profitability, because a 36.9x EV/EBITDA multiple only works if Springboard keeps delivering margin expansion and higher sales well beyond the current run rate. FCF yield is 0.5% TTM, which is very thin for a 143.3B equity value, so the shares are not cheap on cash generation either.
Using the peer EV/revenue range of 7.4x to 27.2x on GLW’s $17B TTM revenue gives an implied enterprise value of $125.8B to $462.4B. On my read, that translates to a very wide fair-value band, and the spread itself tells you the stock is highly sensitive to which peer anchor you trust. The analyst set is meaningful at 16 opinions, with a target range of $129.0 to $238.0 and a mean of $194.3, so my range sits inside consensus but below the mean because I weight cash conversion and leverage more heavily than the market appears to. Forward EPS of 4.35 is below KLAC and COHR but above APH and ENTG, which means investors are paying a premium for a mid-pack earnings profile rather than for clear EPS leadership.
Leverage
GLW — Leverage & Coverage (Quarterly)
| Metric | Value |
|---|---|
| Total Debt/Equity % (mrq) | 71.4 |
| Current Ratio (mrq) | 1.8 |
| Total Debt (mrq, USD Mil) | 9,379 |
| Operating Cash Flow (TTM, USD Mil) | 3,915 |
| Levered Free Cash Flow (TTM, USD Mil) | 734.5 |
| Net Debt/EBITDA (TTM) | 1.7 |
| FCF Margin % (TTM) | 4.3% |
Source: Yahoo Finance — Quarterly Financial Statements
Corning’s leverage is manageable, not stretched. Total debt/equity was 71.45%, the current ratio was 1.813x, and total debt was $9.4B. Against that debt load, operating cash flow was $3.9B and levered free cash flow was $734.5M, so cash generation still covers debt service and leaves room for reinvestment. Net debt/EBITDA was 1.7x and FCF margin was 4.3%, which tells me EBITDA is converting to cash, but not especially efficiently after capex and other cash uses. That is why I view the balance sheet as flexible enough to absorb a moderate downturn, but not so cash-rich that leverage is a clear advantage.
Insider Activity
The insider transaction record here is one-sided: 38 open-market sales and 0 open-market purchases from 2024-12-31 to 2026-05-22, so insiders are clearly net sellers. The activity is broad rather than concentrated, with multiple executives selling across several dates, which suggests limited alignment pressure from insider buying. I do not read that as a thesis breaker, but it does remove one potential source of support for the stock.
Comparable Analysis
Growth
| Company | Revenue TTM (USD Mil) | Revenue Growth YoY % | EBITDA TTM (USD Mil) | Diluted EPS TTM |
|---|---|---|---|---|
| GLW | 16,964 | 16.6% | 4,085 | 2.2 |
| APH | 29,011.6 | 55.0% | 9,463.7 | 2.1 |
| COHR | 7,118.2 | 33.7% | 1,423.4 | 4.3 |
| KLAC | 13,579.5 | 15.2% | 6,054.8 | 3.7 |
| ENTG | 3,326.1 | 11.5% | 914.7 | 2 |
| LITE | 3,014 | 109.3% | 800.7 | -92 |
Source: Yahoo Finance
GLW’s revenue growth of 16.6% TTM sits above ENTG at 11.5% and just ahead of KLAC at 15.2%, but it trails APH at 55.0%, COHR at 33.7%, and LITE at 109.3%. That matters because the market is already paying up for semiconductor and photonics growth that GLW does not match, so the company needs better cash conversion to justify its own multiple.
Valuation
| Company | Trailing P/E | Forward P/E | EV/Revenue | EV/EBITDA | Price/Sales (TTM) | Price/Book (mrq) | Market Cap (USD Mil) | Enterprise Value (USD Mil) | Beta (5Y Monthly) | FCF Yield % (TTM) | Forward EPS | Analyst Target Price – Low | Analyst Target Price – Mean | Analyst Target Price – High | # Analyst Opinions |
|---|---|---|---|---|---|---|---|---|---|---|---|---|---|---|---|
| GLW | 75.3 | 38.3 | 8.9 | 36.9 | 8.4 | 12 | 143,335 | 150,777 | 1.15 | 0.5% | 4.3 | 129 | 194.3 | 238 | 16 |
| APH | 40.2 | 25.6 | 7.6 | 23.3 | 7.1 | 13.4 | 206,944 | 220,467 | 1.24 | 1.8% | 3.3 | 85 | 99.3 | 115 | 17 |
| COHR | 70.9 | 21.9 | 8.7 | 43.3 | 8.4 | 5.5 | 59,801 | 61,699 | 2.10 | -1.1% | 14 | 280 | 415.4 | 500 | 22 |
| KLAC | 49.2 | 26.9 | 17.5 | 39.2 | 17.4 | 37.2 | 236,015 | 237,264 | 1.44 | 1.1% | 6.7 | 175 | 233.8 | 325 | 26 |
| ENTG | 68.5 | 28 | 7.4 | 27 | 6.4 | 5.2 | 21,449 | 24,655 | 1.36 | 2.2% | 5 | 120 | 173.4 | 215 | 11 |
| LITE | — | 23.4 | 27.2 | 102.5 | 27.6 | 17.7 | 83,155 | 82,087 | 1.54 | 0.3% | 39.7 | 820 | 1,148.4 | 1,400 | 26 |
Source: Yahoo Finance
GLW’s FCF yield of 0.5% TTM is below APH at 1.8%, KLAC at 1.1%, ENTG at 2.2%, and LITE at 0.3%, which tells me GLW is priced for cleaner earnings conversion than the peer set actually shows. Its EV/revenue of 8.89x and P/E of 75.3x also sit above APH at 7.6x and 40.2x, KLAC at 17.5x and 49.2x, and ENTG at 7.4x and 68.5x, while COHR at 8.7x and LITE at 27.2x/102.5x show how much growth the market is already capitalizing into the group. A $1 investment a year ago would be worth 2.22 in GLW, versus 1.41 in APH, 2.95 in COHR, 1.89 in KLAC, 1.69 in ENTG, and 5.62 in LITE, so the stock has rerated hard even though the cash-flow profile still lags the best peers.
Profitability
| Company | Operating Margin (TTM) | Net Margin (TTM) | Return on Assets (TTM) | Return on Equity (TTM) | Gross Margin (TTM) | EBITDA Margin (TTM) |
|---|---|---|---|---|---|---|
| GLW | 15.6% | 11.2% | 5.4% | 16.8% | 36.4% | 24.1% |
| APH | 29.8% | 17.7% | 14.5% | 38.1% | 39.0% | 32.6% |
| COHR | 11.8% | 11.3% | 3.4% | 8.0% | 37.5% | 20.0% |
| KLAC | 42.5% | 35.6% | 20.8% | 87.5% | 61.3% | 44.6% |
| ENTG | 19.3% | 9.2% | 4.1% | 7.7% | 45.6% | 27.5% |
| LITE | 28.0% | -230.1% | 5.8% | -240.0% | 44.2% | 26.6% |
Source: Yahoo Finance
GLW’s operating margin of 15.6% and EBITDA margin of 24.1% trail KLAC at 42.5% and 44.6%, APH at 29.8% and 32.6%, and ENTG at 19.3% and 27.5%, while COHR at 11.8% and 20.0% and LITE at 28.0% and 26.6% show the spread is not just about one business model. The fact that GLW’s gross margin of 36.4% is close to COHR’s 37.5% and APH’s 39.0% but its operating margin is much lower points to a heavier opex burden rather than a pure cost-of-revenue problem. ROE of 16.8% and ROA of 5.37% are respectable, but they sit well below KLAC at 87.5% and 20.8%, APH at 38.1% and 14.5%, and even COHR at 8.0% and 3.4% on ROA.
Leverage
| Company | Total Debt/Equity % (mrq) | Current Ratio (mrq) | Total Debt (mrq, USD Mil) | Operating Cash Flow TTM (USD Mil) | Free Cash Flow TTM (USD Mil) | Net Debt/EBITDA (TTM) | FCF Margin % (TTM) |
|---|---|---|---|---|---|---|---|
| GLW | 71.4 | 1.8 | 9,379 | 3,915 | 734.5 | 1.7 | 4.3% |
| APH | 120.4 | 1.9 | 18,811.3 | 5,871.7 | 3,818.4 | 1.4 | 13.2% |
| COHR | 31.6 | 2.4 | 3,552.7 | 79.5 | -650 | 1.1 | -9.1% |
| KLAC | 96.9 | 2.9 | 6,151.7 | 4,143.1 | 2,624.6 | 0.2 | 19.3% |
| ENTG | 85.7 | 3 | 3,560 | 780.7 | 477.8 | 3.5 | 14.4% |
| LITE | 36 | 1.7 | 1,671.2 | 751.4 | 224.7 | -1.3 | 7.5% |
Source: Yahoo Finance
GLW’s net debt/EBITDA of 1.7x is moderate versus APH at 1.4x, KLAC at 0.2x, ENTG at 3.5x, and LITE at -1.3x, while its debt/equity of 71.45% is below APH at 120.4% and KLAC at 96.9% but above ENTG at 85.7% and COHR at 31.6%. The more telling read is FCF margin: GLW at 4.3% lags APH at 13.2%, KLAC at 19.3%, ENTG at 14.4%, and even LITE at 7.5%, so the balance sheet is not stretched, but cash conversion is weaker than the better peers. That weaker cash conversion is why GLW’s valuation premium looks harder to defend than APH’s or KLAC’s, even before you factor in the company’s lower growth rate.
Conclusion
I would put my rating as a hold because the stock’s rerating has already moved ahead of the cash evidence. Corning has real operating momentum, and the NVIDIA partnership plus Springboard give it a credible path to higher earnings power, but the current 0.5% FCF yield and 4.3% FCF margin say the business is still converting sales into cash too slowly for a 36.9x EV/EBITDA multiple. In my view, that is the key tension: the moat is intact, but the market is already paying for a much better cash-conversion outcome than the numbers currently show.
I would raise my rating more toward a buy if core operating margin holds above 20.0% for two consecutive quarters, because that would show the Springboard mix shift is turning into durable earnings power rather than a one-quarter lift. If that happens while FCF margin moves from 4.3% toward roughly 8.0%, Corning would be generating about $1.4B of annual free cash flow on the current revenue base, which would materially improve valuation support and make the current multiple easier to defend. A second confirmation would be revenue staying above $4.2B per quarter, since that would show the AI and optical demand mix is broad enough to absorb Display volatility.
The bear case is more credible if revenue slips back below $4.1B for a quarter and FCF margin stays near 4.0%, because that would tell me the business is still converting growth into cash too slowly for the current valuation. If net leverage drifts above 2.0x, meaning debt is rising faster than EBITDA, the balance sheet would stop being a support and start becoming a constraint, especially with $9.4B of debt already on the books. In that scenario, the market would likely stop paying for execution and start paying attention to the cyclicality in Display and Optical.
Weighing both sides, I lean to the bear case arriving first because the stock has already rerated hard on the promise of AI exposure, yet the cash flow evidence is still thin. I would need to see the next two quarters prove that higher capex is turning into higher cash generation before I get more constructive.
What to Watch Next
- Core operating margin above 20.0% for two quarters — would support a move toward buy.
- FCF margin near 8.0% — would show cash conversion is catching up with sales growth.
- Quarterly revenue above $4.2B — would confirm AI and optical demand is broadening.
- Revenue below $4.1B and FCF margin near 4.0% — would strengthen the bear case.
- Net leverage above 2.0x — would start to constrain the balance-sheet story.
What’s your take? I rated Corning (GLW) HOLD above — but the goal here is to get this right, not just to publish an opinion. What would you add to this analysis, or which risk or catalyst do you think I’m under- or over-weighting? Tell me in the comments.
Sources
- SEC 10-K Annual Report — filed 2026-02-12
- SEC 8-K Filing (2026-05-15)
- SEC 8-K Filing (2026-05-06)
- SEC 8-K Filing (2026-05-04)
- SEC 8-K Filing (2026-05-04)
- SEC 8-K Filing (2026-04-28)
- SEC 8-K Filing (2026-02-27)
- SEC Form 4 Insider Transaction (2026-05-26)
- SEC Form 4 Insider Transaction (2026-05-18)
- SEC Form 4 Insider Transaction (2026-05-15)
- SEC 10-K Annual Report — FY2026
- SEC 10-K Annual Report — FY2025
- SEC 10-K Annual Report — FY2024
- SEC 10-K Annual Report — FY2023
- SEC 10-K Annual Report — FY2022
Data sourced from Yahoo Finance and SEC EDGAR. Not investment advice.
Leave a Comment