| Company | Sep 25 | Oct 25 | Nov 25 | Dec 25 | Jan 26 | Feb 26 | Mar 26 | Apr 26 | May 26 | Jun 26 | Jul 26 | Aug 26 | 12-Mo |
|---|---|---|---|---|---|---|---|---|---|---|---|---|---|
| LAR | -2% | +26% | +32% | +0% | +21% | +20% | -17% | +52% | +2% | -20% | -27% | +13% | +99% |
| SQM | -6% | +14% | +31% | +7% | +12% | -1% | +6% | +14% | -6% | -14% | -9% | +18% | +76% |
| SGML | -4% | +1% | +74% | +17% | -18% | +34% | -14% | +79% | -24% | -25% | -22% | +28% | +88% |
| ALB | -4% | +21% | +32% | +9% | +21% | +5% | +1% | +10% | -10% | -23% | -13% | +15% | +61% |
| LAC | +91% | -4% | +2% | -23% | +12% | +4% | -22% | +45% | -9% | -26% | -25% | +8% | +3% |
Source: Yahoo Finance monthly adjusted close.
Quick Thesis
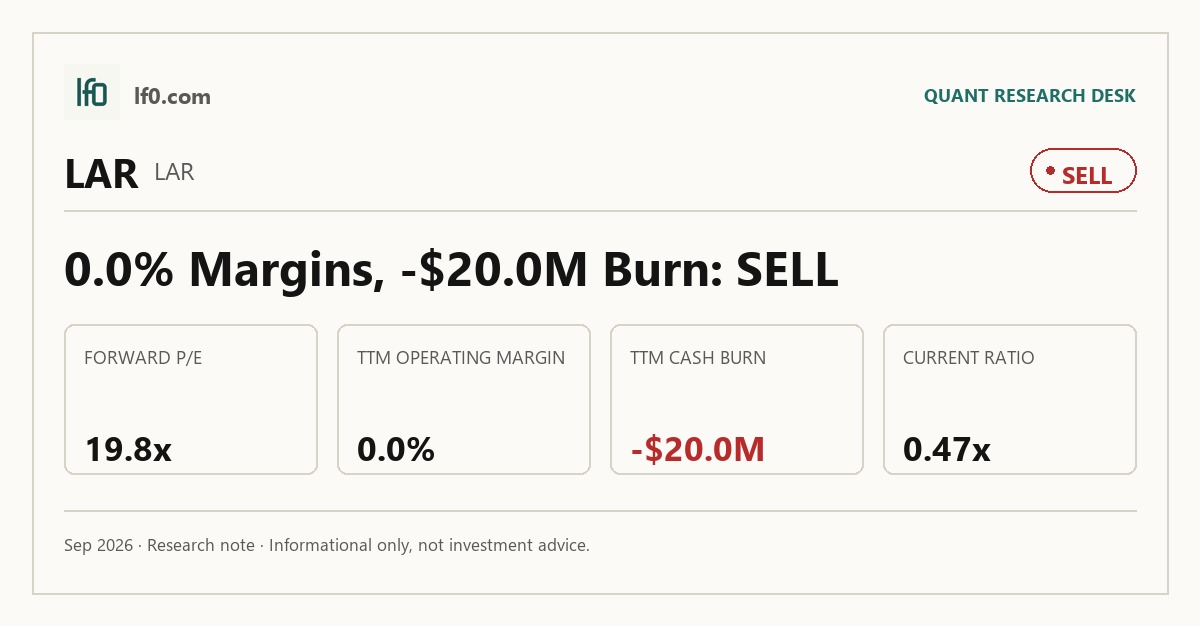
- Rated Sell — the stock already discounts a recovery that is not yet visible in cash flow.
- Strongest point: net debt/EBITDA is -4.1x TTM, so cash still exceeds debt.
- Biggest risk: levered free cash flow is -$16.4M TTM, so the business is not self-funding.
- Valuation is mixed: 19.8x forward P/E and 1.41x price/book are not cheap against 0.0% margins.
- I would turn more constructive if Cauchari-Olaroz drives positive operating cash flow and free cash flow.
Executive Summary
Rating: SELL | LAR
Measured from adjusted close on 2026-09-08 to 2026-10-22. Sell ratings are correct when the stock falls; Hold is tracked as a +/-10% range. Daily-close data, not intraday. Calls are tracked for 182 days from publication, then frozen as a final record.
I would put my rating as a Sell because the market has already rewarded Lithium Argentina for a recovery that has not yet shown up in revenue, cash flow, or margins. The company’s producing asset is real, but TTM operating cash flow is -$20M and levered free cash flow is -$16.4M, so the equity still depends on a cleaner operating inflection than the current numbers prove. I would raise my rating more towards a Hold or Buy if Cauchari-Olaroz turns the company to positive operating cash flow and free cash flow, because that would show the asset is funding the portfolio rather than consuming it.
Company Profile
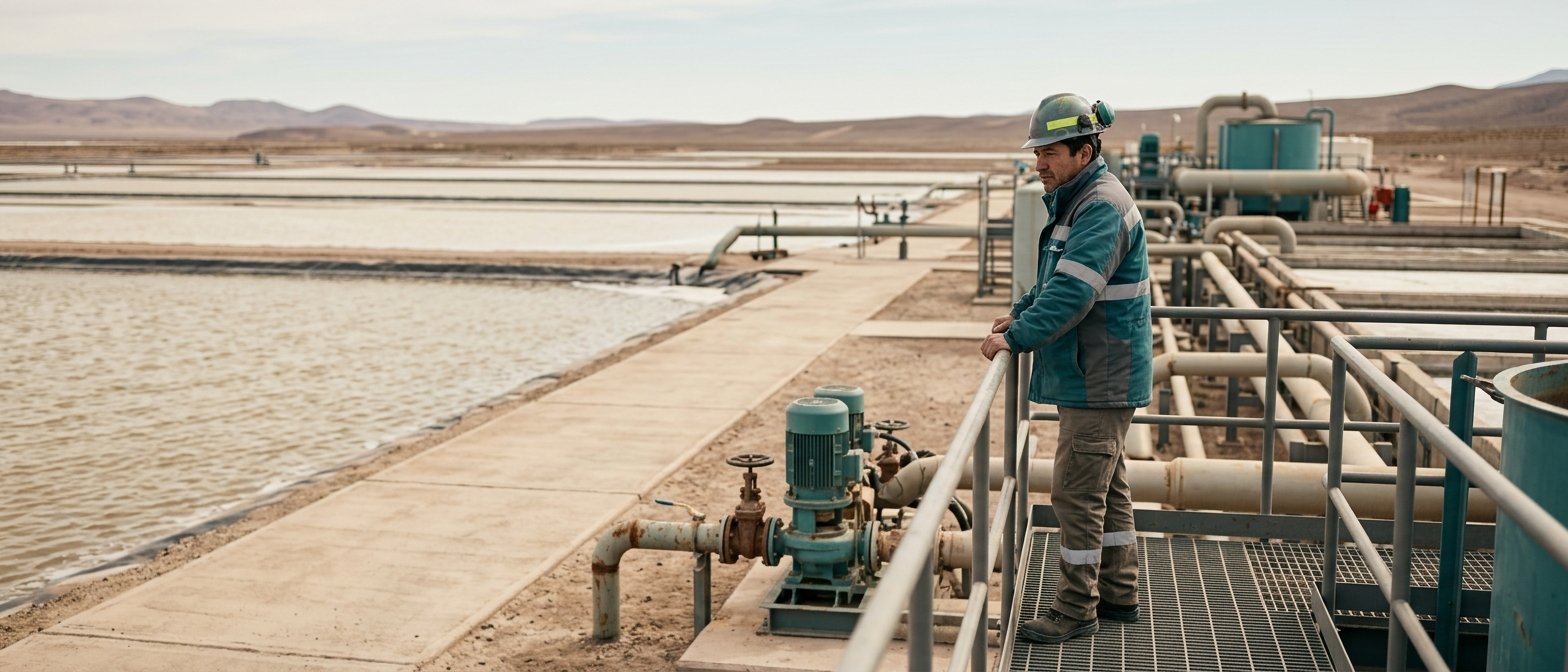
Lithium Argentina AG is a Swiss-domiciled lithium producer and developer listed on the NYSE and TSX under LAR. It holds a 44.8% equity interest in Minera Exar S.A., the operator of the Cauchari-Olaroz brine project in Jujuy, Argentina, and it also owns 85.1% of Pastos Grandes and 65.0% of Sal de la Puna, both lithium brine projects in Salta province. The company separated from Lithium Americas Corp. in October 2023 and later continued from British Columbia to Zug, Switzerland on January 23, 2025, which formalized its narrower Argentina-focused structure without changing the share count. It had 162.4 million shares outstanding at December 31, 2025 and carries US$258.8M of 1.75% convertible senior notes due January 15, 2027, alongside project-level debt and shareholder loans tied to Cauchari-Olaroz.
Economic Moat
Business Model
The most defensible part of Lithium Argentina’s model is its Cauchari-Olaroz exposure, because it ties value to a producing asset rather than a greenfield promise. In the 20-F, the company says it is entitled to 49% of Cauchari-Olaroz output, or about 19,600 tonnes per annum of lithium carbonate at full capacity, and it has fixed offtake agreements with Ganfeng and Bangchak for most of that share. I feel that a competitor would struggle to replicate that position within 3 years because it rests on a 44.8% ownership stake in Minera Exar, a shareholder agreement with Ganfeng, and a commercial asset that began production on October 1, 2024. The 2025 loan restructuring also matters: by extending maturities and resetting rates, it helps keep the operating asset funded while the project ramps.
Business & Operating Risks
The most material disclosed risk is funding dependence on related-party and project debt. According to the risk factors in their SEC 10-K, the company will use existing working capital, draw on its limited recourse loan facility, or raise additional funds as needed and if available to keep exploration and development moving. That is not a mature-miner profile; it is an admission that liquidity is still the gating item, and the March 2026 $130M debt facility with Ganfeng, secured by the company’s equity interest in the proposed New JV, shows how much of the capital structure is already tied to project-level assets. Foreign currency exposure is the next issue, because the filing points to US dollar functional currency exposure against Canadian dollars, Argentine pesos, Swiss francs, and US dollars, while noting that the company did not hold significant cash in CDN$, ARS$, or CHF at December 31, 2025. Joint-venture dependence is also real: the new facility requires up to 50.0% of initial offtake, capped at 6,000 tonnes per annum of lithium carbonate equivalent, to be sold to Ganfeng at market prices, which reduces flexibility if the project timetable slips.
In my view, these risks do not break the moat itself, but they do keep the moat from translating into clean equity value because the Cauchari-Olaroz advantage is still being financed rather than fully monetized.
Management Discussion & Analysis
Management is signaling a better lithium backdrop, but it is still waiting for that backdrop to convert into operating leverage. In its MD&A, the company cites Benchmark Minerals Intelligence forecasts for global lithium demand to rise about 20.0% year on year in 2026 and BESS demand to expand about 48.0% to roughly 427.0 kt LCE, which supports the long-term market case. The more important read is that management is leaning on industry-wide capital discipline and higher prices rather than on a company-specific operating milestone, so the tone is constructive but not yet self-help driven. That means the company is acknowledging the same financing and liquidity pressure highlighted above, but it is not yet showing that the pressure has been fully relieved.
Recent Events
The most important recent development is the 2025 loan restructuring, because it extended maturities and reset rates to market levels while keeping the project funded. That supports the moat by reducing near-term financing strain, but it also confirms that the business is still being managed through project finance rather than through internally generated cash. The January 23, 2025 continuation to Zug and the January 2025 name change to Lithium Argentina AG were structural cleanups, not operating catalysts, so they sharpened the corporate frame without changing the underlying dependence on Cauchari-Olaroz.
Financial Analysis
Growth
LAR — Financial Growth (Quarterly, USD Mil)
| Metric | 2025-03-31 | 2025-06-30 | 2025-09-30 | 2025-12-31 | 2026-03-31 | 2026-06-30 |
|---|---|---|---|---|---|---|
| EBIT (USD Mil) | — | 2.8 | -59.2 | 6.6 | 14.4 | 8.9 |
| EBITDA (USD Mil) | — | 2.9 | -59.1 | 6.8 | 14.5 | 9 |
| NET INCOME (USD Mil) | — | -4.1 | -64.4 | 0.3 | 8.8 | 1.4 |
| DILUTED EPS | 0 | 0 | -0.4 | — | 0.1 | 0 |
Source: Yahoo Finance — Quarterly Financial Statements
Revenue is still effectively flat in the reported quarters, with $0.0 in Q2 2025, Q3 2025, Q4 2025, Q1 2026, and Q2 2026, so the growth line does not yet show commercial scale. EBITDA moved from $2.9M in Q2 2025 to -$59.1M in Q3 2025, then back to $6.8M in Q4 2025 and $14.5M in Q1 2026 before easing to $9M in Q2 2026, which tells me earnings are improving faster than revenue but remain volatile. The Q3 2025 collapse and Q1 2026 rebound are not explained in the MD&A context provided, so I would want more disclosure before reading too much into the swing. Growth is a bear signal because the business has not yet translated lithium demand tailwinds into reported revenue.
Profitability
LAR — Profitability (TTM)
| Metric | TTM |
|---|---|
| Operating Margin (TTM) | 0.0% |
| Net Margin (TTM) | 0.0% |
| Return on Assets (TTM) | -2.1% |
| Return on Equity (TTM) | -6.6% |
| EBITDA Margin (TTM) | — |
Source: Yahoo Finance — Trailing Twelve Months (TTM)
TTM operating margin is 0.0%, TTM net margin is 0.0%, and TTM EBITDA margin is not disclosed, which tells me the business is still at the breakeven line rather than in a mature earnings phase. TTM return on assets is -2.05% and return on equity is -6.58%, so capital is still being consumed rather than compounded, and the ROE gap versus ROA suggests the equity base is being hit harder than the asset base. That matters for the moat because the producing asset described above has not yet translated into durable earnings power. For investors, the key watchpoint is a positive operating margin and then a positive net margin, because that would show the company is moving from development-stage economics toward self-funding profitability.
Valuation
LAR — Valuation Multiples
| Metric | Value |
|---|---|
| Market Cap (USD Mil) | 1,114 |
| Enterprise Value (USD Mil) | 1,317 |
| Forward P/E | 19.8 |
| Price/Book (mrq) | 1.4 |
| EV/EBITDA | -35.4 |
| Beta (5Y Monthly) | 2.46 |
| FCF Yield % (TTM) | -1.5% |
| Forward EPS (USD) | 0.3 |
| Analyst Target Price – Low (USD) | 8.5 |
| Analyst Target Price – Mean (USD) | 11.7 |
| Analyst Target Price – High (USD) | 19.8 |
| # Analyst Opinions | 8 |
Source: Yahoo Finance
LAR screens on a mixed lens, but the valuation signal is mostly balance-sheet and cash-burn driven because earnings-based multiples are distorted. The stock trades at 19.8x forward P/E, 1.41x price/book, and a 0.42 PEG ratio, which implies the market is paying for a sharp earnings recovery rather than the latest reported profitability. The more decision-relevant anchors are EV/EBITDA of -35.4x and FCF yield of -1.5% TTM. The negative EV/EBITDA reflects negative trailing EBITDA, so the multiple itself is not a useful cheap or expensive signal here, and the negative FCF yield means the company is still burning cash. Market cap is $1.1B and book value per share is $4.8 mrq, while total cash per share is $0.6 mrq, so the stock is trading well above net cash and book support. Beta is 2.5, which means the shares are volatile and the market is pricing in a high-risk recovery.
On the analysis here, I would put fair value in a range of $8.5–$11.7, which sits around the analyst mean target of $11.7 and below the $19.8 high. That is not a strong consensus endorsement in my view; it says coverage is split between a recovery case and a more cautious cash-flow case, and I weight the latter more heavily because the company is still not generating positive free cash flow. On EPS, I would frame fair value around $0.3–$0.4 per share, which is close to the company’s own forward EPS of $0.3 and below the stronger peer earnings power at SQM and ALB. Put differently, the market is paying for an earnings step-up that is still ahead of the reported cash flow, not for a proven earnings base.
Leverage
LAR — Leverage & Coverage (Quarterly)
| Metric | Value |
|---|---|
| Total Debt/Equity % (mrq) | 30 |
| Current Ratio (mrq) | 0.5 |
| Total Debt (mrq, USD Mil) | 251.5 |
| Operating Cash Flow (TTM, USD Mil) | -20 |
| Levered Free Cash Flow (TTM, USD Mil) | -16.4 |
| Net Debt/EBITDA (TTM) | -4.1 |
Source: Yahoo Finance — Quarterly Financial Statements
Total debt is $251.5M mrq, with total debt/equity of 30.0% mrq and a current ratio of 0.47x, so the balance sheet is not stretched by absolute debt but is tight on near-term liquidity. Operating cash flow was -$20M TTM and levered free cash flow was -$16.4M TTM, which means EBITDA is not converting into cash and the business is still consuming liquidity rather than building it. Net debt/EBITDA was -4.1x TTM, a sign that cash exceeds debt on a net basis, but that does not offset the negative cash generation because the current ratio is below 1.0x. In my opinion this is medium refinancing risk because the company has cash on hand, but the negative operating and free cash flow mean that cushion erodes unless operations improve before any refinancing date.
Insider Activity
Insider ownership is 15.7%, while institutional ownership is 40.5%, so the register is not dominated by either insiders or passive holders. Short interest is modest at 3.1% of float, which tells me the market is skeptical but not aggressively positioned against the name. I would not overread those figures on their own, but they fit the broader picture: the stock is being held by investors who are willing to wait for operating proof, not by a market that has already fully dismissed the equity.
Comparable Analysis
Growth
| Company | Revenue Growth YoY % | EBITDA TTM (USD Mil) | Diluted EPS TTM |
|---|---|---|---|
| LAR | — | -37.2 | -0.3 |
| SQM | 136.7% | 3,004 | 4.9 |
| SGML | 223.9% | 41.6 | -0.2 |
| ALB | 31.1% | 1,482.5 | 0.3 |
| LAC | — | -64.6 | -0.5 |
Source: Yahoo Finance
LAR has no reported TTM revenue growth, while SQM grew revenue 136.7% TTM, SGML 223.9% TTM, and ALB 31.1% TTM. That gap says LAR is not being valued as a growth leader, so any premium would have to come from balance-sheet repair or a sharper earnings inflection that is not yet visible. LAC is the closest comp on distress, but its 3.8% 1-year return and negative EBITDA profile make it a different case.
Valuation
| Company | Trailing P/E | Forward P/E | EV/Revenue | EV/EBITDA | Price/Book (mrq) | Market Cap (USD Mil) | Enterprise Value (USD Mil) | Beta (5Y Monthly) | FCF Yield % (TTM) | Forward EPS | Analyst Target Price – Low | Analyst Target Price – Mean | Analyst Target Price – High | # Analyst Opinions |
|---|---|---|---|---|---|---|---|---|---|---|---|---|---|---|
| LAR | — | 19.8 | — | -35.4 | 1.4 | 1,114 | 1,317 | 2.46 | -1.5% | 0.3 | 8.5 | 11.7 | 19.8 | 8 |
| SQM | 15.7 | 11.4 | 3.7 | 8.4 | 3.5 | 21,831 | 25,162 | 1.02 | 12.0% | 6.7 | 44.4 | 85.1 | 110 | 18 |
| SGML | — | 7.2 | 11.6 | 39.8 | 16.9 | 1,395 | 1,655 | 0.60 | 3.2% | 1.7 | 19.5 | 19.8 | 20 | 2 |
| ALB | 467.7 | 11.2 | 3 | 12 | 1.9 | 14,902 | 17,763 | 1.33 | 8.9% | 11.3 | 83.3 | 172.6 | 225 | 20 |
| LAC | — | -21.3 | — | -30.2 | 0.8 | 1,089 | 1,949 | 3.47 | -123.8% | -0.1 | 3.3 | 5.5 | 10 | 9 |
Source: Yahoo Finance
LAR trades at 19.8x forward P/E, 1.41x price/book, and -1.5% FCF yield TTM, versus SQM at 11.4x forward P/E, 12.0% FCF yield, and 3.7x EV/revenue; ALB sits at 11.2x forward P/E and 8.9% FCF yield, while SGML is 7.2x forward P/E but only 3.2% FCF yield. On a peer-multiple basis, LAR does not screen cheap enough to offset its weaker cash generation, and the market is not paying a growth premium for it the way it is for stronger cash generators. LAR’s 8 analyst opinions and $11.7 mean target suggest the market is still debating recovery, not paying up for it.
Profitability
| Company | Operating Margin (TTM) | Net Margin (TTM) | Return on Assets (TTM) | Return on Equity (TTM) |
|---|---|---|---|---|
| LAR | 0.0% | 0.0% | -2.1% | -6.6% |
| SQM | 48.8% | 20.6% | 11.6% | 21.8% |
| SGML | 24.6% | -19.3% | 4.1% | -31.6% |
| ALB | 27.7% | 3.8% | 3.2% | 2.6% |
| LAC | 0.0% | 0.0% | -1.7% | -3.7% |
Source: Yahoo Finance
LAR’s operating margin and net margin are both 0.0% TTM, with ROA at -2.1% and ROE at -6.6%, while SQM posts 48.8% operating margin, 20.6% net margin, 11.6% ROA, and 21.8% ROE; ALB also shows 27.7% operating margin and 3.8% net margin. That spread points to a business that is still below peer operating scale, not just temporarily under-earning, so the market should not assume LAR can re-rate on profitability alone.
Leverage
| Company | Total Debt/Equity % (mrq) | Current Ratio (mrq) | Total Debt (mrq, USD Mil) | Operating Cash Flow TTM (USD Mil) | Free Cash Flow TTM (USD Mil) | Net Debt/EBITDA (TTM) |
|---|---|---|---|---|---|---|
| LAR | 30 | 0.5 | 251.5 | -20 | -16.4 | -4.1 |
| SQM | 61.2 | 2.6 | 5,314.4 | 2,768.1 | 2,618.8 | 0.3 |
| SGML | 336.6 | 0.3 | 277 | 37.8 | 44.1 | 6.3 |
| ALB | 19 | 2.1 | 1,998.9 | 1,800.3 | 1,334.3 | 0.2 |
| LAC | 59.6 | 5.5 | 1,161 | -35.7 | -1,348.9 | -5.2 |
Source: Yahoo Finance
LAR’s total debt/equity is 30.0% mrq and net debt/EBITDA is -4.1x TTM because cash exceeds debt, but the current ratio is only 0.47x and operating cash flow is -$20M TTM, which means liquidity is tight despite the net-cash label. SQM and ALB both have positive current ratios of 2.6x and 2.1x, so LAR’s financing position is more fragile than the net debt figure alone implies. That weaker liquidity profile helps explain why LAR trades at a discount to the stronger cash generators even though its headline leverage is not extreme.
Conclusion
I would put my rating as a Sell because the stock already prices in a recovery that has not yet shown up in revenue, cash flow, or margins. The latest twelve months still show negative operating cash flow of $20M and levered free cash flow of $16.4M, while TTM return on equity is -6.6% and current ratio is only 0.47x, so the equity is still dependent on a cleaner operating inflection than the filing currently proves.
The bull case is straightforward: if Cauchari-Olaroz turns the company to positive operating cash flow and free cash flow, the producing asset would finally be funding the rest of the portfolio rather than consuming it. I would raise my rating more towards a Buy if that happens and if the current ratio moves back above 1.0x, meaning near-term liquidity is no longer tight; if annualized cash generation improves by roughly $20M to $30M versus the current TTM burn, the balance sheet would start to support a higher multiple rather than just survive one.
The bear case is just as clear. I would keep the rating at Sell if the company has to refinance the January 2027 convertible notes and project debt on worse terms while operating cash flow stays negative, because that would confirm the business is still relying on external funding instead of self-funding. If the current ratio stays below 0.5x and levered free cash flow remains negative, the equity would remain exposed to dilution or more secured borrowing, and the market would be paying 19.8x forward earnings for a recovery that has not yet earned credibility.
Weighing both paths, I lean to Sell because the asset base is real but the market has already rewarded the shares with a 92.4% one-year return, so the easy rerating may already be behind it. What keeps me from turning more constructive is simple: the latest cash flow and liquidity figures still look too fragile for me to underwrite a cleaner re-rating today.
What to Watch Next
- Positive operating cash flow — would show Cauchari-Olaroz is funding the portfolio.
- Levered free cash flow turning positive — would reduce dilution and refinancing risk.
- Current ratio back above 1.0x — would signal near-term liquidity is no longer tight.
- Refinancing of the January 2027 convertible notes on acceptable terms — would confirm funding access.
- Sustained EBITDA improvement without another cash burn quarter — would support a higher multiple.
What’s your take? I rated Lithium Argentina (LAR) SELL above — but the goal here is to get this right, not just to publish an opinion. What would you add to this analysis, or which risk or catalyst do you think I’m under- or over-weighting? Tell me in the comments.
Data sourced from Yahoo Finance and SEC EDGAR. Not investment advice.
Leave a Comment