
| Company | Sep 25 | Oct 25 | Nov 25 | Dec 25 | Jan 26 | Feb 26 | Mar 26 | Apr 26 | May 26 | Jun 26 | Jul 26 | Aug 26 | 12-Mo |
|---|---|---|---|---|---|---|---|---|---|---|---|---|---|
| SNEX | -1% | -9% | -1% | +5% | +18% | +14% | -5% | +31% | +7% | +5% | -3% | -11% | +51% |
| ICE | -4% | -13% | +8% | +3% | +7% | -6% | -4% | +1% | -6% | -16% | +24% | +5% | -8% |
| STT | +1% | +0% | +3% | +8% | +2% | -2% | -2% | +22% | +2% | +9% | +9% | +4% | +71% |
| NDAQ | -6% | -3% | +6% | +7% | -0% | -10% | -3% | +8% | +1% | -15% | +20% | +5% | +5% |
| IBKR | +11% | +2% | -8% | -1% | +16% | -5% | -6% | +19% | +9% | +0% | +1% | +11% | +57% |
| CME | +2% | -2% | +6% | -3% | +6% | +11% | -5% | -3% | -5% | -19% | +21% | +7% | +11% |
Source: Yahoo Finance monthly adjusted close.
Quick Thesis
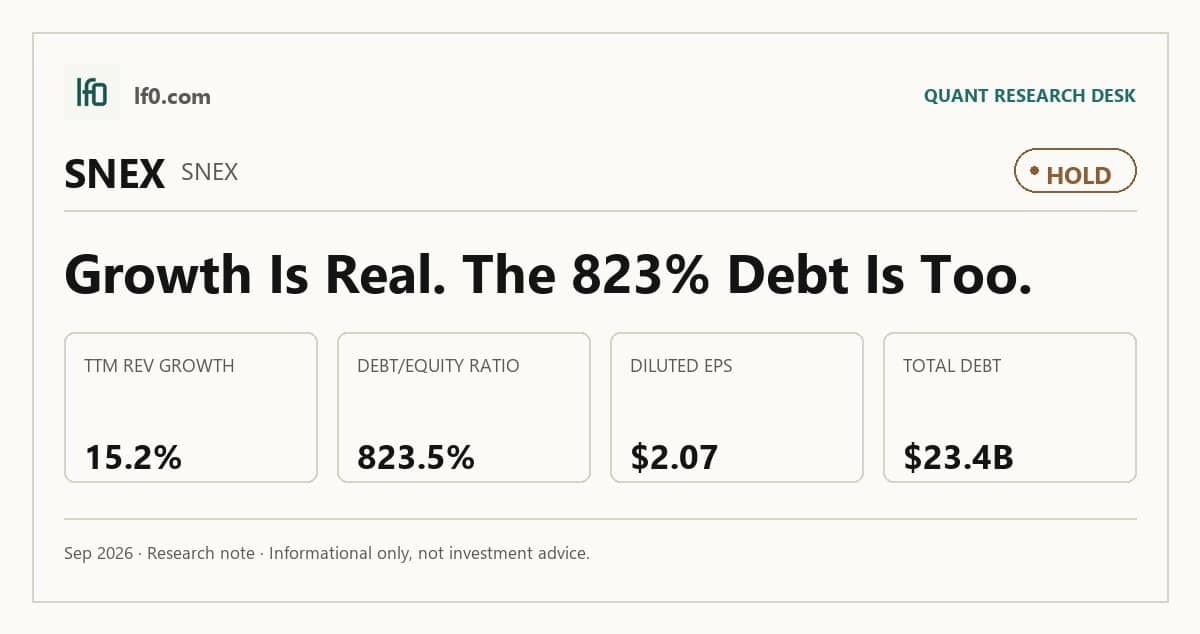
- Rated Hold — growth is real, but leverage and thin margins cap upside.
- TTM revenue growth was 15.2%, with quarterly EPS up 85.2% year over year.
- Main risk: debt/equity was 823.5%, leaving little room for error.
- Valuation is mixed: 14.9x forward P/E and 0.05x sales are not expensive, but not a bargain.
- I would turn more constructive if revenue stays above $40B and leverage stops rising.
Executive Summary
Rating: HOLD | SNEX
Measured from adjusted close on n/a to 2026-09-11. Sell ratings are correct when the stock falls; Hold is tracked as a +/-10% range. Daily-close data, not intraday. Calls are tracked for 182 days from publication, then frozen as a final record.
I would put my rating as a Hold because StoneX is still growing, but the market already discounts that growth and the balance sheet remains stretched. Revenue rose 15.2% TTM and quarterly earnings growth was 85.2%, yet the stock is already trading on 14.9x forward earnings, so I do not see enough valuation support to move higher today.
The key tension is that StoneX has built a broader, more durable network, but it is monetizing that network through a capital structure that leaves little margin for disappointment. TTM operating margin was only 0.4%, so the franchise still depends on active markets and disciplined funding rather than on a wide profit buffer.
I would raise my rating more toward a Buy if quarterly revenue can stay above $40B for the next two quarters, meaning the current run rate is holding rather than fading, and if operating margin moves closer to 1.0%, which would show more of that activity is dropping through to earnings. If leverage also starts to come down from 823.5% debt/equity, the case would improve further.
Company Profile
StoneX Group Inc. is a global financial services network that earns revenue from commissions and spreads on trading and hedging activity, plus interest and fees on client balances, advisory work, market intelligence, and payments foreign exchange spreads. It serves more than 54,000 commercial, institutional, and payments clients and over 400,000 self-directed retail accounts in more than 180 countries through digital platforms, execution, clearing, custody, and physical commodity trading.
Founded in 1924, the company has expanded through acquisitions including GAIN Capital in 2020, Incomm S.A.S. in 2023, Trust Advisory Group in 2024, and JBR Recovery in 2024, which broadened its retail, commodity, wealth, and metals capabilities. StoneX is headquartered in the U.S., listed on Nasdaq under SNEX, and operates through regulated subsidiaries across North America, Europe, Asia Pacific, Latin America, and the Middle East.
Economic Moat
Business Model
The hardest-to-replicate element is the end-to-end network that links execution, clearing, custody, payments, and advisory services across regulated subsidiaries, because I feel that a well-funded competitor would struggle to rebuild that combination of licenses, client balances, exchange memberships, and operating relationships within 3 years. In my view, that is most defensible in the Commercial and Institutional businesses, where StoneX can serve clients from trade idea to post-trade settlement and then monetize balances, market intelligence, and risk management services in the same relationship.
The current 10-K also shows scale in regulated infrastructure: one U.S. futures commission merchant held $5.7B in required client segregated assets as of September 30, 2024, and the U.K. subsidiary is one of only seven Category One ring dealing members of the London Metal Exchange. That combination supports the moat thesis because it is not just a brokerage franchise; it is a regulated operating network that is difficult to copy quickly.
Business & Operating Risks
StoneX’s biggest disclosed risk is that revenues can swing sharply with commodity volatility, trading volume, and short-term rates. According to the risk factors in its SEC 10-K, there have been significant declines in trading volumes and revenues and profitability are likely to decline during periods of stagnant economic conditions or lower trading volume, while low short-term interest rates also pressure profitability.
Margin funding and counterparty credit risk are the next pressure points. The filing says StoneX must post margin on short notice and relies on five committed credit facilities totaling $1.205B, so a bad market move can force it to fund client positions with its own cash if clients cannot meet calls. Cybersecurity and third-party outage risk is also real: the January 31, 2023 ION Group incident rendered certain services inaccessible and forced restrictions on U.K. clients.
These risks do not break the moat, but they do test it. The network advantage remains intact, yet the same regulated infrastructure that supports the franchise also makes earnings and liquidity sensitive to market shocks.
Management Discussion & Analysis
Management is responding to those risks by extending debt maturities and keeping the operating model flexible, but it has not yet solved the leverage issue. On March 1, 2024, StoneX issued $550M of 7.875% Senior Secured Notes due 2031 and used the proceeds to retire $347.9M of 8.625% notes due 2025 and pay down revolver borrowings, which pushed refinancing risk out but did not reduce the absolute debt burden.
The company also kept variable expenses at 52% of total expenses in both FY2024 and FY2023, which tells me management is still protecting flexibility in a cyclical business. At the same time, fixed compensation and benefits rose 13% to $435.9M and other non-compensation expenses rose 5% to $479.5M, so cost discipline is only partial. That matters because the moat is strongest when the network can scale without fixed costs outrunning revenue.
Recent Events
The most important recent development was the December 5, 2024 management reshuffle: Sean O’Connor moved to Executive Vice-Chairman, while Philip Smith became Group Chief Executive Officer and Charles Lyon became Group President. I read that as a planned handoff rather than a disruption, and it should help preserve continuity in the franchise.
The August 28, 2024 bylaw overhaul also looks defensive. Advance-notice rules, forum selection provisions, and tighter special-meeting mechanics make it harder for activists to force process fights, which supports management continuity but also reduces outside pressure on capital allocation. The CAB Payments process was the one clear negative: StoneX disclosed an unsolicited proposal on October 21, 2024 and then walked away on November 7, 2024, which tells me management is willing to pass when the fit or price is not right.
Financial Analysis
Growth
SNEX — Financial Growth (Quarterly, USD Mil)
| Metric | 2025-06-30 | 2025-09-30 | 2025-12-31 | 2026-03-31 | 2026-06-30 |
|---|---|---|---|---|---|
| REVENUE (USD Mil) | 34,828.8 | 32,723.4 | 39,029.9 | 45,760.9 | 40,193 |
| EBIT (USD Mil) | 477 | 545.5 | 672.9 | 714.7 | 670.7 |
| EBITDA (USD Mil) | 496.4 | 579.2 | 704.8 | 744.9 | 708.9 |
| NET INCOME (USD Mil) | 63.4 | 85.7 | 139 | 174.3 | 127.9 |
| DILUTED EPS | 0.5 | 1 | 1.7 | 2.1 | 0.7 |
Source: Yahoo Finance — Quarterly Financial Statements
StoneX’s revenue rose from $32.7B in Q2 2025 to $39B in Q4 2025, then to $45.8B in Q1 2026 before easing to $40.2B in Q2 2026. That is a 22.4% year-over-year increase in Q1 2026 and a 15.9% increase in Q2 2026, so the top line is clearly growing even if the path is choppy.
EBITDA grew faster than revenue in Q1 2026, rising 50.3% year over year to $744.9M, but slowed to 42.8% growth in Q2 2026 at $708.9M. Diluted EPS jumped to $2.1 in Q1 2026 and then fell to $0.7 in Q2 2026, which tells me the business can still convert activity into earnings but remains exposed to quarter-to-quarter volatility.
Profitability
SNEX — Profitability (TTM)
| Metric | TTM |
|---|---|
| Operating Margin (TTM) | 0.4% |
| Net Margin (TTM) | 0.3% |
| Return on Assets (TTM) | 1.2% |
| Return on Equity (TTM) | 21.9% |
| Gross Margin (TTM) | 1.7% |
Source: Yahoo Finance — Trailing Twelve Months (TTM)
TTM gross margin was 1.7%, while TTM operating margin was 0.4% and TTM net margin was 0.3%. That spread says the business still clears only a thin amount after direct costs, so the investment case depends on scale and expense control rather than pricing power.
Return on assets was 1.2% TTM and return on equity was 21.9% TTM. The gap between those two figures shows leverage is doing part of the work, which makes the return profile more sensitive to funding conditions and market stress.
Valuation
SNEX — Valuation Multiples
| Metric | Value |
|---|---|
| Market Cap (USD Mil) | 8,488 |
| Enterprise Value (USD Mil) | -6,520 |
| Trailing P/E | 19.1 |
| Forward P/E | 14.9 |
| Price/Sales (TTM) | 0.1 |
| Price/Book (mrq) | 3 |
| EV/Revenue | 0 |
| EV/EBITDA | — |
| Beta (5Y Monthly) | 0.64 |
| Forward EPS (USD) | 4.7 |
| Analyst Target Price – Low (USD) | 75 |
| Analyst Target Price – Mean (USD) | 75 |
| Analyst Target Price – High (USD) | 75 |
| # Analyst Opinions | 1 |
Source: Yahoo Finance
StoneX screens as fairly valued rather than cheap. Trailing P/E is 19.1x and forward P/E is 14.9x, so the market is paying for continued earnings growth, while price/sales of 0.05x looks low only because the business carries a very large revenue base relative to market value.
On my read, fair value sits around $70-$75 per share, which is close to the current implied price and exactly in line with the lone analyst target of 75. With only one analyst opinion, there is no meaningful consensus range to triangulate beyond that single point, so I would not overstate the precision here. Forward EPS of 4.73 also looks reasonable against peers, but the stock is not priced like a deep-value name given the leverage and the still-thin margin structure.
Leverage
SNEX — Leverage & Coverage (Quarterly)
| Metric | Value |
|---|---|
| Total Debt/Equity % (mrq) | 823.5 |
| Current Ratio (mrq) | 1.1 |
| Total Debt (mrq, USD Mil) | 23,419.5 |
| Operating Cash Flow (TTM, USD Mil) | 3,857.9 |
| Net Debt/EBITDA (TTM) | — |
Source: Yahoo Finance — Quarterly Financial Statements
StoneX’s leverage is elevated but still serviceable. Total debt/equity was 823.5%, current ratio was 1.065x, and total debt was $23.42B, while total cash was $38.43B and total cash per share was 318.6.
Cash generation is the offset: operating cash flow was $3.858B TTM, which helps explain why the company can carry the debt load without immediate distress. Even so, the balance sheet depends on continued access to funding markets rather than excess liquidity, and that is why I would not pay a premium multiple for the equity yet.
Insider Activity
The insider transaction record is one-sided: 37 open-market sales and 0 open-market purchases across 69 Form 4 filings parsed from 2025-01-31 to 2026-05-22. The activity is broad rather than isolated, with multiple executives and directors selling in size, which tells me insiders are taking cash off the table while no one is stepping in as a buyer.
Comparable Analysis
Growth
| Company | Revenue TTM (USD Mil) | Revenue Growth YoY % | Diluted EPS TTM |
|---|---|---|---|
| SNEX | 155,784.4 | 15.2% | 3.7 |
| ICE | 10,558 | 4.8% | 7.2 |
| STT | 15,023 | -2.8% | 11.4 |
| NDAQ | 5,614 | 14.9% | 3.4 |
| IBKR | 6,835 | 26.3% | 2.6 |
| CME | 6,757.2 | 0.8% | 11.8 |
Source: Yahoo Finance
SNEX’s revenue growth of 15.2% TTM is ahead of ICE at 4.8%, STT at -2.8%, and CME at 0.8%, while it trails IBKR at 26.3%. I think that places StoneX in the faster-growth half of the group rather than the outright leader, and the 85.2% quarterly earnings growth figure supports that view.
Valuation
| Company | Trailing P/E | Forward P/E | EV/Revenue | EV/EBITDA | Price/Sales (TTM) | Price/Book (mrq) | Market Cap (USD Mil) | Forward EPS | Analyst Target Price – Low | Analyst Target Price – Mean | Analyst Target Price – High | # Analyst Opinions |
|---|---|---|---|---|---|---|---|---|---|---|---|---|
| SNEX | 19.1 | 14.9 | 0 | — | 0.1 | 3 | 8,488 | 4.7 | 75 | 75 | 75 | 1 |
| ICE | 22 | 17.9 | 10.2 | 16.1 | 8.4 | 3 | 88,363 | 8.8 | 163 | 187.3 | 232 | 14 |
| STT | 16.9 | 12.6 | — | — | 3.5 | 2.2 | 53,127 | 15.3 | 150 | 199.5 | 215 | 14 |
| NDAQ | 26.8 | 19.5 | 10.6 | 17.8 | 9.1 | 4.3 | 50,973 | 4.7 | 84 | 109.7 | 135 | 15 |
| IBKR | 35.4 | 28.7 | -4 | — | 22.8 | 7 | 155,678 | 3.2 | 70 | 105.7 | 121 | 13 |
| CME | 23.3 | 21.3 | 14.9 | 21.1 | 14.7 | 3.7 | 99,078 | 12.9 | 230 | 283.6 | 330 | 15 |
Source: Yahoo Finance
SNEX’s 19.1x trailing P/E and 14.9x forward P/E sit below ICE at 22.0x and 17.9x, but above STT at 16.9x and 12.6x. On a growth-adjusted basis, that is not obviously cheap because SNEX’s leverage is much higher than ICE’s and CME’s, so the market is not giving it a clear balance-sheet discount for the earnings it is producing.
Profitability
| Company | Operating Margin (TTM) | Net Margin (TTM) | Return on Assets (TTM) | Return on Equity (TTM) | Gross Margin (TTM) |
|---|---|---|---|---|---|
| SNEX | 0.4% | 0.3% | 1.2% | 21.9% | 1.7% |
| ICE | 52.6% | 38.2% | 2.2% | 14.1% | 100.0% |
| STT | 27.8% | 23.0% | 0.9% | 12.4% | 100.0% |
| NDAQ | 49.3% | 35.0% | 5.9% | 16.5% | 100.0% |
| IBKR | 76.5% | 16.5% | 2.3% | 24.0% | 93.0% |
| CME | 65.0% | 63.4% | 1.5% | 15.8% | 100.0% |
Source: Yahoo Finance
SNEX’s 0.4% operating margin and 0.3% net margin are far below ICE’s 52.6% and 38.2%, NDAQ’s 49.3% and 35.0%, and CME’s 65.0% and 63.4%. ROE at 21.9% is respectable, but it is not enough to offset the fact that the peer set converts a much larger share of revenue into profit.
Leverage
| Company | Total Debt/Equity % (mrq) | Current Ratio (mrq) | Total Debt (mrq, USD Mil) | Operating Cash Flow TTM (USD Mil) |
|---|---|---|---|---|
| SNEX | 823.5 | 1.1 | 23,419.5 | 3,857.9 |
| ICE | 69.2 | 1 | 20,527 | 5,514 |
| STT | — | — | — | 3,474 |
| NDAQ | 77.7 | 1 | 9,317 | 2,246 |
| IBKR | 205.7 | 1.1 | 45,779 | 15,915 |
| CME | 14.6 | 1 | 3,868.5 | 4,309 |
Source: Yahoo Finance
SNEX’s 823.5% debt/equity ratio is the highest in the group by a wide margin, versus IBKR at 205.7%, NDAQ at 77.7%, ICE at 69.2%, and CME at 14.6%. The offset is that SNEX also has $38.4B of cash, or $318.6 per share, but the absence of a reported net debt/EBITDA or free cash flow margin keeps the balance sheet harder to underwrite than ICE’s 2.9x net debt/EBITDA and 34.4% FCF margin or CME’s 0.3x and 43.0%.
Conclusion
I would put my rating as a Hold because StoneX is proving it can still grow and earn, but the leverage and thin margins keep the equity from looking like a clean Buy. The latest quarter showed $40.2B of revenue and $708.9M of EBITDA, which tells me the franchise is still active and profitable, yet the 823.5% debt/equity ratio means the upside is still tied to stable funding and steady market activity.
I would raise my rating more toward a Buy if quarterly revenue stays above $40B for the next two quarters, because that would confirm the current run rate is durable rather than a one-off trading spike, and if operating margin moves closer to 1.0%, meaning the company is converting more of that activity into earnings. A further step down in debt/equity would matter as well, because it would show management is using cash flow to reduce financial risk instead of simply rolling it forward.
I would move from Hold to Sell if revenue growth falls below 10.0% for two straight quarters, because that would tell me the trading and client-balance tailwinds are fading, and if operating margin slips back toward breakeven, meaning the earnings base is too thin to support the current valuation. I would also watch the current ratio: if it falls below 1.0x, the company would have less room to absorb margin calls or market shocks, and the leverage would start to look like a constraint rather than a feature.
Weighing both sides, I think the bull case is more likely to show up first because the business is still growing and the latest quarter already proved it can convert activity into earnings. Even so, I do not see enough evidence yet to call this a Buy, since the leverage and thin margins mean the next disappointment would hit the shares quickly.
What to Watch Next
- Quarterly revenue above $40B — would support a move toward Buy.
- Operating margin near 1.0% — would show better earnings conversion.
- Debt/equity trending down from 823.5% — would reduce financial risk.
- Current ratio staying above 1.0x — would preserve near-term liquidity.
- Revenue growth below 10.0% for two quarters — would argue for a lower rating.
What’s your take? I rated StoneX (SNEX) HOLD above — but the goal here is to get this right, not just to publish an opinion. What would you add to this analysis, or which risk or catalyst do you think I’m under- or over-weighting? Tell me in the comments.
Sources
- SEC 10-K Annual Report — filed 2024-11-29
- SEC 8-K Filing (2024-12-09)
- SEC 8-K Filing (2024-11-19)
- SEC 8-K Filing (2024-11-08)
- SEC 8-K Filing (2024-10-21)
- SEC 8-K Filing (2024-09-05)
- SEC 8-K Filing (2024-08-06)
- SEC Form 4 Insider Transaction (2026-05-26)
- SEC Form 4 Insider Transaction (2026-05-26)
- SEC Form 4 Insider Transaction (2026-05-20)
- SEC 10-K Annual Report — FY2024
- SEC 10-K Annual Report — FY2023
- SEC 10-K Annual Report — FY2022
- SEC 10-K Annual Report — FY2021
- SEC 10-K Annual Report — FY2020
Data sourced from Yahoo Finance and SEC EDGAR. Not investment advice.
Leave a Comment