
| Company | Aug 25 | Sep 25 | Oct 25 | Nov 25 | Dec 25 | Jan 26 | Feb 26 | Mar 26 | Apr 26 | May 26 | Jun 26 | Jul 26 | 12-Mo |
|---|---|---|---|---|---|---|---|---|---|---|---|---|---|
| TDC | +0% | +3% | -3% | +37% | +6% | -6% | +10% | -19% | +3% | +29% | +2% | -11% | +48% |
| NTAP | +8% | +5% | -0% | -5% | -4% | -10% | +3% | +3% | +9% | +57% | -11% | +16% | +74% |
| NTNX | -11% | +11% | -4% | -33% | +8% | -24% | -3% | -1% | +8% | +27% | -2% | +16% | -21% |
| MDB | +33% | -2% | +16% | -8% | +26% | -12% | -12% | -25% | +2% | +34% | +0% | +0% | +42% |
| SNOW | +7% | -5% | +22% | -9% | -13% | -12% | -13% | -10% | -10% | +87% | -0% | +15% | +31% |
| P | +30% | +8% | +18% | -10% | -25% | +4% | -8% | -8% | +21% | +11% | -1% | -2% | +30% |
Source: Yahoo Finance monthly adjusted close.
Quick Thesis
- Rated hold — cash-rich, but growth is still too uneven.
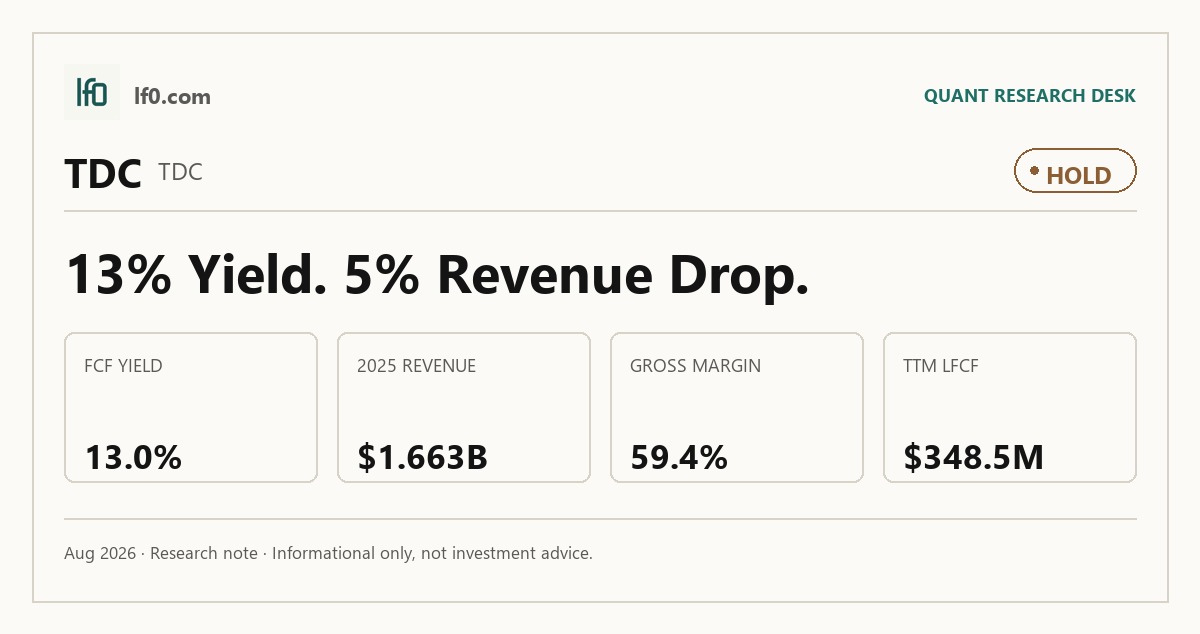
- Strongest point: $348.5M of levered free cash flow in TTM.
- Main risk: revenue slipped from $444M in Q1 2026 to $410M in Q2 2026.
- Valuation looks cheap at 6.1x trailing P/E and 1.4x EV/revenue.
- I would turn more constructive if Public Cloud ARR moves above $750M.
Executive Summary
Rating: HOLD | TDC
Measured from adjusted close on 2026-08-31 to 2026-10-20. Sell ratings are correct when the stock falls; Hold is tracked as a +/-10% range. Daily-close data, not intraday. Calls are tracked for 182 days from publication, then frozen as a final record.
I would put my rating as a Hold because Teradata is generating a 13.0% free cash flow yield and still has net cash, but the business has not yet proven to me that its cloud and AI mix can deliver steady top-line growth. The core strength is cash conversion: levered free cash flow was $348.5M in TTM, and total debt was only $99M in the most recent quarter, so the equity has real downside support. The main risk is execution, not balance-sheet stress, because quarterly revenue has been choppy and the Q1 2026 earnings spike did not hold into Q2 2026. I would move more toward a Buy if Public Cloud ARR climbs above $750M and total ARR moves above $1.6B, because that would show the recurring base is still compounding rather than flattening.
Company Profile
Teradata Corporation develops enterprise data and analytics software and related consulting services for customers running AI and analytics workloads across public cloud, private cloud, on-premises, and hybrid environments. It operates through Product Sales and Consulting Services, with revenue tied to software subscriptions, cloud usage, and implementation work. The company is headquartered in San Diego, was founded in 1979, and has shifted toward an AI and knowledge platform with more than 150 AI engagements in 2025. Teradata is listed on the NYSE under TDC and has a global operating footprint, with 40 facilities in 29 countries and roughly 38 countries represented in its workforce.
Economic Moat
Business Model
Teradata’s most defensible asset is its workload-management and query-optimization stack, which I feel is hard for a competitor to replicate quickly because it has been built over decades around complex enterprise workloads. The platform is designed to run across AWS, Microsoft Azure, Google Cloud, private cloud, and hybrid environments, and that deployment flexibility matters because it keeps the software embedded in customers’ data estates rather than tied to one cloud. QueryGrid, which moves and accesses data across multiple sources, and ClearScape Analytics, which integrates with third-party large language models and AI agents, deepen that stickiness. I also view the 534 U.S. patents and four exclusive licenses as supportive, but the moat is really the operating know-how behind the platform.
The business has also moved beyond legacy analytics into production AI use cases, which is important because it broadens the reasons customers keep Teradata in place. More than 150 AI engagements in 2025, plus products such as Teradata AI Factory, MCP Server, Teradata AgentBuilder, and Autonomous Customer Intelligence, suggest the company is trying to stay relevant in hybrid AI deployments rather than waiting for database refresh cycles alone. Partnerships with ServiceNow, Salesforce, and Fivetran should help distribution, and they make the platform feel more open than a closed stack.
Business & Operating Risks
The biggest disclosed risk is execution of the transformation itself. Teradata is still trying to develop, launch, scale, and operate cloud, hybrid, on-premises, and AI offerings across multiple environments while dealing with organizational alignment, technology integration, and skilled-personnel constraints. That risk is real, but in my view it threatens the pace of the transition more than the structural moat itself; the workload-management advantage remains intact, yet the company has not fully proven that it can monetize that advantage fast enough.
Customer renewal and pricing pressure are the second major risk. Customers can cancel after notice periods, some have already chosen competitors, and the IT market is seeing pricing pressure on support renewals. That matters because the business is increasingly subscription-based, so weaker renewals would hit both revenue and cash collection timing. Competition from AWS, Google Cloud, Microsoft Azure, Databricks, Snowflake, and open-source vendors adds another layer of pressure, since those rivals have greater financial resources and can compete directly for the same budgets.
The disclosed risks do not break the moat, but they do test whether Teradata can keep its hybrid deployment advantage while defending pricing and renewal rates.
Management Discussion & Analysis
Management is responding to those risks, but only partly. The company is leaning into recurring revenue, cloud mix, and buybacks, which helps offset the execution risk, yet the operating results still show that the transition is not fully complete. Total ARR rose to $1.522B in 2025 from $1.474B in 2024, and Public Cloud ARR increased to $701M from $609M, so the recurring base is still growing. At the same time, cloud net expansion rate slipped to 108% from 117%, which tells me the expansion engine is still healthy but less powerful than before.
The capital-allocation message is also clear: Teradata repurchased about 5.8 million shares at an average price of $24.34 in 2025 and authorized up to $500 million more on November 17, 2025. I read that as management choosing buybacks over balance-sheet repair, which is reasonable given the cash position, but it also means the company is not using the SAP settlement to de-risk the business further. The settlement itself should help, though, because the expected net proceeds of about $355M to $362 million before taxes improve flexibility and remove a legal overhang.
Recent Events
The February 19, 2026 SAP settlement is the most important recent event because it ends past and pending litigation and brings a gross payment of $480M within 60 days. In my view, the expected net proceeds strengthen the balance sheet and give management more room to support the stock, invest in the platform, or both.
A Cooperation Agreement with Lynrock Lake on February 10, 2026 expanded the board from nine to ten directors and added Melissa Fisher, an audit committee financial expert. That looks like a governance reset, and I think it matters because a software company still trying to prove execution discipline benefits from tighter oversight. The May 14, 2026 annual meeting then re-elected directors, approved say-on-pay, and supported the amended 2023 Stock Incentive Plan, which adds 6.3 million shares. That creates some dilution risk, but the larger signal is that shareholders are backing the current strategic direction while management gets the legal cash inflow and a refreshed board structure.
Financial Analysis
Growth
TDC — Financial Growth (Quarterly, USD Mil)
| Metric | 2025-06-30 | 2025-09-30 | 2025-12-31 | 2026-03-31 | 2026-06-30 |
|---|---|---|---|---|---|
| REVENUE (USD Mil) | 408 | 416 | 421 | 444 | 410 |
| EBIT (USD Mil) | 19 | 61 | 59 | 443 | 53 |
| EBITDA (USD Mil) | 42 | 85 | 82 | 468 | 76 |
| NET INCOME (USD Mil) | 9 | 40 | 37 | 335 | 46 |
| DILUTED EPS | 0.1 | 0.4 | 0.4 | 3.5 | 0.5 |
Source: Yahoo Finance — Quarterly Financial Statements
Revenue was $444M in Q1 2026, up 8.8% from $408M in Q2 2025, but the path was not smooth: revenue was $416M in Q3 2025, $421M in Q4 2025, and then $410M in Q2 2026. I do not read that as durable acceleration yet. The Q1 spike was real, but the pullback in Q2 2026 tells me the business still needs a cleaner recurring-growth engine before I would call it a step change.
The earnings swing was even sharper. EBIT reached $443M in Q1 2026 and EBITDA reached $468M, which is far above the normal run rate and does not line up cleanly with the rest of the year’s pattern. Because Q2 2026 EBITDA fell back to $76M, I would treat Q1 as an outlier until management explains what drove it. That disconnect matters for the thesis because the stock should not be valued on one quarter that does not appear repeatable.
Profitability
TDC — Profitability (TTM)
| Metric | TTM |
|---|---|
| Operating Margin (TTM) | 12.0% |
| Net Margin (TTM) | 27.1% |
| Return on Assets (TTM) | 9.3% |
| Return on Equity (TTM) | 119.1% |
| Gross Margin (TTM) | 61.3% |
| EBITDA Margin (TTM) | 20.5% |
Source: Yahoo Finance — Trailing Twelve Months (TTM)
TTM gross margin was 61.3%, EBITDA margin was 20.5%, operating margin was 12.0%, and net margin was 27.1%. The spread from gross to operating margin is wide, which tells me Teradata still carries a meaningful operating cost base even after gross profit is earned. Net margin sits above operating margin, so non-operating items are helping the bottom line, but I would not treat that as the core earnings power of the business.
Return on assets was 9.3% and return on equity was 119.1%. That gap suggests returns are being amplified by a light equity base rather than by extraordinary asset productivity. The profitability profile is constructive, but the next proof point I want is a sustained move in operating margin toward the mid-teens, because that would show the cost structure is finally scaling with revenue.
Valuation
TDC — Valuation Multiples
| Metric | Value |
|---|---|
| Market Cap (USD Mil) | 2,690 |
| Enterprise Value (USD Mil) | 2,361 |
| Trailing P/E | 6.1 |
| Forward P/E | 9.9 |
| Price/Sales (TTM) | 1.6 |
| Price/Book (mrq) | 4.6 |
| EV/Revenue | 1.4 |
| EV/EBITDA | 6.8 |
| Beta (5Y Monthly) | 0.59 |
| FCF Yield % (TTM) | 13.0% |
| Forward EPS (USD) | 2.9 |
| Analyst Target Price – Low (USD) | 27 |
| Analyst Target Price – Mean (USD) | 34 |
| Analyst Target Price – High (USD) | 49 |
| # Analyst Opinions | 8 |
Source: Yahoo Finance
Teradata screens as a cash-flow value name rather than a growth multiple story. FCF yield was 13.0% in TTM, which implies the market is paying about 7.7x levered free cash flow for a business converting 20.6% of revenue into free cash flow. Trailing P/E was 6.1x, forward P/E was 9.9x, EV/revenue was 1.4x, and EV/EBITDA was 6.8x, so the stock is priced for limited growth.
On my read, fair value sits in a range of roughly $27–$49 per share, which lines up with the analyst target range already in the data and brackets the current price without forcing a heroic assumption. That range is not a guarantee, but it is consistent with a business that has strong cash generation, modest leverage, and only low-single-digit revenue growth. The market is already giving some credit for the cash profile, yet I do not think it is fully paying for a sustained reacceleration.
Forward EPS is $2.91, which is reasonable against the current multiple but not rich relative to the peer set. On a like-for-like basis, the earnings trajectory here looks cheaper than the faster-growing software names because Teradata is not asking investors to pay a premium multiple for a premium growth rate. That is why I think the valuation is supportive, but not enough on its own to justify a more aggressive rating.
Leverage
TDC — Leverage & Coverage (Quarterly)
| Metric | Value |
|---|---|
| Total Debt/Equity % (mrq) | 16.7 |
| Current Ratio (mrq) | 0.9 |
| Total Debt (mrq, USD Mil) | 99 |
| Operating Cash Flow (TTM, USD Mil) | 761 |
| Levered Free Cash Flow (TTM, USD Mil) | 348.5 |
| Net Debt/EBITDA (TTM) | -0.9 |
| FCF Margin % (TTM) | 20.6% |
Source: Yahoo Finance — Quarterly Financial Statements
Teradata’s leverage is modest and its cash generation is strong. Total debt/equity was 16.7% in the most recent quarter, total debt was $99M, and total cash was $414M, so the company has net cash and no refinancing wall in sight. Operating cash flow was $761M in TTM and levered free cash flow was $348.5M, which shows the business is turning earnings into real cash.
The one caution is liquidity. Current ratio was 0.9, so short-term working-capital coverage is not abundant even though the balance sheet is net cash overall. I view that as a manageable constraint rather than a thesis breaker, because the cash flow profile is strong enough to absorb it.
Insider Activity
The insider transaction record is one-sided: 21 open-market sales for $9.4M and no open-market purchases in the 2025-02-12 to 2026-06-01 window. Selling was broad, with activity from the CEO, a director, and operating executives, so I do not read it as a one-off event. It is not a fatal signal, but it does tell me management is not leaning in with personal capital at current levels.
Comparable Analysis
Growth
| Company | Revenue TTM (USD Mil) | Revenue Growth YoY % | Diluted EPS TTM |
|---|---|---|---|
| TDC | 1,691 | 0.5% | 4.8 |
| NTAP | 6,925 | 12.5% | 6.3 |
| NTNX | 2,853.5 | 15.9% | 5.2 |
| MDB | 2,602.4 | 25.2% | -0.4 |
| SNOW | 5,032.8 | 33.5% | -3.5 |
| P | 4,262.1 | — | 0.7 |
Source: Yahoo Finance
Teradata’s revenue growth is the weakest in the peer set at 0.5% TTM, versus 12.5% for NTAP, 15.9% for NTNX, 25.2% for MDB, and 33.5% for SNOW. P is also ahead on scale, even though its growth print is not shown. That gap matters because Teradata is not being valued as a growth leader, so any premium has to come from cash generation and balance-sheet quality.
Valuation
| Company | Trailing P/E | Forward P/E | EV/Revenue | EV/EBITDA | Price/Sales (TTM) | Price/Book (mrq) | Market Cap (USD Mil) | Enterprise Value (USD Mil) | Beta (5Y Monthly) | FCF Yield % (TTM) | Forward EPS | Analyst Target Price – Low | Analyst Target Price – Mean | Analyst Target Price – High | # Analyst Opinions |
|---|---|---|---|---|---|---|---|---|---|---|---|---|---|---|---|
| TDC | 6.1 | 9.9 | 1.4 | 6.8 | 1.6 | 4.6 | 2,690 | 2,361 | 0.59 | 13.0% | 2.9 | 27 | 34 | 49 | 8 |
| NTAP | 29.3 | 18.5 | 5.2 | 19 | 5.3 | 27 | 36,484 | 35,790 | 1.43 | 3.5% | 10 | 150 | 187.6 | 210 | 16 |
| NTNX | 13.2 | 25.7 | 6.3 | 46.2 | 6.5 | 26.3 | 18,453 | 17,870 | 0.60 | 4.0% | 2.7 | 59.7 | 74.6 | 85 | 14 |
| MDB | — | 60.8 | 12.9 | -418.9 | 13.8 | 12.3 | 35,923 | 33,554 | 1.54 | 1.4% | 7.3 | 272.6 | 441.7 | 560 | 37 |
| SNOW | — | 120.6 | 22.6 | -100.7 | 22.5 | 58.3 | 113,172 | 113,502 | 1.31 | 1.5% | 2.7 | 110 | 327.9 | 500 | 48 |
| P | 126.2 | 26 | 7.2 | 79.5 | 7.2 | 21.1 | 30,631 | 30,542 | 1.41 | -0.4% | 3.5 | 80 | 130.5 | 170 | 19 |
Source: Yahoo Finance
Teradata trades at 1.4x EV/revenue, 1.6x price/sales, and 13.0% FCF yield, which is far cheaper than NTAP at 5.2x EV/revenue and 3.5% FCF yield, NTNX at 6.3x and 4.0%, MDB at 12.9x and 1.4%, SNOW at 22.6x and 1.5%, and P at 7.2x and -0.4%. That discount is not just a headline multiple gap; it reflects the fact that Teradata’s growth is much slower, so the market is paying for cash today rather than for a faster future. On a growth-adjusted basis, I think Teradata still looks inexpensive, but the discount is justified unless growth improves.
Profitability
| Company | Operating Margin (TTM) | Net Margin (TTM) | Return on Assets (TTM) | Return on Equity (TTM) | Gross Margin (TTM) | EBITDA Margin (TTM) |
|---|---|---|---|---|---|---|
| TDC | 12.0% | 27.1% | 9.3% | 119.1% | 61.3% | 20.5% |
| NTAP | 27.3% | 18.4% | 9.8% | 106.7% | 70.7% | 27.2% |
| NTNX | 13.6% | 52.8% | 4.7% | 37,460.2% | 86.9% | 13.6% |
| MDB | -3.6% | -1.1% | -1.8% | -1.0% | 72.0% | -3.1% |
| SNOW | -22.2% | -23.8% | -9.7% | -54.9% | 67.2% | -22.4% |
| P | -18.5% | 5.9% | 3.0% | 17.7% | 69.7% | 9.0% |
Source: Yahoo Finance
Teradata’s 12.0% operating margin and 20.5% EBITDA margin trail NTAP’s 27.3% and 27.2%, but they are well ahead of MDB, SNOW, and P on operating profitability. Gross margin at 61.3% is below NTAP’s 70.7% and MDB’s 72.0%, which tells me the gap is not only opex scale; the business also gives up some margin at the gross-profit line. ROE of 119.1% and ROA of 9.3% are strong, though the ROE is amplified by a light equity base.
Leverage
| Company | Total Debt/Equity % (mrq) | Current Ratio (mrq) | Total Debt (mrq, USD Mil) | Operating Cash Flow TTM (USD Mil) | Free Cash Flow TTM (USD Mil) | Net Debt/EBITDA (TTM) | FCF Margin % (TTM) |
|---|---|---|---|---|---|---|---|
| TDC | 16.7 | 0.9 | 99 | 761 | 348.5 | -0.9 | 20.6% |
| NTAP | 202.3 | 1.4 | 2,733 | 2,067 | 1,295.2 | -0.5 | 18.7% |
| NTNX | 216.2 | 1.8 | 1,518.7 | 916.7 | 746.3 | -2.2 | 26.2% |
| MDB | 2 | 4.9 | 58.6 | 596.9 | 517.6 | 29.6 | 19.9% |
| SNOW | 142.9 | 1.1 | 2,772.1 | 1,236.8 | 1,739.5 | 0.2 | 34.6% |
| P | 127.4 | 1.5 | 911.2 | 427.8 | -115.8 | -0.8 | -2.7% |
Source: Yahoo Finance
Teradata’s 16.7% debt/equity and -0.9x net debt/EBITDA are much cleaner than NTAP’s 202.3% and -0.5x, SNOW’s 142.9% and 0.2x, and P’s 127.4% and -0.8x. The current ratio of 0.9 is weaker than NTAP’s 1.4 and NTNX’s 1.8, but the company’s $348.5M of levered free cash flow and $414M of cash make that less concerning than it would be for a lower-cash business. In other words, the balance sheet helps explain why Teradata can trade at a lower multiple than peers even though the operating margin gap is not huge.
Conclusion
I would put my rating as a Hold because the key tension is no longer whether Teradata can generate cash — it clearly can — but whether that cash generation is enough to offset uneven growth and a quarter-to-quarter earnings pattern that still looks unstable. The stock is cheap on 13.0% FCF yield and 1.4x EV/revenue, and the SAP settlement plus buyback authorization improve flexibility, but the Q1 2026 spike did not carry through into Q2 2026, so I do not yet see proof that the operating inflection is durable.
I would raise my rating more toward a Buy if Public Cloud ARR moves above $750M and total ARR gets above $1.6B, because that would tell me the recurring base is still compounding after 2025 and the cloud mix is finally translating into steadier growth. If that happens alongside revenue returning to a sustained positive growth rate and operating margin moving into the mid-teens, the current cash yield would likely look too low for the earnings power being created.
I would move from Hold toward Sell if Public Cloud ARR slips back below $650M or if FCF margin falls materially below 20%, because that would mean the current cash return is not durable and the valuation support would weaken quickly. A second bear trigger would be another renewal or pricing miss that pushes revenue back into decline while insider selling stays broad, since that would make the low multiple look more like a warning than an opportunity.
Weighing both sides, I still think the balance sheet and cash conversion are real enough to keep the stock from being a Sell, but the growth evidence is not strong enough for me to call it a Buy. The next few quarters should tell us whether the SAP proceeds and cloud mix can turn into a cleaner operating trend, and that is the main thing I would watch.
What to Watch Next
- Public Cloud ARR above $750M — would support a move toward Buy.
- Total ARR above $1.6B — would confirm the recurring base is still compounding.
- FCF margin below 20% — would weaken the cash-support case.
- Revenue growth turning sustainably positive — would strengthen the re-rating case.
- Operating margin moving into the mid-teens — would show the cost base is scaling.
What’s your take? I rated Teradata (TDC) HOLD above — but the goal here is to get this right, not just to publish an opinion. What would you add to this analysis, or which risk or catalyst do you think I’m under- or over-weighting? Tell me in the comments.
Sources
- SEC 10-K Annual Report — filed 2026-02-27
- SEC 8-K Filing (2026-05-19)
- SEC 8-K Filing (2026-05-05)
- SEC 8-K Filing (2026-03-02)
- SEC 8-K Filing (2026-02-23)
- SEC 8-K Filing (2026-02-11)
- SEC 8-K Filing (2026-02-10)
- SEC Form 4 Insider Transaction (2026-06-02)
- SEC Form 4 Insider Transaction (2026-05-26)
- SEC Form 4 Insider Transaction (2026-05-20)
Data sourced from Yahoo Finance and SEC EDGAR. Not investment advice.
Leave a Comment