
| Company | Aug 25 | Sep 25 | Oct 25 | Nov 25 | Dec 25 | Jan 26 | Feb 26 | Mar 26 | Apr 26 | May 26 | Jun 26 | Jul 26 | 12-Mo |
|---|---|---|---|---|---|---|---|---|---|---|---|---|---|
| WSM | +1% | +4% | -0% | -7% | -1% | +15% | +0% | -11% | -0% | +12% | +15% | -2% | +24% |
| RH | +10% | -10% | -15% | -9% | +14% | +11% | -17% | -16% | -6% | +13% | +11% | +0% | -20% |
| W | +14% | +20% | +16% | +7% | -9% | +3% | -26% | -1% | -15% | +13% | +28% | -8% | +29% |
| FND | +7% | -10% | -15% | +2% | -4% | +8% | +5% | -26% | -5% | +6% | +15% | -3% | -25% |
| TJX | +10% | +6% | -3% | +9% | +1% | -2% | +8% | -1% | -2% | -1% | -2% | +4% | +28% |
| ETSY | -9% | +25% | -7% | -13% | +2% | -4% | +4% | -9% | +29% | +6% | +11% | +8% | +40% |
Source: Yahoo Finance monthly adjusted close.
Quick Thesis
- Rated hold because valuation already prices in Williams-Sonoma’s quality.
- Best strength: 17.3% TTM operating margin and 13.4% FCF margin.
- Main risk: demand softness, with Q1 2026 revenue down 6.8% year over year.
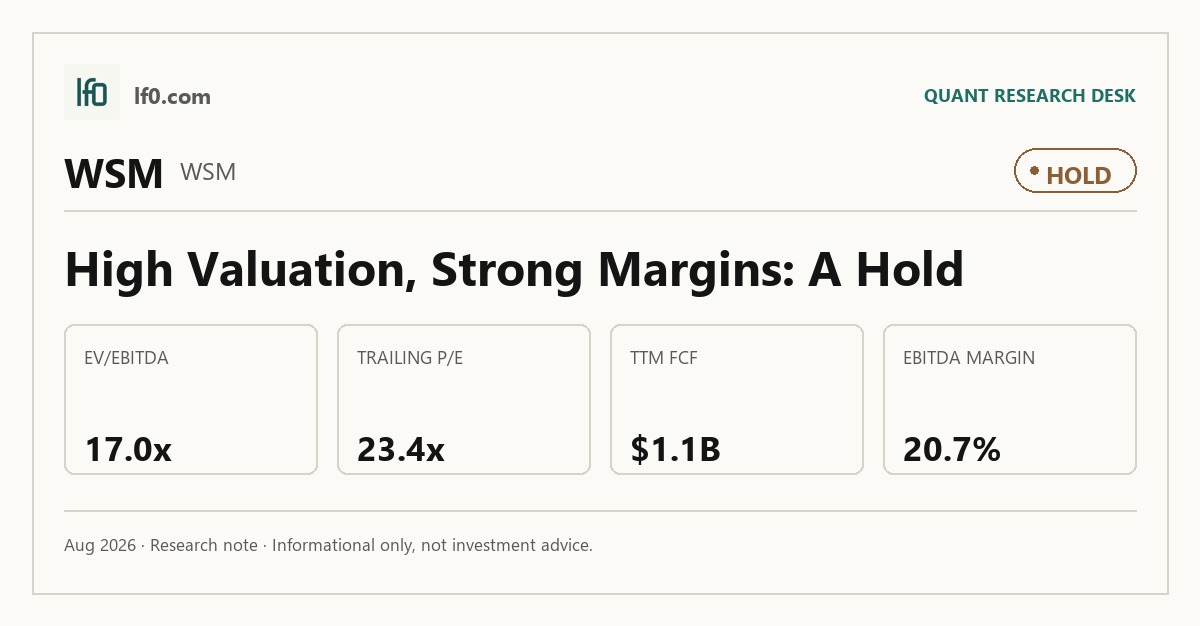
- Valuation is rich at 17.0x EV/EBITDA and 23.3x trailing P/E.
- I would turn more constructive if revenue stays above Q1 2026 and gross margin holds near 45.7%.
Executive Summary
Rating: HOLD | WSM
Measured from adjusted close on 2026-08-31 to 2026-10-20. Sell ratings are correct when the stock falls; Hold is tracked as a +/-10% range. Daily-close data, not intraday. Calls are tracked for 182 days from publication, then frozen as a final record.
I would put my rating as a Hold because Williams-Sonoma’s margin quality is already reflected in the stock, while the latest growth profile is good but not strong enough to justify a clear rerating. In my view, the key strength is that the business still converts 20.7% EBITDA margins into 13.4% FCF margins, which supports buybacks and dividends even in a slower housing backdrop. The key risk is that Q1 2026 revenue fell 6.8% year over year to $1.8B, so the market is paying for earnings quality even as demand softens. I would raise my rating more towards a Buy if fiscal 2026 revenue growth holds above 5.0%, meaning the business is sustaining a mid-single-digit run rate rather than just benefiting from a holiday quarter, and if gross margin stays near 45.0% while operating margin remains above 17.0%.
Company Profile
Williams-Sonoma, Inc. was founded in 1956 and incorporated in 1973. It is an omni-channel specialty retailer of home products, selling through e-commerce, direct-mail catalogs, retail stores and business-to-business channels under Williams Sonoma, Pottery Barn, Pottery Barn Kids, Pottery Barn Teen, West Elm, Williams Sonoma Home, Rejuvenation, Mark and Graham and GreenRow. As of February 1, 2026, it operated 506 stores, including 473 in the U.S. and 33 abroad, plus 90 franchised locations in Mexico, South Korea, India and the Philippines. It also manufactures upholstered furniture and lighting in Mississippi, North Carolina and Oregon, which gives the company more control over product flow than a pure reseller model.
Economic Moat
Business Model
The in-house design capabilities and vertically integrated sourcing organization are the hardest pieces of Williams-Sonoma’s model to copy within 3 years, because they let the company deliver differentiated products at competitive prices while controlling product flow across a broad home assortment. I feel that this is more defensible than a pure retail format advantage because it is embedded in product development, sourcing and manufacturing, not just store count or web traffic. The omni-channel system adds a second layer of support: 506 stores and 90 franchised locations give the brands physical reach, and the stores function as design centers and fulfillment hubs. Key Rewards also ties together the brand portfolio and a unified customer file, which should lift repeat purchase frequency and make customer acquisition more efficient.
Business & Operating Risks
The biggest disclosed risk is demand softness in home furnishings and kitchen products, because the 2026 10-K points to inflationary pressure, elevated interest rates, housing conditions and consumer debt levels. That risk is broad, but it does not directly break the sourcing and design moat; it mainly tests whether the company can keep converting that advantage into sales when the consumer weakens. Inventory and fulfillment are the next pressure point, since merchandise is sourced up to twelve months and multiple seasons in advance while shipping routes have been disrupted by Middle East instability and Panama Canal delays. Digital execution and data security are also material because a large share of revenue now depends on e-commerce traffic, customer data and platform algorithms. The disclosed risks are testing the moat, but they are not yet threatening the core design-and-sourcing advantage itself.
Management Discussion & Analysis
Management is responding to those risks with liquidity, pricing discipline and shareholder returns rather than a defensive retrenchment. The $600M revolving credit facility, extended to June 26, 2030, sits behind $1B of cash and no revolver borrowings, so the balance sheet is being used as a backstop rather than a funding source. The 15% quarterly dividend increase to $0.76 per share in March 2026, alongside $854.0 million of repurchases and $316.5 million of dividends in fiscal 2025, shows confidence in cash generation. At the same time, management is leaning on AI-enabled efficiencies, sourcing renegotiation and selective store investment to offset tariff pressure, and the tariff environment materially changed again in February 2026. The company is actively addressing the operating risks, but tariff refunds remain unresolved and that keeps the earnings setup from being fully de-risked.
Recent Events
The most important recent event was the March 2026 dividend increase, which tells me management is comfortable returning more cash after fiscal 2025 rather than hoarding liquidity. The May 2026 earnings release is routine on its face, but it matters because it confirms the company is still reporting through a period when capital returns have already been reset higher. Taken together, these events reinforce the moat thesis: the business is still generating enough cash to fund shareholder returns, even while the operating backdrop remains uneven.
Financial Analysis
Growth
WSM — Financial Growth (Quarterly, USD Mil)
| Metric | 2025-04-30 | 2025-07-31 | 2025-10-31 | 2026-01-31 | 2026-04-30 |
|---|---|---|---|---|---|
| REVENUE (USD Mil) | 1,730.1 | 1,836.8 | 1,882.8 | 2,357.1 | 1,805.5 |
| EBIT (USD Mil) | 290.7 | 328.1 | 319.1 | 477.8 | 291.7 |
| EBITDA (USD Mil) | 347.1 | 384.8 | 376.7 | 538.6 | 347.8 |
| NET INCOME (USD Mil) | 231.3 | 247.6 | 241.6 | 368 | 231.4 |
| DILUTED EPS | 1.9 | 2 | 2 | 3 | 1.9 |
Source: Yahoo Finance — Quarterly Financial Statements
Revenue was $1.8B in Q1 2026, up 36.2% year over year from $1.7B, and that rebound was strong enough to pull EBIT to $477.8M and EBITDA to $538.6M. The prior quarters were steadier, with revenue between $1.8B and $1.9B, so the Q1 spike looks more like a seasonal lift than a new run rate. That matters for the thesis because the company’s moat is supposed to show up in consistent demand and margin resilience, not just one strong quarter. I would not extrapolate the Q1 pace too far, but it does show the model can still produce leverage when demand is there.
Profitability
WSM — Profitability (TTM)
| Metric | TTM |
|---|---|
| Operating Margin (TTM) | 17.3% |
| Net Margin (TTM) | 14.7% |
| Return on Assets (TTM) | 16.6% |
| Return on Equity (TTM) | 55.0% |
| Gross Margin (TTM) | 45.7% |
| EBITDA Margin (TTM) | 20.7% |
Source: Yahoo Finance — Trailing Twelve Months (TTM)
TTM operating margin was 17.3%, net margin was 14.7%, gross margin was 45.7% and EBITDA margin was 20.7%. The 28.4-point gap between gross margin and operating margin shows that Williams-Sonoma still carries a heavy operating expense load, so investors should watch whether scale and cost control keep narrowing that spread rather than relying on product gross profit alone. Return on assets was 16.6% and return on equity was 55.0%, which tells me the business is generating strong returns on capital, although leverage amplifies the equity figure. Profitability is the clearest confirmation of the moat described above: the sourcing and brand model is still translating into returns that most specialty retailers do not match.
Valuation
WSM — Valuation Multiples
| Metric | Value |
|---|---|
| Market Cap (USD Mil) | 26,838 |
| Enterprise Value (USD Mil) | 28,188 |
| Trailing P/E | 23.3 |
| Price/Sales (TTM) | 3.4 |
| Price/Book (mrq) | 14.4 |
| EV/Revenue | 3.5 |
| EV/EBITDA | 17 |
| Beta (5Y Monthly) | 1.47 |
| FCF Yield % (TTM) | 4.0% |
| Forward EPS (USD) | 10.5 |
| Analyst Target Price – Mean (USD) | 247.4 |
| Analyst Target Price – High (USD) | 280 |
| # Analyst Opinions | 20 |
Source: Yahoo Finance
Williams-Sonoma trades at 17.0x EV/EBITDA, 23.3x trailing P/E and 3.5x EV/revenue, which is demanding for a mature retailer growing at a mid-single-digit pace. FCF yield is 4.0% and forward EPS is $10.5, so the stock is priced for quality rather than for a cyclical rebound. On the analysis here, I would put fair value in a range of roughly $210-$240 per share, which sits around the analyst mean target of $247.4 but below the high end of $280; that tells me the market already gives the company credit for durable margins, but not for a major growth reacceleration. My own EPS view is about $10.0-$11.0, which is close to the company’s forward EPS and implies the stock is not cheap relative to peers on a like-for-like earnings basis. The valuation case is tied to leverage as well: with net debt/EBITDA at just 0.3x, the premium is not about balance-sheet risk, it is about paying up for earnings quality.
Leverage
WSM — Leverage & Coverage (Quarterly)
| Metric | Value |
|---|---|
| Total Debt/Equity % (mrq) | 71.4 |
| Current Ratio (mrq) | 1.4 |
| Net Debt/EBITDA (TTM) | 0.3 |
| FCF Margin % (TTM) | 13.4% |
Source: Yahoo Finance — Quarterly Financial Statements
Total debt/equity was 71.4%, current ratio was 1.4 and total debt was $1.5B, while operating cash flow was $1.6B TTM and levered free cash flow was $1.1B TTM. Net debt/EBITDA was 0.3x and FCF margin was 13.4%, which tells me EBITDA is converting into real cash rather than being trapped in working capital or capex. That is a strong support for the thesis, but it also means the stock is not a balance-sheet repair story; the upside has to come from growth and margin durability. In my view, refinancing risk is low, and the main watch item is whether tariffs or a weaker consumer start to erode that cash cushion.
Insider Activity
The insider transaction record is one-sided: the table shows repeated open-market sales by Laura Alber and Jeffrey Howie, with no open-market purchases. I would not overread the raw count in the table, but the direction is still clear enough to say alignment looks weak at the margin. That does not break the thesis, yet it is another reason I do not want to pay a premium multiple without stronger evidence of sustained growth.
Comparable Analysis
Growth
| Company | Revenue TTM (USD Mil) | Revenue Growth YoY % | Diluted EPS TTM |
|---|---|---|---|
| WSM | 8,005.2 | 6.7% | 9.8 |
| RH | 3,425.9 | -1.7% | 5.2 |
| W | 12,904 | 7.5% | -2.5 |
| FND | 4,711.8 | 3.0% | 2.1 |
| TJX | 62,363 | 5.4% | 5.4 |
| ETSY | 2,941.8 | 6.2% | 3.2 |
Source: Yahoo Finance
WSM’s revenue grew 6.7% TTM, ahead of RH at -1.7% and FND at 3.0%, but just behind W at 7.5% and slightly above TJX at 5.4% and ETSY at 6.2%. That puts WSM in the middle of the group, so its growth profile is real but not dominant enough to justify a large valuation gap on growth alone.
Valuation
| Company | Trailing P/E | Forward P/E | EV/Revenue | EV/EBITDA | Price/Sales (TTM) | Price/Book (mrq) | Beta (5Y Monthly) | FCF Yield % (TTM) | Forward EPS | Analyst Target Price – Low | Analyst Target Price – Mean | Analyst Target Price – High | # Analyst Opinions |
|---|---|---|---|---|---|---|---|---|---|---|---|---|---|
| WSM | 23.3 | 21.7 | 3.5 | 17 | 3.4 | 14.4 | 1.47 | 4.0% | 10.5 | 138 | 247.4 | 280 | 20 |
| RH | 28.7 | 16.4 | 2 | 13.8 | 0.8 | 49.4 | 1.87 | 10.1% | 9.1 | 90 | 178.1 | 270 | 17 |
| W | — | 25.5 | 1.3 | 46.9 | 1 | — | 2.98 | 3.5% | 3.9 | 83 | 123.3 | 156 | 29 |
| FND | 24 | 23.3 | 1.6 | 15 | 1.2 | 2.2 | 1.57 | 2.6% | 2.2 | 38 | 58.6 | 75 | 22 |
| TJX | 24.8 | 23.3 | 2.6 | 17.9 | 2.4 | 14.3 | 0.62 | 3.0% | 5.8 | 125 | 170.4 | 198 | 20 |
| ETSY | 25.9 | 11.9 | 3.3 | 20.4 | 2.6 | -5.4 | 1.82 | 2.3% | 6.9 | 58 | 87 | 105 | 26 |
Source: Yahoo Finance
WSM trades at 3.5x EV/revenue and 17.0x EV/EBITDA, versus RH at 2.0x and 13.8x, W at 1.3x and 46.9x, FND at 1.6x and 15.0x, TJX at 2.6x and 17.9x, and ETSY at 3.3x and 20.4x. Using peer EV/revenue as a rough guide, WSM screens richer than W and FND but close to ETSY, which fits a company with better margins than most of the group. A $1 investment a year ago would be worth $1.24 in WSM, versus $1.62 in ETSY, $1.34 in W, $1.28 in TJX, $0.67 in RH and $0.75 in FND, so the market has rewarded consistency more than raw growth.
Profitability
| Company | Operating Margin (TTM) | Net Margin (TTM) | Return on Assets (TTM) | Return on Equity (TTM) | Gross Margin (TTM) | EBITDA Margin (TTM) |
|---|---|---|---|---|---|---|
| WSM | 17.3% | 14.7% | 16.6% | 55.0% | 45.7% | 20.7% |
| RH | 0.3% | 3.0% | 4.4% | — | 43.5% | 14.3% |
| W | 3.0% | -2.5% | 5.3% | — | 30.3% | 2.7% |
| FND | 5.4% | 4.9% | 2.7% | 9.7% | 45.0% | 10.4% |
| TJX | 10.9% | 9.7% | 13.5% | 62.2% | 31.5% | 14.3% |
| ETSY | 18.7% | 7.1% | 10.5% | — | 71.4% | 16.0% |
Source: Yahoo Finance
WSM’s 17.3% operating margin, 14.7% net margin, 45.7% gross margin and 20.7% EBITDA margin all exceed RH’s 0.3%, 3.0%, 43.5% and 14.3%, while also topping FND’s 5.4%, 4.9%, 45.0% and 10.4% and TJX’s 10.9%, 9.7%, 31.5% and 14.3%. The gap is mostly structural and scale driven, not a one-quarter anomaly, because WSM’s gross margin advantage over TJX is 14.2 points while its operating margin advantage is 6.4 points.
Leverage
| Company | Total Debt/Equity % (mrq) | Current Ratio (mrq) | Net Debt/EBITDA (TTM) | FCF Margin % (TTM) |
|---|---|---|---|---|
| WSM | 71.4 | 1.4 | 0.3 | 13.4% |
| RH | 7,060.1 | 1.1 | 8.1 | 8.3% |
| W | — | 0.7 | 6.7 | 3.6% |
| FND | 80.6 | 1.3 | 3.5 | 3.0% |
| TJX | 134.4 | 1.1 | 0.9 | 7.0% |
| ETSY | — | 1.5 | 4.1 | 5.8% |
Source: Yahoo Finance
WSM’s 71.4% debt/equity and 0.3x net debt/EBITDA are far lighter than RH’s 7,060.1% debt/equity and 8.1x net debt/EBITDA, and also below FND’s 80.6% and 3.5x, ETSY’s 4.1x and TJX’s 0.9x. That said, WSM’s 13.4% FCF margin and $1.1B of TTM free cash flow show the balance sheet is a support, not the main thesis, which means investors are paying for earnings quality rather than financial engineering.
Conclusion
I would put my rating as a Hold because the company’s moat is real, but the stock already prices in most of the quality. The key tension is that Williams-Sonoma still posts 17.3% operating margin and 13.4% FCF margin, yet Q1 2026 revenue was only $1.8B and the latest growth burst looks seasonal rather than structural. That is why I am not moving more bullish today: the earnings base is strong, but the market is already paying for that strength.
I would raise my rating more towards a Buy if fiscal 2026 revenue growth stays above 5.0%, meaning the business is sustaining a mid-single-digit run rate rather than just benefiting from a holiday quarter, and if gross margin remains near 45.0% while operating margin stays above 17.0%, which would show tariff pressure is not eroding the earnings base. I would move from Hold to Sell if revenue growth slips below 2.0% for two consecutive quarters, because that would tell me the Q1 2026 rebound was seasonal rather than structural, or if operating margin falls below 16.0%, which would mean tariff and freight pressure are finally overwhelming the sourcing advantage. A drop in FCF margin toward 11.0% would matter as well, because it would show the cash conversion investors are paying for is starting to leak.
Weighing both cases, I lean cautious because the bull scenario needs continued execution while the bear case only needs a modest slowdown in a mature retail category. The stock is good, but at this valuation I do not see enough evidence that the next 12 months will produce the kind of earnings surprise that would justify paying up further.
What to Watch Next
- Fiscal 2026 revenue growth above 5.0% — would support moving the rating toward Buy.
- Gross margin near 45.0% — would show tariff pressure is not eroding the model.
- Operating margin above 17.0% — would confirm earnings quality is holding.
- Revenue growth below 2.0% for two quarters — would support moving the rating toward Sell.
- FCF margin near 11.0% — would signal cash conversion is weakening.
What’s your take? I rated Williams-Sonoma (WSM) HOLD above — but the goal here is to get this right, not just to publish an opinion. What would you add to this analysis, or which risk or catalyst do you think I’m under- or over-weighting? Tell me in the comments.
Sources
- SEC 10-K Annual Report — filed 2026-03-26
- SEC 8-K Filing (2026-05-21)
- SEC 8-K Filing (2026-03-18)
- SEC Form 4 Insider Transaction (2026-05-29)
- SEC Form 4 Insider Transaction (2026-05-18)
- SEC Form 4 Insider Transaction (2026-05-06)
- SEC 10-K Annual Report — FY2026
- SEC 10-K Annual Report — FY2025
- SEC 10-K Annual Report — FY2024
- SEC 10-K Annual Report — FY2023
- SEC 10-K Annual Report — FY2022
Data sourced from Yahoo Finance and SEC EDGAR. Not investment advice.
Leave a Comment