
Executive Summary
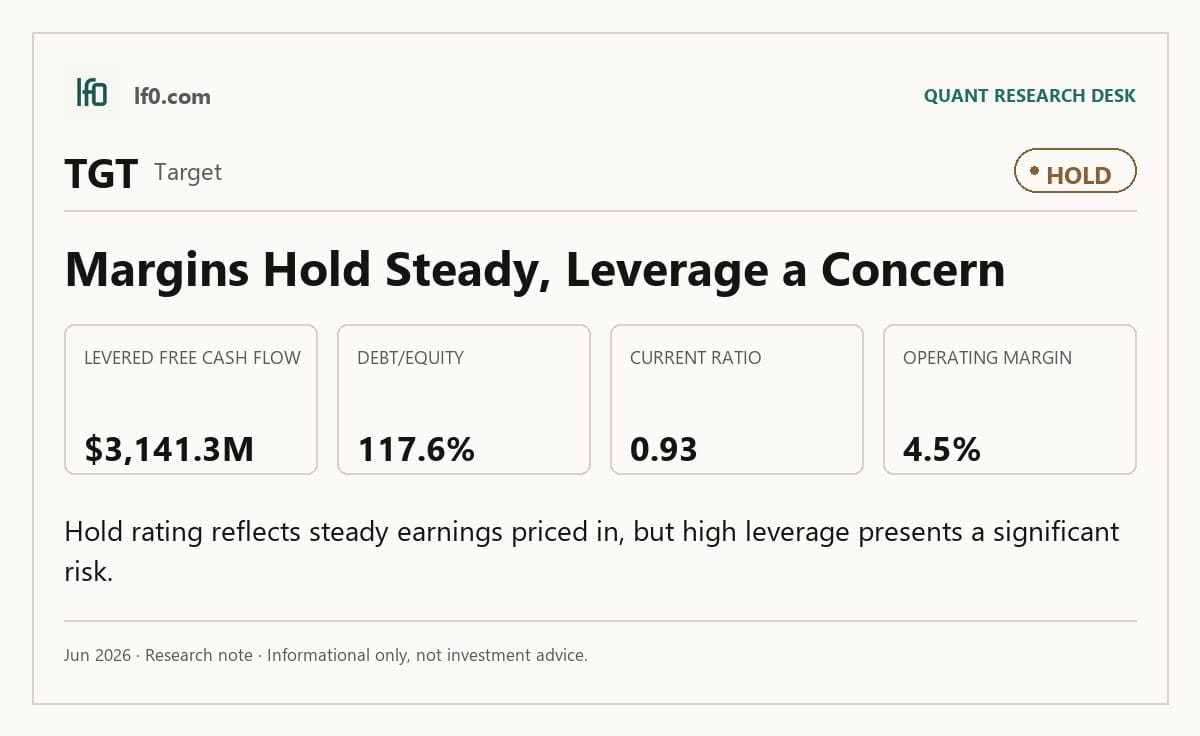
Rating: HOLD | TGT
Measured from adjusted close on 2026-07-13 to 2026-09-25. Sell ratings are correct when the stock falls; Hold is tracked as a +/-10% range. Daily-close data, not intraday. Calls are tracked for 182 days from publication, then frozen as a final record.
I would put my rating as a Hold because Target is generating solid cash, but the earnings base is still too uneven to justify a more aggressive stance. TTM levered free cash flow was $3.1B and FCF yield was 5.2%, which gives the stock real support, yet Q1 2026 diluted EPS fell to $1.7 from $2.3 a year earlier and operating margin was only 4.5% TTM, so the business is still proving that it can convert sales into durable profit. I would raise my rating more towards a Buy if operating margin moved above 5.0%, meaning the company is clearly reclaiming more of each sales dollar, and if quarterly earnings growth turned positive for two straight quarters, which would show that the cost base is finally absorbing traffic and tariff pressure.
Company Profile
Target Corporation was incorporated in Minnesota in 1902 and is listed on the New York Stock Exchange under TGT. It operates as a single retail segment, selling merchandise and everyday essentials through stores and digital channels, with most revenue from merchandise sales and smaller streams from advertising, Target Plus marketplace activity, and credit card profit sharing. Stores are central to fulfillment: they handled more than 97% of merchandise sales in each of the last 3 years. The company runs roughly 1,980 stores in the U.S., and its larger stores above 170,000 square feet often include full grocery assortments. Target also sources merchandise through offices in 13 countries and employs about 415,000 team members as of January 31, 2026.
Economic Moat
Business Model
Stores acting as fulfillment hubs are the most defensible part of Target’s model, because more than 97.0% of merchandise sales were fulfilled through stores in each of the last 3 years, according to their SEC filings. I feel this is hard to replicate within 3 years because it combines dense physical coverage, same-day options like Order Pickup, Drive Up, and Same Day Delivery, and lower fulfillment cost in one network. A secondary moat element is the roughly 30.0% share of merchandise sales from owned and exclusive brands, which supports differentiation and higher margins. Target Plus, Roundel, and the CVS operating agreement add useful adjacency, but they are supporting pieces rather than the core structural edge.
Business & Operating Risks
Consumer demand misforecasting is a high-severity risk because Target says it has “not always” been able to predict demand accurately, which has already led to “insufficient or excess inventory,” “increased inventory markdowns,” and higher storage, transportation, and labor costs. For a retailer with about 30% of merchandise sales tied to owned and exclusive brands, a forecasting miss can hit both sales and margin at the same time, so the damage is not just slower growth but lower gross profit.
Tariffs and trade policy are a high-severity risk. Approximately one-half of merchandise is sourced directly or indirectly from outside the U.S., with China as the single largest source, and tariffs on China, India, Vietnam, and Bangladesh have already raised procurement costs and may force price increases. The February 2026 Supreme Court ruling on IEEPA tariffs and the uncertainty around refund timing add another layer of margin risk.
Cybersecurity and data privacy are a high-severity risk because Target has already experienced a prominent data breach, and the filing warns that another significant incident could disrupt operations, trigger government enforcement and private litigation, and push guests away from Target-branded payment cards or loyalty programs.
Labor and workforce management is a medium-severity risk. With over 400,000 team members, workforce costs are Target’s largest operating expense, and the filing flags turnover, wage pressure, and the need to retrain for automation and AI as direct threats to operating efficiency.
Management Discussion & Analysis
Management is signaling that capital allocation is still being directed first to the core store base and operating model, not to buybacks: $5B capital expenditures are set for 2026, with roughly 30 new stores and continued spending on remodels, supply chain, and technology. That tells me the company is prioritizing traffic, fulfillment speed, and long-term productivity over near-term earnings support. The $1B 364-day unsecured revolving credit facility due in October 2026, alongside the $3B revolver due in October 2028, keeps liquidity flexible and pushes refinancing risk out, so the balance sheet is not the immediate constraint. Management also plans to keep paying the dividend, which rose 1.8% per share to $4.52 in 2025, and only return excess cash through repurchases within credit-rating limits. I read that as a clear sign that preserving investment-grade access matters more than aggressive capital returns. The gap is that this spending and dividend commitment sits against $104.8B net sales of 2025, down 1.7%, and adjusted operating income of $4.8B, down 14.2%, so investors should view the plan as defensive reinvestment rather than proof that demand has already turned.
Recent Earnings
Q1 2026 revenue rose to $25.4B from $23.8B a year earlier, while EBITDA fell to $2B from $2.3B and net income declined to $781M from $1B. That mix matters more than the top-line gain: Target is still selling more, but the margin structure is not yet keeping pace, which is why I do not read the quarter as a clean earnings inflection. The holiday quarter at $30.5B in revenue and $2.2B of EBITDA looks seasonal for a retailer, so the better read is that traffic is improving but profitability remains uneven.
Financial Analysis
Growth
TGT — Financial Growth (Quarterly, USD Mil)
| Metric | 2025-04-30 | 2025-07-31 | 2025-10-31 | 2026-01-31 | 2026-04-30 |
|---|---|---|---|---|---|
| REVENUE (USD Mil) | 23,846 | 25,211 | 25,270 | 30,453 | 25,443 |
| EBIT (USD Mil) | 1,498 | 1,334 | 974 | 1,407 | 1,150 |
| EBITDA (USD Mil) | 2,285 | 2,105 | 1,747 | 2,210 | 1,963 |
| NET INCOME (USD Mil) | 1,036 | 935 | 689 | 1,045 | 781 |
| DILUTED EPS | 2.3 | 2 | 1.5 | 2.3 | 1.7 |
Source: Yahoo Finance — Quarterly Financial Statements
Revenue moved from $23.8B in Q1 2025 to $25.2B in Q2, $25.3B in Q3, $30.5B in Q4, then back to $25.4B in Q1 2026. That is a 6.7% year-over-year gain in the latest quarter, but the bigger signal is the holiday spike in Q4 2025, which is seasonal for a retailer and should not be annualized. EBITDA fell from $2.3B to $2.1B, then $1.7B, before rebounding to $2.2B and easing to $2B. For me, that says demand is stable, but the earnings engine is not accelerating.
Profitability
TGT — Profitability (TTM)
| Metric | TTM |
|---|---|
| Operating Margin (TTM) | 4.5% |
| Net Margin (TTM) | 3.2% |
| Return on Assets (TTM) | 5.7% |
| Return on Equity (TTM) | 22.0% |
| Gross Margin (TTM) | 28.1% |
| EBITDA Margin (TTM) | 7.8% |
Source: Yahoo Finance — Trailing Twelve Months (TTM)
TTM operating margin was 4.5%, net margin was 3.2%, gross margin was 28.1%, EBITDA margin was 7.8%, ROA was 5.7%, and ROE was 22.0%. The gap between gross margin and operating margin is wide, which tells me Target still carries a heavy store, labor, and fulfillment cost base even after shrink improved to pre-pandemic levels. EBITDA margin above operating margin by 3.3 points shows depreciation and amortization are not the main issue; the pressure is mostly below gross profit, where scale and expense control matter most. That is consistent with the fulfillment-hub model described above: the network is a strength, but it only compounds if the store base keeps absorbing fixed costs efficiently.
Valuation
TGT — Valuation Multiples
| Metric | Value |
|---|---|
| Market Cap (USD Mil) | 60,912 |
| Enterprise Value (USD Mil) | 76,650 |
| EV/Revenue | 0.7 |
| EV/EBITDA | 9.2 |
| FCF Yield % (TTM) | 5.2% |
| Forward EPS (USD) | 8.9 |
| Analyst Target Price – Low (USD) | 92 |
| Analyst Target Price – Mean (USD) | 133.1 |
| Analyst Target Price – High (USD) | 162 |
| # Analyst Opinions | 34 |
Source: Yahoo Finance
Target trades at 0.7x EV/revenue and 0.6x price/sales, which is the cleanest read here because the 17.7x trailing P/E and 15.0x forward P/E are less informative for a retailer facing tariff and mix volatility. At 0.7x enterprise value to revenue, the market is pricing in low growth and only modest margin recovery, not a full re-rating to prior peak profitability. The 5.2% FCF yield is the better value lens signal: investors are paying about 19.4x levered free cash flow, so the stock is not distressed, but it is also not cheap enough to assume a rapid rebound. On my read, fair value sits around $110-$145 per share. That range sits around the analyst mean target of $133 and inside the $92–$162 consensus band, which tells me the market is not wildly mispricing the name. Forward EPS of 8.92 also matters: it implies the stock is not expensive on earnings, but the multiple only works if margin recovery holds, so valuation and profitability have to improve together.
Leverage
TGT — Leverage & Coverage (Quarterly)
| Metric | Value |
|---|---|
| Current Ratio (mrq) | 0.9 |
| Operating Cash Flow (TTM, USD Mil) | 7,003 |
| Levered Free Cash Flow (TTM, USD Mil) | 3,141.2 |
| Net Debt/EBITDA (TTM) | 1.9 |
| FCF Margin % (TTM) | 2.9% |
Source: Yahoo Finance — Quarterly Financial Statements
Target’s debt/equity ratio was 117.5%, current ratio was 0.9, and total debt was $19.3B. Cash generation is still solid, with operating cash flow of $7B and levered free cash flow of $3.1B, while net debt/EBITDA was 1.9x and FCF margin was 2.9%. I view this as manageable leverage with a tight liquidity cushion: the company generates enough cash to service debt and fund operations, but the current ratio below 1.0 leaves limited near-term flexibility if tariffs or weak traffic pressure working capital. The 1.9x net leverage level gives Target room to absorb a downturn, yet it would become a nearer-term concern if cash conversion weakens further or if a refinancing window opens after another period of margin pressure.
Comparable Analysis
Growth
| Company | Revenue TTM (USD Mil) | Revenue Growth YoY % | EBITDA TTM (USD Mil) | Diluted EPS TTM |
|---|---|---|---|---|
| TGT | 106,377 | 6.7% | 8,344 | 7.6 |
| WMT | 725,305 | 7.3% | 44,838 | 2.8 |
| COST | 293,587 | 21.5% | 13,790 | 19.9 |
| DLTR | 19,747.9 | 7.2% | 2,405.3 | 6.2 |
| BJ | 21,965.3 | 9.9% | 1,118.8 | 4.3 |
| KR | 148,645 | 2.2% | 8,080 | 1.7 |
Source: Yahoo Finance
TGT’s revenue growth of 6.7% TTM sits just below WMT’s 7.3% and DLTR’s 7.2%, but well ahead of KR’s 2.2%, so the market is not paying for a growth gap here. COST is the outlier at 21.5%, which is why TGT looks more like a steady cash compounder than a high-growth retailer.
Valuation
| Company | Trailing P/E | Forward P/E | EV/Revenue | EV/EBITDA | Price/Sales (TTM) | Price/Book (mrq) | Market Cap (USD Mil) | Enterprise Value (USD Mil) | Beta (5Y Monthly) | FCF Yield % (TTM) | Forward EPS |
|---|---|---|---|---|---|---|---|---|---|---|---|
| TGT | 17.7 | 15 | 0.7 | 9.2 | 0.6 | 3.7 | 60,912 | 76,650 | 0.99 | 5.2% | 8.9 |
| WMT | 42 | 36.3 | 1.4 | 22.8 | 1.3 | 10.1 | 950,354 | 1,021,815 | 0.60 | 0.7% | 3.3 |
| COST | 48.1 | 42.3 | 1.4 | 30.7 | 1.4 | 25.7 | 424,711 | 423,024 | 0.87 | 1.6% | 22.6 |
| DLTR | 18.2 | 14.8 | 1.4 | 11.8 | 1.1 | 6.3 | 21,795 | 28,381 | 0.66 | 6.6% | 7.6 |
| BJ | 19.8 | 17.6 | 0.6 | 12.4 | 0.5 | 5.2 | 10,998 | 13,832 | 0.23 | 0.8% | 4.9 |
| KR | 33.4 | 10.3 | 0.4 | 8.1 | 0.2 | 6.2 | 34,972 | 65,783 | 0.42 | 8.6% | 5.5 |
Source: Yahoo Finance
TGT’s 17.7x trailing P/E and 0.7x EV/revenue are far below WMT’s 42.0x and 1.4x, and also below COST’s 48.1x and 1.4x. That discount is partly explained by TGT’s lower growth and thinner margins, but it is not a deep-value setup because the stock still trades at 5.2% FCF yield versus WMT’s 0.7% and COST’s 1.6%. A $1 investment a year ago would be worth $1.5 in TGT, versus $1.2 in WMT, $1.0 in COST, $0.8 in DLTR, $0.8 in BJ, and $0.8 in KR, which tells me the market has already rewarded the recovery more than the fundamentals alone would justify.
Profitability
| Company | Operating Margin (TTM) | Net Margin (TTM) | Return on Equity (TTM) | Gross Margin (TTM) | EBITDA Margin (TTM) |
|---|---|---|---|---|---|
| TGT | 4.5% | 3.2% | 22.0% | 28.1% | 7.8% |
| WMT | 4.2% | 3.1% | 24.1% | 25.0% | 6.2% |
| COST | 3.7% | 3.0% | 29.2% | 12.9% | 4.7% |
| DLTR | 9.1% | 6.5% | 34.0% | 37.0% | 12.2% |
| BJ | 3.7% | 2.6% | 27.9% | 18.5% | 5.1% |
| KR | 3.2% | 0.7% | 13.8% | 24.0% | 5.4% |
Source: Yahoo Finance
TGT’s gross margin of 28.1% is above WMT’s 25.0% and KR’s 24.0%, but below DLTR’s 37.0% and COST’s 12.9%, while its operating margin of 4.5% is slightly ahead of WMT’s 4.2% and above KR’s 3.2%. The narrower gap at the operating line than at gross margin suggests TGT’s main advantage is expense control rather than merchandise economics, which is a more durable sign than a one-quarter gross margin swing. ROE at 22.0% is respectable, but COST’s 29.2% and DLTR’s 34.0% show how much more efficient the best peers are.
Leverage
| Company | Total Debt/Equity % (mrq) | Current Ratio (mrq) | Total Debt (mrq, USD Mil) | Net Debt/EBITDA (TTM) | FCF Margin % (TTM) |
|---|---|---|---|---|---|
| TGT | 117.5 | 0.9 | 19,272 | 1.9 | 2.9% |
| WMT | 74.8 | 0.8 | 75,545 | 1.4 | 0.9% |
| COST | 60.3 | 1.1 | 10,228 | -0.1 | 2.4% |
| DLTR | 216.5 | 1.2 | 7,593.3 | 2.7 | 7.3% |
| BJ | 134.6 | 0.7 | 2,861.5 | 2.5 | 0.4% |
| KR | 373.4 | 0.8 | 24,192 | 2.6 | 2.0% |
Source: Yahoo Finance
TGT’s net debt/EBITDA of 1.9x is cleaner than DLTR’s 2.7x, BJ’s 2.5x, and KR’s 2.6x, while its current ratio of 0.9 is tighter than COST’s 1.1 and DLTR’s 1.2. That combination matters because TGT is not the most levered retailer in the group, but it also does not have the liquidity cushion that would justify a premium on balance-sheet safety. Its 2.9% FCF margin is better than WMT’s 0.9% and COST’s 2.4%, so the cash conversion profile is solid even if the balance sheet is only average.
Conclusion
I would put my rating as a Hold because Target has enough cash generation to support the stock, but not enough evidence of durable margin recovery to justify a more aggressive call. The company is still working through a gap between sales growth and earnings growth: revenue is up 6.7% in the latest quarter, yet EBITDA and net income are still below last year’s level, which tells me the turnaround is not fully self-funding at the operating line. That is why I want to see operating margin move above 5.0%, meaning the company is clearly reclaiming more of each sales dollar, before I would move more towards a Buy.
I would move from Hold to Sell if net debt/EBITDA rose above 2.5x, which would mean leverage is starting to eat into flexibility, or if current ratio stayed below 1.0 while gross margin slipped further from 28.1%, because that combination would point to weaker inventory control and less room to absorb tariff-driven cost inflation. If quarterly earnings growth stayed negative while the company kept leaning on a 2.9% FCF margin, I would read that as cash generation being used to mask a softer operating trend rather than evidence of a stronger core business.
Weighing both sides, I lean to the bull case showing up later rather than sooner, but not by enough to move off Hold today. The stock already reflects some recovery, and I want to see one more clean quarter of margin stability before I give Target credit for a more durable rerating.
What’s your take? I rated Target (TGT) HOLD above — but the goal here is to get this right, not just to publish an opinion. What would you add to this analysis, or which risk or catalyst do you think I’m under- or over-weighting? Tell me in the comments.
Data sourced from Yahoo Finance. Not investment advice.
Leave a Comment