
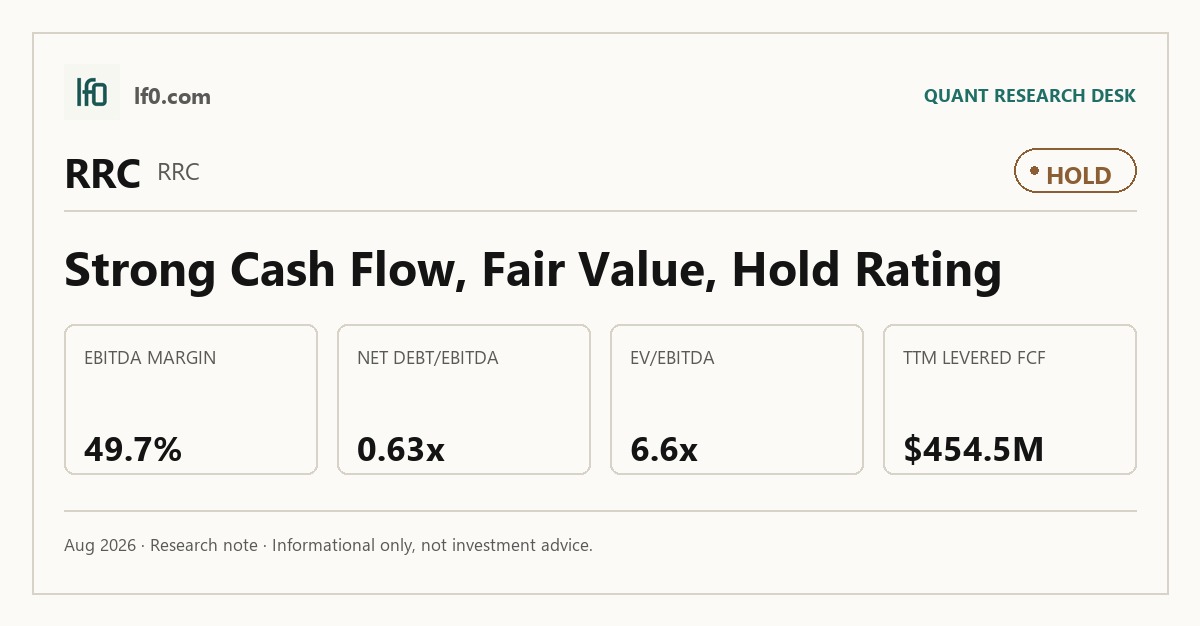
Quick Thesis
- Rated Hold — strong cash generation, but valuation already reflects it.
- Strongest support: 49.7% TTM EBITDA margin and 0.63x net debt/EBITDA.
- Main risk: commodity exposure, with about 65% of proved reserves in natural gas.
- Valuation is fair, at 6.62x EV/EBITDA and 11.6x trailing P/E.
- I would turn more constructive if EBITDA stays above 541.1M in Q3 2026.
Executive Summary
Rating: HOLD | RRC
Measured from adjusted close on 2026-08-28 to 2026-10-13. Sell ratings are correct when the stock falls; Hold is tracked as a +/-10% range. Daily-close data, not intraday. Calls are tracked for 182 days from publication, then frozen as a final record.
I would put my rating as a Hold because Range Resources has a clean 0.63x net debt to EBITDA profile and 13.9% TTM free cash flow margin, but the stock already trades at 6.62x EV to EBITDA and 11.6x trailing P/E. In my view, that is a reasonable price for a business that keeps converting reserves into cash, yet it is not cheap enough to offset commodity and basin risk. The key tension is that the company can fund drilling, buybacks, and debt service without strain, but the equity still depends on gas pricing to keep that cash engine moving. I would become more constructive if Q3 2026 EBITDA holds above 541.1M, because that would show the current margin profile is durable rather than just a strong quarter.
Company Profile
Range Resources Corporation is an independent natural gas, natural gas liquids, and oil producer focused on the Appalachian region, with essentially all proved reserves in Pennsylvania. It sells production through short-term contracts and recognizes revenue when title transfers; it also earns brokered natural gas and marketing revenue by buying and reselling third-party volumes to use pipeline capacity. Founded in 1976, the company is a Delaware corporation and has spent years consolidating acreage, extending laterals, and adding reserves in the Marcellus Shale. As of December 31, 2025, it held 18.1 Bcfe of proved reserves, 12.8 Bcfe of proved developed reserves, and 5.3 Bcfe of proved undeveloped reserves. It is listed on the New York Stock Exchange under RRC, with $1B of debt, a $2B bank credit facility with $118M drawn, and 2.337e+08 common shares outstanding.
Economic Moat
Business Model
The reserve base in Pennsylvania is the part of the model I view as hardest to replicate within three years, because Range controls 18,141,862 Mcfe of proved reserves at December 31, 2025 and 12,801,132 Mcfe of proved developed reserves, while 5,340,730 Mcfe remain proved undeveloped and scheduled within the five-year development window. In my view, a competitor cannot quickly assemble that inventory, the acreage position, and the infrastructure needed to convert it into production at scale. The company also has a second layer of support from long-dated transportation and gathering commitments, including $5.9B of minimum fees through those contracts at December 31, 2025, which helps secure takeaway and makes the asset base more durable than a simple leasehold position. Range also hedged about 20% of projected total production for 2026 and about 27% of projected natural gas production, which does not create the moat but does reduce near-term price volatility and gives management more room to execute the drilling plan.
Business & Operating Risks
The most material disclosed risk is commodity price volatility, because about 65% of proved reserves were natural gas as of December 31, 2025 and lower natural gas, NGL, and oil prices would cut revenue, operating income, and cash flow while also reducing the cash available for capital expenditures and reserve replacement. According to the risk factors in the 10-K, Range has already temporarily shut in wells due to low commodity prices, so this is not hypothetical. The filing also notes that lower prices can reduce the borrowing base under the bank credit facility, which means commodity weakness can hit both earnings and liquidity at the same time.
A second risk is transportation and processing dependence in southwest Pennsylvania, where essentially all estimated proved reserves are located. The company depends on third-party gathering, transportation, and processing systems, and the filing warns that disruption of certain third-party gas processing facilities could materially affect its ability to market and deliver production in that area, including the possibility of curtailing a significant amount of production if an outage lasts more than a short period. Because Range has no control over when those facilities are restored, the risk is not just operational noise; it can directly interrupt cash flow.
Regulatory and land-use risk in Pennsylvania is also specific. The 10-K highlights the January 2024 Pennsylvania Department of Environmental Protection disclosure policy, Cecil Township’s November 2024 setback ordinance moving from 500 feet to 2,500 feet for protected structures and 5,000 feet for schools and hospitals, and the December 9, 2025 acceptance of a citizen petition to expand setback distances across Pennsylvania. Those items can delay permits, raise compliance costs, and restrict drilling locations, and the filing also notes that a ban on hydraulic fracturing in Pennsylvania or at the federal level would preclude economic development of the Marcellus Shale reserves. The current financial data does not show a full regulatory shock yet, but it does show that the company is already operating in a tightly constrained basin.
Debt and borrowing-base risk is another headwind. Range had $118M of borrowings on its floating-rate bank credit facility as of December 31, 2025, and the filing says declines in commodity prices can lower the borrowing base and reduce financial flexibility. That matters because the company may need to dedicate more cash flow to debt service, and a ratings downgrade could increase future borrowing costs or require collateral. The current financial data suggests this is manageable, but it is still a real constraint.
Over the last five years, the risk profile has shifted from pandemic-era demand language to a more basin-specific and policy-specific set of threats. In 2022 through 2024, the filing emphasized global health pandemics and related concerns, but that language has faded from the current 10-K, while Pennsylvania setback rules, the December 2025 citizen petition, and climate-related litigation and disclosure pressure have become more prominent. The commodity-price risk has stayed central across all five years, but the current filing is more explicit about shut-ins, borrowing-base pressure, and local processing bottlenecks than the 2022 and 2023 versions. Taken together, these risks do not break the moat, but they do make it more price-sensitive than the reserve headline alone suggests.
Management Discussion & Analysis
Management is signaling a $650M to $700M 2026 capital budget, excluding acquisitions, which tells me the priority is still drilling-led growth rather than balance-sheet shrinkage or a large deal. That budget is explicitly aimed at modest production growth relative to 2025 while also generating free cash flow, so I read it as a maintenance-plus plan, not an aggressive volume push. The company also says it will keep using commodity derivative contracts and has already hedged about 20% of projected total 2026 production and about 27% of projected natural gas production, which supports cash flow visibility but also caps upside if prices stay strong. Capital allocation remains shareholder-friendly, with $230.6M of common stock repurchased in 2025, $85.7M of dividends paid, and $785.5M of remaining repurchase authorization at December 31, 2025; that mix signals confidence in cash generation, although the January 15, 2026 redemption of the $600M 8.25% senior notes due 2029 was funded with credit facility borrowings, so it improved maturity timing without reducing leverage. The narrative around sustainable long-term success is partly backed by the numbers, because 2025 operating cash flow reached $1.2B and the company ended 2025 with $1.7B of liquidity, but the same filing also shows $1B of total debt and a January 2026 liquidity drop to about $1.1B after the note redemption, so investors should not mistake liquidity management for deleveraging.
Management’s track record is mixed but not poor. In 2025, it said the capital budget would be $650M to $690M and the actual capital investment was $673.8M, which confirms disciplined execution rather than drift. Prior filings also emphasized discipline in capital investments, optimizing drilling and completion efficiencies, and managing the balance sheet, and the 2025 results did show 53 net wells drilled and completed with a 100% success rate, plus lower interest expense per mcfe, so those claims were broadly supported. The tone has stayed constructive across 2023 to 2026, but the numbers have been better than the rhetoric in one important respect: management has repeatedly framed the business as resilient through commodity volatility, yet 2025 proved that resilience only after a 14% increase in average realized prices and a 27% rise in natural gas, NGL, and oil sales, which means the model still leans heavily on price rather than just operational control. CEO Dennis Degner is identified in the insider table, so the leadership picture is clear enough to track. Management credibility is decent, but the January 2026 debt-funded redemption and the continued reliance on commodity prices keep this from being a clean bull signal.
Recent Events
The most significant development I see is the board’s February 24, 2026 decision to lift the share repurchase authorization to $1.5B. That is a clear capital-allocation signal in favor of returning excess cash to shareholders, and it strengthens the thesis that management sees the stock as a better use of capital than incremental balance-sheet expansion.
I also view the January 21, 2026 and April 14, 2026 derivative updates as a reminder that Range remains exposed to commodity hedging swings. The company reported a $32.8M derivative gain for Q4 2025 and a $33.4M derivative loss for Q1 2026, with net cash settlements flipping from a $24.6M receipt to a $49.3M payment. That pattern does not change the asset base, but it does show that near-term cash generation can move sharply with hedge marks, which keeps the equity tied to gas-price volatility.
The April 21, 2026 first-quarter earnings release and the May 13, 2026 annual meeting were routine disclosures, but the meeting outcome still matters: all seven directors were re-elected and say-on-pay passed, so governance continuity remains intact. In my view, the recent 8-Ks modestly strengthen the investment case because buybacks are being scaled up, while the derivative swings mainly reinforce that commodity exposure remains the key operating variable.
Financial Analysis
Growth
RRC — Financial Growth (Quarterly, USD Mil)
| Metric | 2025-06-30 | 2025-09-30 | 2025-12-31 | 2026-03-31 | 2026-06-30 |
|---|---|---|---|---|---|
| REVENUE (USD Mil) | 699.6 | 655.3 | 786.9 | 1,067.5 | 759.6 |
| EBIT (USD Mil) | 328.8 | 207.6 | 261.2 | 452.6 | 263 |
| EBITDA (USD Mil) | 420.4 | 301.4 | 355.8 | 541.1 | 356.1 |
| NET INCOME (USD Mil) | 237.6 | 144.3 | 179.1 | 341.6 | 195.3 |
| DILUTED EPS | 1 | 0.6 | 0.8 | 1.4 | 0.8 |
Source: Yahoo Finance — Quarterly Financial Statements
RRC’s revenue has been choppy rather than linear. Revenue was $699.6M in Q2 2025, $655.3M in Q3 2025, $786.9M in Q4 2025, $1.1B in Q1 2026, and $759.6M in Q2 2026, so the latest quarter fell 28.8% sequentially after a Q1 spike. EBITDA and net income moved faster than revenue in Q1 2026, but they slowed with revenue in Q2 2026. The pattern looks commodity-driven and therefore likely to stay volatile, so I read the growth signal as neutral to bear.
Profitability
RRC — Profitability (TTM)
| Metric | TTM |
|---|---|
| Operating Margin (TTM) | 36.1% |
| Net Margin (TTM) | 26.3% |
| Return on Assets (TTM) | 10.5% |
| Return on Equity (TTM) | 19.5% |
| Gross Margin (TTM) | 52.1% |
| EBITDA Margin (TTM) | 49.7% |
Source: Yahoo Finance — Trailing Twelve Months (TTM)
TTM operating margin was 36.1%, gross margin was 52.1%, and EBITDA margin was 49.7%, so the 16.0-point gap between gross and operating margin shows a business that still carries heavy exploration, production, and overhead costs even after strong wellhead economics. That gap is narrower at the EBITDA line, which tells me depreciation and amortization are not the main issue; the core question is operating leverage, not asset write-downs or other non-cash charges. TTM net margin of 26.3% remains solid, but it sits 9.8 points below operating margin, so financing and other below-the-line items still take a meaningful share of earnings. TTM ROA was 10.5% and TTM ROE was 19.5%, and the spread suggests returns are being amplified by leverage rather than pure asset productivity. Investors should watch for operating margin staying above 35.0%, meaning the cost structure is still scaling well, and for net margin to keep closing the gap to operating margin. Profitability is a bull signal because the company is already well into positive earnings and cash generation, with the remaining question being how much further margins can expand.
Valuation
RRC — Valuation Multiples
| Metric | Value |
|---|---|
| Market Cap (USD Mil) | 9,805 |
| Enterprise Value (USD Mil) | 10,746 |
| Trailing P/E | 11.6 |
| Forward P/E | 10.6 |
| Price/Sales (TTM) | 3 |
| Price/Book (mrq) | 2.1 |
| EV/Revenue | 3.3 |
| EV/EBITDA | 6.6 |
| Beta (5Y Monthly) | 0.43 |
| FCF Yield % (TTM) | 4.6% |
| Forward EPS (USD) | 4 |
| Analyst Target Price – Low (USD) | 37 |
| Analyst Target Price – Mean (USD) | 45.6 |
| Analyst Target Price – High (USD) | 57 |
| # Analyst Opinions | 22 |
Source: Yahoo Finance
RRC trades at 3.3x EV/revenue and 6.62x EV/EBITDA, with a 3.0x price/sales ratio and 11.6x trailing P/E. The 4.64% FCF yield and 1.05 PEG ratio suggest the market is paying a modest premium for a business that still has visible cash generation and only low single-digit growth implied by the earnings multiple. That is reinforced by 10.6x forward P/E on 2026 EPS of $4.0, which implies investors are underwriting stable commodity cash flows rather than a sharp rerating. On the analysis here, I would put fair value in a range of roughly $37-$64 per share, using peer EV/revenue as a guide and then adjusting for RRC’s cleaner leverage profile and steadier cash conversion. That range sits around and slightly above the $45.6 analyst mean target, with 22 analyst opinions giving the consensus enough weight to matter; in other words, my range is not a deep disagreement with Street estimates, but I do weight leverage and cash flow a bit more than the average target appears to. The implied EPS range is roughly $3.8-$4.3, which brackets the $4.0 forward EPS in the table and looks reasonable versus peers such as AR at $4.3, CNX at $3.9, EQT at $3.9, EOG at $14.4, and TRGP at $12.1. On a like-for-like basis, that EPS profile is solid but not exceptional, so I do not think the market is paying a growth multiple for RRC; it is paying for balance-sheet safety and cash conversion.
The balance sheet is not stretched: net debt to EBITDA is 0.6x, total debt to equity is 21.59%, and the current ratio is 0.649, so the valuation is not being driven by distress. Shares also trade above book value at 2.1x price to book, with book value per share of $20.2 versus total cash per share of $0.3. The stock is 21.5% higher over 52 weeks, while the 50-day and 200-day moving averages of $38.4 and $39.2 sit below the 52-week high of $48.3, which means the market has already rewarded the name but is not pricing a full breakout. Overall, valuation is fair rather than cheap: the stock is supported by cash generation and leverage, but the multiple already reflects that quality.
Leverage
RRC — Leverage & Coverage (Quarterly)
| Metric | Value |
|---|---|
| Total Debt/Equity % (mrq) | 21.6 |
| Current Ratio (mrq) | 0.6 |
| Total Debt (mrq, USD Mil) | 1,016.6 |
| Operating Cash Flow (TTM, USD Mil) | 1,359.2 |
| Levered Free Cash Flow (TTM, USD Mil) | 454.5 |
| Net Debt/EBITDA (TTM) | 0.6 |
| FCF Margin % (TTM) | 13.9% |
Source: Yahoo Finance — Quarterly Financial Statements
RRC’s leverage is modest: Total Debt/Equity % (mrq) was 21.59%, Current Ratio (mrq) was 0.649, and Total Debt (mrq, USD Mil) was 1017. Cash generation is the offset, with Operating Cash Flow (TTM, USD Mil) at 1359, Levered Free Cash Flow (TTM, USD Mil) at 454.5, Net Debt/EBITDA (TTM) at 0.626, and FCF Margin % (TTM) at 13.9%. In my opinion, this is medium refinancing risk rather than high because cash flow covers debt service well, but the 0.65 current ratio means near-term liquidity is not abundant and the company still depends on continued commodity cash generation. EBITDA converts into cash reasonably well, but not perfectly, since $1.4B of operating cash flow only becomes $454.5M of levered FCF after capex and other cash uses. That leaves room to absorb a downturn, yet a sharp commodity move or a heavier 2026 capital program would make refinancing and liquidity more sensitive. Balance sheet and cash flow are a neutral signal.
Insider Activity
The insider transaction record I see here is one-sided: 17 open-market sales and 0 open-market purchases from 2025-02-05 to 2026-06-01, so insiders are net sellers. The activity is broad rather than concentrated, with multiple executives and insiders selling across several dates, which suggests alignment is weaker than it would be under open-market buying. That is a bear signal, although I would not overread it on its own because the sales are spread across time rather than clustered around a single event.
Comparable Analysis
Growth
| Company | Revenue TTM (USD Mil) | Revenue Growth YoY % | EBITDA TTM (USD Mil) | Diluted EPS TTM |
|---|---|---|---|---|
| RRC | 3,270.2 | 8.6% | 1,624.2 | 3.6 |
| AR | 5,781.2 | 12.6% | 2,316.9 | 3.5 |
| CNX | 2,139.9 | -18.1% | 1,829.5 | 6.2 |
| EQT | 9,293.9 | -3.9% | 6,995.4 | 4.3 |
| EOG | 26,721 | 58.7% | 14,495 | 12.8 |
| TRGP | 16,741.5 | 4.2% | 5,497.7 | 10.5 |
Source: Yahoo Finance
RRC’s revenue growth is solid but not elite: 8.6% TTM growth is ahead of EQT’s -3.9% and CNX’s -18.1%, but behind AR’s 12.6% and far below EOG’s 58.7%. EBITDA of $1.6B also sits below EOG’s $14.5B and TRGP’s $5.5B, so RRC is a mid-pack grower rather than a category leader. That matters because the market should not pay a growth premium here, even if the company is clearly not shrinking.
Valuation
| Company | Trailing P/E | Forward P/E | EV/Revenue | EV/EBITDA | Price/Sales (TTM) | Price/Book (mrq) | Market Cap (USD Mil) | Enterprise Value (USD Mil) | Beta (5Y Monthly) | FCF Yield % (TTM) | Forward EPS | Analyst Target Price – Low | Analyst Target Price – Mean | Analyst Target Price – High | # Analyst Opinions |
|---|---|---|---|---|---|---|---|---|---|---|---|---|---|---|---|
| RRC | 11.6 | 10.6 | 3.3 | 6.6 | 3 | 2.1 | 9,805 | 10,746 | 0.43 | 4.6% | 4 | 37 | 45.6 | 57 | 22 |
| AR | 11.1 | 9 | — | — | 2.1 | 1.4 | 11,901 | — | 0.34 | 3.3% | 4.3 | 37 | 49.4 | 60 | 20 |
| CNX | 5.9 | 9.4 | 3.6 | 4.2 | 2.5 | 1.1 | 5,382 | 7,716 | 0.61 | 8.1% | 3.9 | 32 | 37.7 | 48 | 11 |
| EQT | 12.8 | 14 | 4.7 | 6.2 | 3.7 | 1.4 | 34,441 | 43,407 | 0.58 | 7.1% | 3.9 | 52 | 67.7 | 81 | 25 |
| EOG | 11.2 | 10 | 3 | 5.5 | 2.8 | 2.4 | 75,705 | 79,137 | 0.28 | 5.9% | 14.4 | 134 | 160 | 193 | 27 |
| TRGP | 27.5 | 23.9 | 4.9 | 14.8 | 3.7 | 19.7 | 61,778 | 81,545 | 0.72 | 0.1% | 12.1 | 257 | 308.1 | 351 | 21 |
Source: Yahoo Finance
RRC trades at 6.6x EV/EBITDA, 11.6x trailing P/E, 10.6x forward P/E, 3.3x EV/revenue, and a 4.6% FCF yield. That sits above CNX’s 4.2x EV/EBITDA and 8.1% FCF yield, but below TRGP’s 14.8x EV/EBITDA and 0.1% FCF yield, while EOG’s 5.5x EV/EBITDA and 5.9% FCF yield show the market is still willing to pay for stronger scale and earnings power. I feel the market is giving RRC credit for steadier cash generation than CNX and EQT, but not enough to justify a premium to EOG, which has a much larger earnings base and still trades at a lower EV/EBITDA multiple. Using peer EV/revenue of 2.96x to 4.87x on RRC’s $3.3B TTM revenue implies an enterprise value of about $9.7B to $15.9B, or roughly $37 to $64 per share after netting debt and cash and dividing by 233.7M shares; that range brackets the current price and says the stock is not obviously mispriced on multiples alone. The valuation premium to some peers is easier to accept because RRC’s leverage is cleaner, so the market is paying for balance-sheet safety as much as for the business itself.
Profitability
| Company | Operating Margin (TTM) | Net Margin (TTM) | Return on Assets (TTM) | Return on Equity (TTM) | Gross Margin (TTM) | EBITDA Margin (TTM) |
|---|---|---|---|---|---|---|
| RRC | 36.1% | 26.3% | 10.5% | 19.5% | 52.1% | 49.7% |
| AR | 26.0% | 18.7% | 6.6% | 14.2% | 67.2% | 40.1% |
| CNX | 62.9% | 44.4% | 8.7% | 21.2% | 73.6% | 85.5% |
| EQT | 23.4% | 29.2% | 6.6% | 11.1% | 80.8% | 75.3% |
| EOG | 40.7% | 25.7% | 11.0% | 22.5% | 62.6% | 54.2% |
| TRGP | 27.8% | 13.5% | 9.2% | 70.8% | 43.2% | 32.8% |
Source: Yahoo Finance
RRC’s 36.1% operating margin, 26.3% net margin, 52.1% gross margin, and 49.7% EBITDA margin put it ahead of AR on operating and net margin, but behind CNX and EOG on the broader profitability stack. CNX is stronger at 62.9%, 44.4%, 73.6%, and 85.5%, while EOG posts 40.7%, 25.7%, 62.6%, and 54.2%, so RRC is efficient without being the best-in-class operator in the group. That tells me the company deserves respect on cash conversion, but not a premium multiple on profitability alone.
Leverage
| Company | Total Debt/Equity % (mrq) | Current Ratio (mrq) | Total Debt (mrq, USD Mil) | Operating Cash Flow TTM (USD Mil) | Free Cash Flow TTM (USD Mil) | Net Debt/EBITDA (TTM) | FCF Margin % (TTM) |
|---|---|---|---|---|---|---|---|
| RRC | 21.6 | 0.6 | 1,016.6 | 1,359.2 | 454.5 | 0.6 | 13.9% |
| AR | 55.5 | 0.4 | 4,615.3 | 1,978.7 | 391.2 | — | 6.8% |
| CNX | 49.1 | 0.7 | 2,380.1 | 1,087.8 | 437.1 | 1.3 | 20.4% |
| EQT | 19.6 | 0.7 | 5,655.7 | 6,246.1 | 2,460.9 | 0.8 | 26.5% |
| EOG | 25.9 | 1.9 | 8,250 | 13,358 | 4,478.8 | 0.2 | 16.8% |
| TRGP | 515.8 | 0.8 | 19,578 | 4,285.5 | 65.8 | 3.5 | 0.4% |
Source: Yahoo Finance
RRC’s 21.6% debt/equity and 0.63x net debt/EBITDA are lighter than CNX’s 49.1% and 1.3x, EQT’s 19.6% and 0.8x, and TRGP’s 515.8% and 3.5x, while its 13.9% FCF margin is well above TRGP’s 0.4% and close to EQT’s 26.5% and CNX’s 20.4%. That tells me RRC has a cleaner balance sheet than the more levered midstream names, so its cash flow is less encumbered and the equity deserves a lower risk discount. The leverage edge also helps explain why RRC can trade at a somewhat firmer multiple than some peers even without leading them on growth.
Conclusion
I would put my rating as a Hold because Range Resources combines a 49.7% EBITDA margin in the latest twelve months with only 0.63x net debt to EBITDA, yet the stock already trades at 6.62x EV to EBITDA and 11.6x trailing P/E, which leaves limited room for a rerating without a clearer commodity tailwind. The strongest support is cash generation: operating cash flow was 1.4B TTM and levered free cash flow was 454.5M TTM, so the business is funding drilling, buybacks, and debt service without strain. The main risk is still commodity exposure, since about 65% of proved reserves were natural gas at December 31, 2025 and the company has already shut in wells when prices weakened, which means earnings can move quickly with gas prices.
I would raise my rating more towards a Buy if natural gas prices stay firm enough to keep operating margin above 35.0% and free cash flow above the current 454.5M TTM run rate, because that would show the company can convert its reserve base into cash without leaning on a favorable hedge book. A move like that would also make the current $1.5B buyback authorization more accretive, since repurchases at today’s valuation would retire more earnings power per dollar and could lift EPS faster than production growth alone. I would move from Hold to Sell if commodity weakness pushes net debt to EBITDA back above 1.0x, meaning the balance sheet is starting to absorb more of the cycle, or if the company has to curtail production again because of processing bottlenecks in southwest Pennsylvania. A weaker gas tape would also hit the cash engine directly: if the 1.4B of operating cash flow were to fall by even 20%, that would remove roughly $270M of annual cash generation, enough to slow buybacks and make the 2026 capital plan less flexible.
Weighing both sides, I lean to the bull case first because the reserve base, the $5.9B of minimum fee commitments, and the current leverage profile give Range time to absorb volatility. Still, I do not see enough valuation upside to call it a Buy today, so Hold remains the right call until either cash flow expands materially or the multiple comes in.
What to Watch Next
- Q3 2026 EBITDA above 541.1M — would support a more constructive rating.
- Operating margin above 35.0% — would confirm the cost structure is still scaling.
- Net debt/EBITDA back above 1.0x — would signal the balance sheet is absorbing more of the cycle.
- Free cash flow above 454.5M TTM — would strengthen the buyback and capital-allocation case.
- Production curtailments in southwest Pennsylvania — would weaken the moat and pressure cash flow.
What’s your take? I rated Range Resources (RRC) HOLD above — but the goal here is to get this right, not just to publish an opinion. What would you add to this analysis, or which risk or catalyst do you think I’m under- or over-weighting? Tell me in the comments.
Sources
- SEC 10-K Annual Report — filed 2026-02-24
- SEC 8-K Filing (2026-05-13)
- SEC 8-K Filing (2026-04-22)
- SEC 8-K Filing (2026-04-14)
- SEC 8-K Filing (2026-02-25)
- SEC 8-K Filing (2026-01-21)
- SEC 8-K Filing (2026-01-05)
- SEC Form 4 Insider Transaction (2026-06-03)
- SEC Form 4 Insider Transaction (2026-06-03)
- SEC Form 4 Insider Transaction (2026-05-15)
- SEC 10-K Annual Report — FY2026
- SEC 10-K Annual Report — FY2025
Data sourced from Yahoo Finance and SEC EDGAR. Not investment advice.
Leave a Comment