Executive Summary
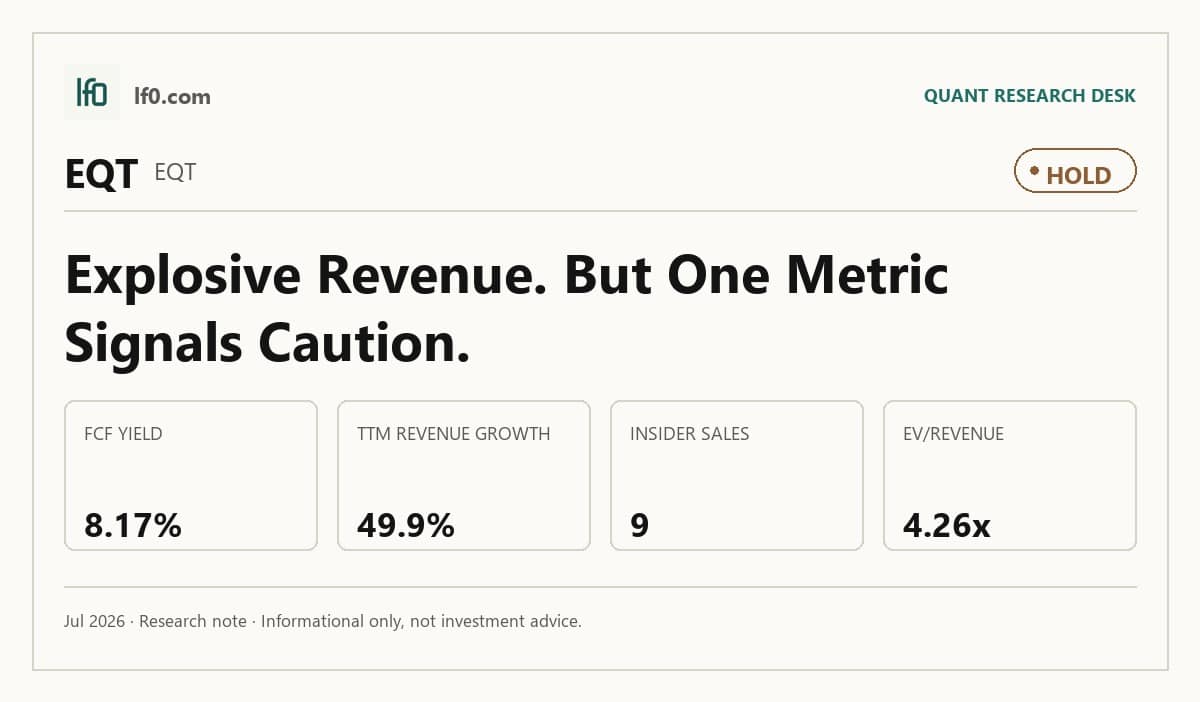
Rating: HOLD | EQT
Measured from adjusted close on 2026-07-13 to 2026-10-13. Sell ratings are correct when the stock falls; Hold is tracked as a +/-10% range. Daily-close data, not intraday. Calls are tracked for 182 days from publication, then frozen as a final record.
I would put my rating as a Hold because EQT’s cash generation is strong, but the stock already reflects much of that strength at 4.3x EV/revenue and 5.2x EV/EBITDA. The company posted 49.7% year-over-year revenue growth in Q1 2026 and 26.7% TTM free cash flow margin, yet the 0.66 current ratio and $6B of debt leave less room for error than the headline margins suggest. In my view, the key question is whether the Q1 step-up can hold once acquisition timing normalizes. I would move more constructive only if quarterly revenue stays above $3B and levered free cash flow remains above $2B, meaning the business is still generating cash after capex and interest.
Company Profile
EQT Corp. is a Pennsylvania-based natural gas producer with gathering and transmission assets concentrated in the Appalachian Basin. The company controls about 23 million gross acres, 28.0 Tcfe of proved reserves, and roughly 2,945 miles of pipeline infrastructure, and it also owns interests in Mountain Valley Pipeline, the 303-mile interstate line that moves gas from West Virginia to Virginia. EQT earns most of its revenue from upstream sales, gathering, and transmission, so its results depend on both commodity prices and how efficiently it can move gas to market. That integrated footprint is the core of the business model: it gives EQT more control over the path from wellhead to takeaway than a pure producer would have.
Economic Moat
Business Model
The moat here is not brand or pricing power; it is scale, acreage depth, and owned infrastructure. EQT’s 28.0 Tcfe reserve base and 2,945 miles of pipeline create a network that I feel is hard to replicate quickly, especially in a basin where contiguous acreage and takeaway capacity are already spoken for. The company’s integrated model also matters because it can align drilling, gathering, and transport around the same asset base, which lowers dependence on third-party capacity and supports steadier development economics. That structure is consistent with the high 81.0% gross margin and 81.9% EBITDA margin in the profitability section.
Business & Operating Risks
The main disclosed risk is commodity exposure: EQT’s cash flow and reserve value still swing with natural gas prices, and the filing notes that Henry Hub ranged from $2.65 to $9.86 per MMBtu in 2025. Operationally, the company is exposed to compression and processing outages, pipeline bottlenecks, and weather-related delays on Mountain Valley projects, any of which can interrupt volumes before they reach market. Regulatory and permitting risk also remains real because methane rules, fracturing limits, and environmental opposition can slow projects or raise costs. I do not think these risks break the moat itself, but they do threaten the speed at which the integrated asset base can convert into cash.
Management Discussion & Analysis
Management is responding to those risks by keeping capital spending flexible, leaning on cash flow, and using asset sales and liability management to protect the balance sheet. The 2026 plan still calls for $2.65B to $2.85B of capex, but the company is also preserving optionality by deferring spending if prices or permits turn less favorable. In my view, that is the right response to commodity and execution risk, although it does not eliminate the underlying exposure. The balance-sheet work is especially relevant because it supports the moat by keeping the integrated asset base funded without forcing distress-driven decisions.
Recent Events
The most important recent development is EQT’s continued cleanup of its debt stack. In March 2026, the company launched and then upsized a tender offer for senior notes, and it also redeemed the $344.9M 6.5% notes due 2027. That matters for the moat because a lower-cost capital structure gives EQT more room to keep investing in its acreage and pipeline network without overextending. The April 2026 derivative disclosure was less helpful, since it pointed to a $238M loss and $304M of net cash settlements paid in Q1 2026, but I still see the recent 8-Ks as net supportive of the structural thesis.
Financial Analysis
Growth
EQT — Financial Growth (Quarterly, USD Mil)
| Metric | 2025-03-31 | 2025-06-30 | 2025-09-30 | 2025-12-31 | 2026-03-31 |
|---|---|---|---|---|---|
| REVENUE (USD Mil) | 2,418.8 | 1,837.8 | 1,822.8 | 2,273.9 | 3,617 |
| EBIT (USD Mil) | 511.7 | 1,197.9 | 646.4 | 1,060.2 | 2,084.1 |
| EBITDA (USD Mil) | 1,132.4 | 1,821.4 | 1,334.8 | 1,728 | 2,738.9 |
| NET INCOME (USD Mil) | 242.1 | 784.1 | 335.9 | 677.1 | 1,487.2 |
| DILUTED EPS | 0.4 | 1.3 | 0.5 | 1.1 | 2.4 |
Source: Yahoo Finance — Quarterly Financial Statements
EQT’s revenue rose to $3.6B in Q1 2026 from $2.4B a year earlier, and EBITDA increased to $2.7B from $1.1B over the same period. That is a sharp step-up, but I would not treat it as a clean run rate because the move was helped by acquisition timing and a stronger production base. The important point is that growth is now feeding through to cash generation, which is what makes the integrated model valuable rather than just larger.
Profitability
EQT — Profitability (TTM)
| Metric | TTM |
|---|---|
| Operating Margin (TTM) | 57.4% |
| Net Margin (TTM) | 35.1% |
| Gross Margin (TTM) | 81.0% |
| EBITDA Margin (TTM) | 81.9% |
Source: Yahoo Finance — Trailing Twelve Months (TTM)
TTM operating margin was 57.4%, gross margin was 81.0%, EBITDA margin was 81.9%, and net margin was 35.1%. Those are strong margins for an upstream gas name, and they show EQT is already extracting a lot of cash from each revenue dollar before financing effects. Return on assets was 7.7% and return on equity was 13.4%, so leverage is helping returns, but the core business is profitable on its own. I would weight the margin profile more heavily than the return metrics because the margins better capture the moat described above.
Valuation
EQT — Valuation Multiples
| Metric | Value |
|---|---|
| Market Cap (USD Mil) | 30,655 |
| Enterprise Value (USD Mil) | 39,889 |
| Trailing P/E | 9.3 |
| Forward P/E | 11.7 |
| EV/Revenue | 4.3 |
| EV/EBITDA | 5.2 |
| FCF Yield % (TTM) | 8.2% |
| Analyst Target Price – Low (USD) | 57 |
| Analyst Target Price – Mean (USD) | 68.1 |
| Analyst Target Price – High (USD) | 79 |
Source: Yahoo Finance
EQT trades at 4.3x EV/revenue, 5.2x EV/EBITDA, 9.3x trailing P/E, and 11.7x forward P/E, with an 8.2% TTM FCF yield. On my read, fair value sits around $57–$79 per share, which is broadly in line with the analyst target range of $57 to $79 from 25 opinions; that tells me the market is not ignoring the cash flow, but it is also not pricing in a large discount. I would frame the stock as fairly valued rather than cheap because the leverage profile is manageable and the cash conversion is strong, yet the multiple already reflects that quality. Forward EPS of $4.19 also implies the stock is not trading on a depressed earnings base, and that matters because the current valuation is being supported by real earnings power rather than just a cyclical trough.
Leverage
EQT — Leverage & Coverage (Quarterly)
| Metric | Value |
|---|---|
| Total Debt/Equity % (mrq) | 20.8 |
| Current Ratio (mrq) | 0.7 |
| Total Debt (mrq, USD Mil) | 5,992.4 |
| Operating Cash Flow (TTM, USD Mil) | 6,439.8 |
| Levered Free Cash Flow (TTM, USD Mil) | 2,503.2 |
| Net Debt/EBITDA (TTM) | 0.7 |
| FCF Margin % (TTM) | 26.7% |
Source: Yahoo Finance — Quarterly Financial Statements
Total debt was $6B mrq, total debt to equity was 20.8%, and net debt to EBITDA was 0.7x. That is a reasonable balance sheet for a commodity producer, but the 0.66 current ratio says short-term liquidity is tight even though operating cash flow was $6.4B TTM and levered free cash flow was $2.5B. In other words, the leverage profile is not the problem; the issue is that EQT still needs to keep converting cash at a high rate to stay comfortable through a weaker gas tape. The 26.7% FCF margin shows it can do that today, which is why I do not see leverage as a thesis breaker.
Insider Activity
The insider tape is one-sided: there were no open-market purchases and 7 open-market sales in the period shown, including sales by several senior executives. I do not read that as a collapse in conviction, but it does tell me management is not signaling urgency to buy the stock at current levels. In a name where the operating case is already strong, insider selling is a caution flag rather than a decisive negative.
Comparable Analysis
Growth
| Company | Revenue TTM (USD Mil) | Revenue Growth YoY % | Diluted EPS TTM |
|---|---|---|---|
| EQT | 9,364.1 | 49.9% | 5.3 |
| AR | 5,625.7 | 34.3% | 3.1 |
| DVN | 16,003 | -0.8% | 3.6 |
| RRC | 3,210 | 26.1% | 3.8 |
| CNX | 2,237.8 | 28.2% | 7.5 |
Source: Yahoo Finance
EQT’s 49.9% TTM revenue growth is well ahead of AR at 34.3%, RRC at 26.1%, CNX at 28.2%, and DVN at -0.8%. EBITDA growth is also stronger than most of the group, which supports the view that EQT is gaining scale faster than peers rather than just riding price. The key caveat is that this pace is partly rebound-driven, so I would not assume it is a permanent growth rate.
Valuation
| Company | Trailing P/E | Forward P/E | EV/Revenue | EV/EBITDA | Price/Sales (TTM) | Price/Book (mrq) | Beta (5Y Monthly) | FCF Yield % (TTM) | Forward EPS | Analyst Target Price – Low | Analyst Target Price – Mean | Analyst Target Price – High | # Analyst Opinions |
|---|---|---|---|---|---|---|---|---|---|---|---|---|---|
| EQT | 9.3 | 11.7 | 4.3 | 5.2 | 3.3 | 1.2 | 0.55 | 8.2% | 4.2 | 57 | 68.1 | 79 | 25 |
| AR | 10.8 | 7.7 | — | — | 1.8 | 1.3 | 0.33 | 6.1% | 4.3 | 38 | 48.9 | 59 | 20 |
| DVN | 12.1 | 8.1 | 2.1 | 4.9 | 3.1 | 1.7 | 0.43 | 3.2% | 5.4 | 44 | 59.9 | 68 | 26 |
| RRC | 9.5 | 8.5 | 2.9 | 5.5 | 2.6 | 1.8 | 0.41 | 6.5% | 4.2 | 36 | 45.7 | 57 | 22 |
| CNX | 4.3 | 7.7 | 3.2 | 3.2 | 2 | 1 | 0.58 | 9.0% | 4.2 | 32 | 38.5 | 49 | 11 |
Source: Yahoo Finance
EQT’s 4.3x EV/revenue and 9.3x trailing P/E sit above CNX’s 3.2x and 4.3x, but below the richer end of the group on a cash-yield basis, with an 8.2% FCF yield versus AR’s 6.1%, RRC’s 6.5%, and DVN’s 3.2%. That combination matters because EQT’s faster growth is not coming at a bargain multiple, yet the stock is also not priced like the most expensive peer on cash generation. A -$0.85 investment a year ago would now be worth $0.89 in AR, $1.31 in DVN, $0.91 in RRC, and $0.91 in CNX, so the market has not rewarded EQT’s operating progress as much as it has rewarded DVN’s. On that basis, EQT looks fairly valued to slightly expensive relative to peers, especially once its leverage is already low enough that the market is not paying for balance-sheet repair.
Profitability
| Company | Operating Margin (TTM) | Net Margin (TTM) | Return on Assets (TTM) | Return on Equity (TTM) | Gross Margin (TTM) | EBITDA Margin (TTM) |
|---|---|---|---|---|---|---|
| EQT | 57.4% | 35.1% | 7.7% | 13.4% | 81.0% | 81.9% |
| AR | 36.5% | 17.1% | 5.9% | 12.8% | 67.2% | 38.0% |
| DVN | 6.9% | 14.2% | 6.1% | 15.2% | 46.9% | 42.0% |
| RRC | 44.3% | 28.1% | 10.9% | 21.1% | 52.5% | 52.5% |
| CNX | 60.7% | 52.7% | 11.0% | 28.1% | 74.8% | 97.5% |
Source: Yahoo Finance
EQT’s 57.4% operating margin and 81.9% EBITDA margin are ahead of AR, DVN, and RRC, while CNX is the only peer with a higher operating margin at 60.7%. Gross margin at 81.0% is also best in the group, which tells me EQT’s edge is not just overhead control but a lower-cost asset base. ROE of 13.4% and ROA of 7.7% are solid, though not best-in-class, so the company is winning on margin structure more than on capital efficiency.
Leverage
| Company | Total Debt/Equity % (mrq) | Current Ratio (mrq) | Net Debt/EBITDA (TTM) | FCF Margin % (TTM) |
|---|---|---|---|---|
| EQT | 20.8 | 0.7 | 0.7 | 26.7% |
| AR | 57.8 | 0.4 | — | 11.3% |
| DVN | 56.4 | 1 | 1 | 10.0% |
| RRC | 21.3 | 0.6 | 0.6 | 17.3% |
| CNX | 54.8 | 0.5 | 1.2 | 18.3% |
Source: Yahoo Finance
EQT’s 0.7x net debt/EBITDA is better than DVN’s 1.0x and CNX’s 1.2x, while RRC’s 0.6x is slightly lower. Debt to equity at 20.8% is also far below AR’s 57.8% and DVN’s 56.4%, which reinforces the point that EQT’s balance sheet is cleaner than most of the group. The leverage advantage lines up with the valuation discussion: the stock deserves some premium for safety and cash conversion, but not enough for me to call it cheap.
Conclusion
I would put my rating as a Hold because the core tension is between strong cash generation and a valuation that already captures much of it. EQT has the margins, the balance sheet, and the asset base to keep compounding, but the 0.66 current ratio and the one-sided insider selling keep me from treating the setup as low-risk. The bull case is straightforward: if quarterly revenue stays above $3B and levered free cash flow stays above $2B, meaning the business keeps generating cash after capex and interest, I would move more constructive and start leaning toward a Buy. The bear case is just as clear: if revenue falls back below $2.5B or net debt to EBITDA moves back above 1.0x, meaning the balance sheet is no longer comfortably covered by cash flow, I would step back toward a Sell view. For now, I think the cash flow is real enough to support the stock, but not strong enough to justify a more aggressive call.
What’s your take? I rated EQT (EQT) HOLD above — but the goal here is to get this right, not just to publish an opinion. What would you add to this analysis, or which risk or catalyst do you think I’m under- or over-weighting? Tell me in the comments.
Sources
- SEC 10-K Annual Report — filed 2026-02-18
- SEC 8-K Filing (2026-04-21)
- SEC 8-K Filing (2026-04-15)
- SEC 8-K Filing (2026-04-14)
- SEC 8-K Filing (2026-03-24)
- SEC 8-K Filing (2026-03-10)
- SEC 8-K Filing (2026-02-17)
- SEC Form 4 Insider Transaction (2026-04-29)
- SEC Form 4 Insider Transaction (2026-04-28)
- SEC Form 4 Insider Transaction (2026-04-28)
- SEC 10-K Annual Report — FY2026
- SEC 10-K Annual Report — FY2025
- SEC 10-K Annual Report — FY2024
- SEC 10-K Annual Report — FY2023
- SEC 10-K Annual Report — FY2022
Data sourced from Yahoo Finance and SEC EDGAR. Not investment advice.
Leave a Comment