
Executive Summary
Rating: SELL | TPL
Measured from adjusted close on 2026-07-13 to 2026-10-09. Sell ratings are correct when the stock falls; Hold is tracked as a +/-10% range. Daily-close data, not intraday. Calls are tracked for 182 days from publication, then frozen as a final record.
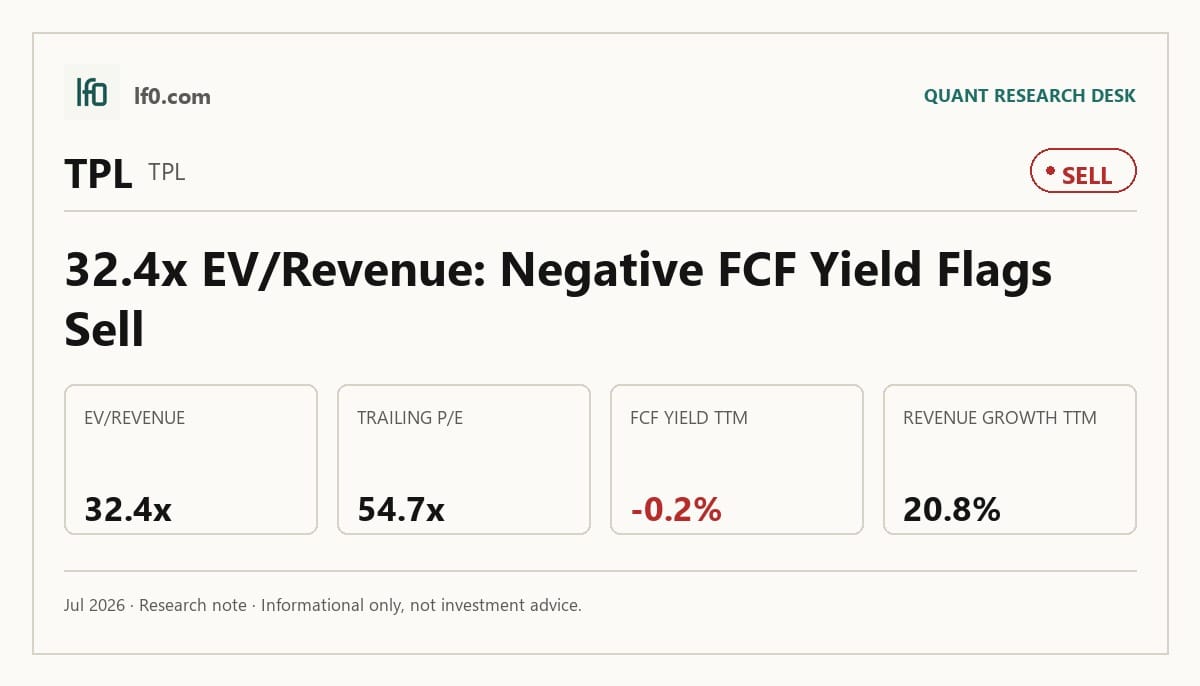
I would put my rating as a Sell because Texas Pacific Land’s operating quality is excellent, but the stock already prices in a long runway of flawless execution. TTM EBITDA margin was 82.3% and net margin was 60.0%, so the business still converts a very large share of revenue into profit, yet EV/Revenue of 32.4x and EV/EBITDA of 39.4x leave little room for disappointment if Permian activity softens. I feel the market is already paying for that durability, which is why the setup looks stretched rather than merely rich. I would move toward a Hold only if quarterly revenue stays above $225M, roughly the Q1 2026 run rate, and levered free cash flow turns positive, meaning the premium multiple is being backed by cash rather than just margin quality.
Company Profile
Texas Pacific Land Corporation is a Delaware corporation and one of the largest landowners in Texas, with about 882,000 surface acres and roughly 224,000 net royalty acres, mostly in the Permian Basin. It earns revenue from oil and gas royalties, easements, land and material sales, water sourcing and produced water treatment, and commercial leases tied to drilling, pipelines, power lines, and processing facilities. The business began in 1888 as Texas Pacific Land Trust, formed to hold land formerly owned by the Texas and Pacific Railway Company, and it became Texas Pacific Land Corporation through a corporate reorganization completed on January 11, 2021. In 2025, it added 8,147 acres in Martin County for $314M and 17,306 net royalty acres for $450.7M, while also investing $50M in Bolt Data & Energy, Inc. to support data center and energy infrastructure development. It is listed on the New York Stock Exchange under TPL and had 114 full-time employees at December 31, 2025.
Economic Moat
Business Model
The royalty and surface estate across approximately 882,000 surface acres, plus approximately 224,000 NRA, is the part of Texas Pacific Land’s model I feel is hardest for a well funded competitor to replicate within 3 years, because those rights sit on legacy land positions in the Permian Basin and cannot be recreated quickly through capital alone. According to their SEC 10-K, that footprint generates revenue across the full well life cycle: fixed fees and caliche during infrastructure buildout, sourced water and treated produced water during drilling and completion, and royalty income, saltwater disposal, easements, commercial leases, and temporary permits during production. I also view the 30-plus-year easement terms, with 10-year renewals and CPI escalators, as a secondary moat element because they create long-dated, contract-based cash flows that reset upward over time. The Water Services and Operations segment adds another layer, since TPWR can source, treat, and dispose of water from the same land base, which makes the surface estate more valuable than a passive royalty book.
The business has become more diversified over the last five years. In 2022 and 2023, the model was still centered on roughly 880,000 surface acres and about 4,000 additional NRA, with the business mainly monetizing royalties, easements, and water tied to oilfield activity. The 2021 corporate reorganization from Texas Pacific Land Trust into Texas Pacific Land Corporation was the structural pivot, and since 2016 the company has expanded beyond legacy land and royalty income into Water Services and Operations. In 2024, it added commercial revenue from a nonhazardous oilfield solids waste disposal site, and in 2025, it bought 177 NRA in March, 787 acres in Reeves County in May, 8,147 acres in Martin County in September, and 17,306 NRA in November, while also investing $50M in Bolt Data & Energy, Inc. to support large-scale data center campuses. It also advanced Transmissive Water Services, LLC, a wholly owned subsidiary developing produced-water desalination and treatment, with a Phase 2B facility targeted for completion by the end of the first half of 2026. In my view, the business is structurally stronger than 5 years ago because it has moved from a pure land and royalty holder to a broader infrastructure and water platform with more ways to monetize the same acreage.
Business & Operating Risks
The biggest disclosed risk is the company’s dependence on oil and gas prices, because royalties fall directly when prices fall and operators can also slow drilling. According to the risk factors in their SEC 10-K, “decreases in such prices for oil and gas negatively impact the revenue realized on our oil and gas royalties,” and lower prices can also lead to “decreased exploration and development activity” by the operators on whose acreage the company depends. That is not hypothetical boilerplate for this business: the financial data in this article already shows the sensitivity, since royalty cash flow is tied to commodity-linked activity rather than a fixed contract stream, so a weaker oil tape would hit both realized pricing and future volumes. The second risk is third-party control over production, which means the company cannot force operators to invest when wells age or when capital budgets tighten. The filing is explicit that “the owners and operators of the oil and gas wells make all decisions,” so the company is exposed to operator discretion, and the financial data suggests this is material because the revenue base can weaken even if the company itself executes well. A third risk is reserve estimation error. According to their SEC filings, proved developed producing reserves rely on assumptions about “future oil, gas, and NGL prices,” “production rates,” and “water encroachment or mechanical failures,” and the company notes that some estimates were made without a lengthy production history. If those assumptions prove wrong, reserve value and future cash flow estimates can move materially, which matters because investors are paying for long-lived royalty cash flows. The water business adds a newer and more visible risk. The filing says TPWR faces “pricing pressure driven by new competition,” “increased regulation,” and uncertainty around “outsourced third-parties providing water treatment services,” while the Texas Railroad Commission has begun implementing seismic response areas, including the January 2024 suspension of deep injections in Culberson and Reeves counties. That language is more specific than the older royalty-only risk set, and it is already showing up in the numbers because the article’s financial data points to reduced development pacing and customer discretion affecting results. The produced-water desalination project is another capital risk, since the filing warns that project costs may exceed estimates due to inflation, supply chain constraints, labor and equipment availability, and regulatory requirements. The company also disclosed a $50M minority investment in Bolt in December 2025, which adds execution and control risk because the company lacks full control over the outcome. By contrast, older filings in 2022 and 2023 were much narrower, centered mainly on oil and gas price volatility and third-party operator dependence, while the current 2026 filing adds water regulation, desalination execution, cyber risk, activism, and capital allocation complexity. The COVID-19 language that appeared in 2022 has disappeared, which shows the risk set has shifted from pandemic disruption to a broader mix of commodity, regulatory, and project-execution exposures. I would call the disclosed risk profile a material bear signal, because the current filing layers new operating and regulatory risks on top of the unchanged commodity dependence. The disclosed risks do not break the moat, but they do test whether the land base can keep earning premium returns if commodity activity and water economics both soften.
Management Discussion & Analysis
Management is signaling a capital-allocation tilt toward buybacks and special dividends only after it rebuilds cash to a $700M target, while still funding growth through a new $500M Credit Facility that matures on October 23, 2029 and can be expanded by up to $250M. That combination says the balance sheet is being kept flexible for acquisitions, water infrastructure, and opportunistic transactions, but investors should not read the facility as a need for leverage because no draws were outstanding at December 31, 2025 and the company still had $144.8M of cash and cash equivalents. The largest 2025 deployment was the $450.7M all-cash purchase of 17,306 NRA in November 2025, plus a $50M minority investment in Bolt, a strategic agreement to develop large-scale data center campuses and supporting infrastructure across the land base. I read those moves as a deliberate attempt to monetize the surface footprint beyond commodity royalties, but the current-year numbers only partly support the narrative because oil and gas royalty revenue rose 10.3% to $411.7M in 2025 even as average realized prices fell 14.3% to $34.18 per Boe, which means volume and active land management are doing the work, not price. The desalination and treatment project is the clearest operating investment, with $45.5M spent cumulatively through December 31, 2025 and an initial 10,000 barrels of water per day test facility expected in the first half of 2026, so investors should view it as an option on produced-water monetization rather than an immediate earnings driver.
Prior filings were broadly consistent with the current strategy, but not always with the pace of execution. In 2024’s 10-K, management emphasized surface and royalty income growth and the water platform, and 2025 results confirmed that direction with water sales up 12.6% to $169.7M and produced water royalties up 19.3% to $124.2M in 2025, so the operating thesis was validated. The more important credibility test is capital allocation: in 2024, the company returned $347.3M through dividends, including a $3.33 special dividend, while in 2025 it returned $147.8M of dividends and repurchased only $8.4M of stock, which shows a clear shift from one-off payout to retaining cash for acquisitions and infrastructure. Tone and numbers were aligned in prior years because management consistently framed the business as volatile but advantaged by Permian exposure, and the 2025 results still fit that framing rather than contradicting it. Management is actively responding to the risks above by diversifying into water, infrastructure, and data-center-related land use, but the capital intensity of those moves means the market still has to watch execution, not just strategy.
Recent Events
The most significant development I see is the May 5, 2026 Board Representative Agreement with Horizon Kinetics, disclosed on May 6, 2026, which gave Horizon the right to nominate Peter Doyle to the board and placed him on the strategic acquisitions committee. In my view, that strengthens governance and signals that a large shareholder is now closer to capital allocation decisions, which should support the company’s asset-light land and royalty model if the board keeps discipline on acquisitions.
A second, more mixed signal came on April 9, 2026, when the company disclosed the death of director Murray Stahl. That is a governance loss, but the May 5, 2026 appointment of Peter Doyle partly offsets it by adding an experienced investor with direct board and acquisitions oversight. I read that sequence as a continuity event rather than a strategic reset, so it does not weaken the thesis on its own.
The February 18, 2026 and May 18, 2026 filings were routine earnings and investor-presentation updates, not new operating events. Recent 8-K disclosures therefore modestly strengthen the investment case through governance alignment, while leaving the core business thesis materially unchanged.
Financial Analysis
Growth
TPL — Financial Growth (Quarterly, USD Mil)
| Metric | 2025-03-31 | 2025-06-30 | 2025-09-30 | 2025-12-31 | 2026-03-31 |
|---|---|---|---|---|---|
| REVENUE (USD Mil) | 196 | 187.5 | 203.1 | 211.6 | 236.8 |
| EBIT (USD Mil) | 154.4 | 143.8 | 149.1 | 168.1 | 184.6 |
| EBITDA (USD Mil) | 166.3 | 157.4 | 164.1 | 190 | 198.6 |
| NET INCOME (USD Mil) | 120.7 | 116.1 | 121.2 | 123.3 | 142.9 |
| DILUTED EPS | 1.7 | 1.7 | 1.8 | 1.8 | 2.1 |
Source: Yahoo Finance — Quarterly Financial Statements
Revenue moved from $196M in Q1 2025 to $187.5M in Q2 2025, then to $203.1M, $211.6M, and $236.8M by Q1 2026. That path is not a straight acceleration, but the Q2 dip was followed by three consecutive gains, and Q1 2026 revenue was up 20.8% year over year. EBITDA rose to $198.6M and net income reached $142.9M in Q1 2026, so earnings growth is tracking slightly behind revenue rather than outrunning it. I read that as healthy operating leverage, not a one-quarter spike, and it is consistent with the moat described above because the same acreage can generate more revenue without a proportional increase in cost.
Profitability
TPL — Profitability (TTM)
| Metric | TTM |
|---|---|
| Operating Margin (TTM) | 77.2% |
| Net Margin (TTM) | 60.0% |
| Return on Assets (TTM) | 25.2% |
| Return on Equity (TTM) | 36.5% |
| Gross Margin (TTM) | 93.2% |
| EBITDA Margin (TTM) | 82.3% |
Source: Yahoo Finance — Trailing Twelve Months (TTM)
TTM gross margin of 93.2% and EBITDA margin of 82.3% show Texas Pacific Land’s revenue base is still extremely asset-light, so the core business is not struggling at the cost-of-sales layer. The bigger gap is between EBITDA margin and TTM operating margin of 77.2%, which implies only a modest drag from depreciation, amortisation, and other operating costs. TTM net margin of 60.0% confirms that most of each dollar of revenue still falls through to the bottom line, which is what investors should weight most heavily for a royalty and surface-rights business. TTM ROA of 25.2% and TTM ROE of 36.5% are both very high, and the ROE premium over ROA suggests returns are being amplified by an efficient capital structure rather than by leverage alone. The key watch item is whether operating margin stays above 75.0%, meaning the earnings base remains intact even if commodity-linked revenue swings quarter to quarter.
Valuation
TPL — Valuation Multiples
| Metric | Value |
|---|---|
| Market Cap (USD Mil) | 27,439 |
| Enterprise Value (USD Mil) | 27,210 |
| Trailing P/E | 54.6 |
| Forward P/E | 5.4 |
| Price/Sales (TTM) | 32.7 |
| Price/Book (mrq) | 17.6 |
| EV/Revenue | 32.4 |
| EV/EBITDA | 39.4 |
| Beta (5Y Monthly) | 0.59 |
| FCF Yield % (TTM) | -0.2% |
| Forward EPS (USD) | 73.1 |
| Analyst Target Price – Low (USD) | 248 |
| Analyst Target Price – High (USD) | 639 |
| # Analyst Opinions | 2 |
Source: Yahoo Finance
Texas Pacific Land trades at 32.4x EV/Revenue, 32.7x price/sales, 54.6x trailing P/E, and 5.44x forward P/E. The spread between trailing and forward earnings multiples tells me the market is pricing in a sharp earnings reset from the current run rate, not a stable one, while EV/EBITDA of 39.4x is rich even for an asset-light royalty model. FCF yield is -0.2%, and levered free cash flow was -$56.1M TTM, so the equity is not being supported by cash generation today. With market cap of $27.4B, enterprise value of $27.2B, and 69.0M shares outstanding, the implied share price is about $397.9, which sits well above book value per share of $22.6 and cash per share of $3.6.
On the analysis here, I would put fair value in a wide range of roughly $250-$400 per share. That range sits below the $248-$639 analyst target band only at the top end, and with just 2 analyst opinions I do not think there is a meaningful consensus to anchor to; the small sample is too thin to treat as a real market view. I would also frame forward EPS around $70-$75, which is close to the table’s 73.1 and implies the market is paying a premium for a business that already earns exceptional margins rather than for a step-change in earnings power. Relative to peers, that EPS level looks expensive on a like-for-like basis because TPL’s profitability is already high, yet the stock still trades at a much richer multiple than the group. The valuation picture is a bear signal because the stock already prices in exceptional profitability while cash flow is negative.
Leverage
TPL — Leverage & Coverage (Quarterly)
| Metric | Value |
|---|---|
| Total Debt/Equity % (mrq) | 1.2 |
| Current Ratio (mrq) | 4.2 |
| Levered Free Cash Flow (TTM, USD Mil) | -56.1 |
| Net Debt/EBITDA (TTM) | -0.3 |
| FCF Margin % (TTM) | -6.7% |
Source: Yahoo Finance — Quarterly Financial Statements
TPL’s balance sheet is conservative. Total Debt/Equity % (mrq) was 1.2%, Current Ratio (mrq) was 4.2, and Total Debt (mrq) was $18M, while Total Cash (mrq) was $247.6M, so the company is in a net cash position rather than a net debt position. Net Debt/EBITDA (TTM) was -0.3x, which means cash exceeds debt and refinancing risk is minimal in the near term. Operating Cash Flow (TTM) was $551.2M, but Levered Free Cash Flow (TTM) was -$56.1M and FCF Margin % (TTM) was -6.7%, so EBITDA is not fully converting into free cash after capital needs. In my opinion, this is low refinancing risk because liquidity is ample and debt is immaterial, but the negative free cash flow means cash generation is less flexible than the operating cash figure alone suggests. The balance sheet is a bull signal: leverage is negligible, liquidity is strong, and the only real watch item is whether sustained negative free cash flow persists.
Insider Activity
The insider transaction record I see here is dominated by one 10%+ owner, Horizon Kinetics Asset Management L, with repeated open-market purchases and no open-market sales in the recent window. The sample is limited in breadth because the activity shown is concentrated in a single insider, but the broader filing set still points to net selling overall, with 578 purchases versus 47 sales over 2024-08-02 to 2026-06-05. In my view, that makes the signal mixed at the margin but still weak for alignment, because the recent buying is narrow and does not offset the broader net-selling trend.
Comparable Analysis
Growth
| Company | Revenue TTM (USD Mil) | Revenue Growth YoY % | EBITDA TTM (USD Mil) | Diluted EPS TTM |
|---|---|---|---|---|
| TPL | 839 | 20.8% | 690.2 | 7.3 |
| FANG | 14,459 | 4.2% | 10,149 | 1 |
| VNOM | 1,578 | 109.1% | 1,502 | -0.6 |
| BSM | 410.2 | 8.5% | 346.8 | 1.3 |
| PAA | 45,255 | 8.7% | 2,362 | 1.1 |
| KNTK | 1,731.1 | -7.5% | 560.6 | 2.5 |
Source: Yahoo Finance
TPL’s revenue growth of 20.8% TTM is far ahead of FANG at 4.2% and PAA at 8.7%, while VNOM’s 109.1% growth is coming off a much smaller base and is paired with negative TTM EPS of -0.6. That matters because TPL is pairing faster growth with $690.2M of EBITDA TTM, so the company is converting growth into cash earnings rather than just expanding acreage or headline revenue.
Valuation
| Company | Trailing P/E | Forward P/E | EV/Revenue | EV/EBITDA | Price/Sales (TTM) | Price/Book (mrq) | Market Cap (USD Mil) | Enterprise Value (USD Mil) | Beta (5Y Monthly) | FCF Yield % (TTM) | Forward EPS | Analyst Target Price – Low | Analyst Target Price – High | # Analyst Opinions |
|---|---|---|---|---|---|---|---|---|---|---|---|---|---|---|
| TPL | 54.6 | 5.4 | 32.4 | 39.4 | 32.7 | 17.6 | 27,439 | 27,210 | 0.59 | -0.2% | 73.1 | 248 | 639 | 2 |
| FANG | 189.1 | 10.6 | 4.9 | 7 | 3.6 | 1.4 | 51,590 | 71,481 | 0.41 | 2.7% | 17.4 | 186 | 272 | 28 |
| VNOM | — | 17.2 | 9.5 | 10 | 9.6 | 1.6 | 15,132 | 14,989 | 0.27 | -6.9% | 2.4 | 46 | 65 | 18 |
| BSM | 10.9 | 12.1 | 8.3 | 9.8 | 7.2 | 3.8 | 2,935 | 3,410 | 0.02 | 3.2% | 1.1 | 16 | 16 | 1 |
| PAA | 20.6 | 11.5 | 0.7 | 13.9 | 0.4 | 2.1 | 16,150 | 32,812 | 0.47 | 6.9% | 2 | 20 | 27 | 18 |
| KNTK | 19.3 | 28.8 | 6.9 | 21.3 | 4.7 | -2 | 8,077 | 11,955 | 0.78 | -1.5% | 1.7 | 48 | 61 | 14 |
Source: Yahoo Finance
On a value lens, TPL’s FCF yield of -0.2% TTM is weaker than FANG’s 2.7%, BSM’s 3.2%, PAA’s 6.9%, and KNTK’s -1.5%, which tells me TPL is not cheap on cash generation despite its scale. Its EV/Revenue of 32.4x and P/S of 32.7x also sit far above FANG at 4.9x EV/Revenue and 3.6x P/S, VNOM at 9.5x and 9.6x, BSM at 8.3x and 7.2x, PAA at 0.7x and 0.4x, and KNTK at 6.9x and 4.7x, so the market is pricing in a much longer runway for TPL’s cash flows. Using peer EV/Revenue ranges on TPL’s $839M TTM revenue gives an illustrative enterprise value of about $571M to $7.9B, or roughly $8.3 to $113.8 per share after net cash, which is far below the current $397.9 share price and shows how much premium the stock already embeds. That premium is harder to justify when I compare it with the leverage table, because TPL’s balance sheet is already cleaner than most peers, so the market is paying for quality and margin durability rather than for financial risk reduction.
Profitability
| Company | Operating Margin (TTM) | Net Margin (TTM) | Return on Assets (TTM) | Return on Equity (TTM) | Gross Margin (TTM) | EBITDA Margin (TTM) |
|---|---|---|---|---|---|---|
| TPL | 77.2% | 60.0% | 25.2% | 36.5% | 93.2% | 82.3% |
| FANG | 5.8% | 2.0% | -0.1% | 0.5% | 72.2% | 70.2% |
| VNOM | 55.9% | -2.9% | 5.2% | -1.8% | 100.0% | 95.2% |
| BSM | 14.2% | 72.5% | 14.9% | 27.8% | 88.3% | 84.6% |
| PAA | 2.8% | 2.5% | 3.0% | 10.4% | 5.9% | 5.2% |
| KNTK | -0.9% | 29.0% | 1.5% | 17.5% | 40.8% | 32.4% |
Source: Yahoo Finance
TPL’s gross margin of 93.2% and EBITDA margin of 82.3% are well above FANG’s 72.2% and 70.2%, BSM’s 88.3% and 84.6%, PAA’s 5.9% and 5.2%, and KNTK’s 40.8% and 32.4%. The gap looks structural, not cyclical, because TPL’s land and surface-rights model carries almost no cost of revenue, while peers tied to production, transport, or processing have much lower margin ceilings. TPL’s ROE of 36.5% and ROA of 25.2% also lead the group, which tells me the premium valuation is being anchored to real profitability rather than just to scarcity value.
Leverage
| Company | Total Debt/Equity % (mrq) | Current Ratio (mrq) | Operating Cash Flow TTM (USD Mil) | Free Cash Flow TTM (USD Mil) | Net Debt/EBITDA (TTM) | FCF Margin % (TTM) |
|---|---|---|---|---|---|---|
| TPL | 1.2 | 4.2 | 551.2 | -56.1 | -0.3 | -6.7% |
| FANG | 32.6 | 0.6 | 8,231 | 1,397.2 | 1.4 | 9.7% |
| VNOM | 15.5 | 6.2 | 1,180 | -1,046.6 | 1 | -66.3% |
| BSM | 17.4 | 2.3 | 307.9 | 95.5 | 0.5 | 23.3% |
| PAA | 90.3 | 0.9 | 2,715 | 1,107.5 | 4.8 | 2.5% |
| KNTK | 136.8 | 0.6 | 607.7 | -117.9 | 6.9 | -6.8% |
Source: Yahoo Finance
TPL’s total debt/equity of 1.2% and net debt/EBITDA of -0.3x are cleaner than FANG’s 32.6% and 1.4x, VNOM’s 15.5% and 1.0x, PAA’s 90.3% and 4.8x, and KNTK’s 136.8% and 6.9x. The negative net debt/EBITDA is the key signal here because TPL is effectively cash-rich, so the balance sheet is a support for valuation rather than a constraint. That lower leverage helps explain part of the valuation premium versus peers, but it does not fully explain why TPL trades so far above the group on EV/Revenue.
Conclusion
I would put my rating as a Sell because the core tension is now clear: Texas Pacific Land’s moat and margins are real, but the stock already discounts them at a level that leaves little margin for error. The business is still exceptional, and the financials confirm that the land base and water platform are producing high returns, yet the valuation is already stretched at 32.4x EV/Revenue and 39.4x EV/EBITDA while levered free cash flow remains negative.
I would raise my rating more toward a Hold if quarterly revenue stays above $225M, roughly the Q1 2026 run rate, and levered free cash flow turns positive, meaning the current scale is producing cash after capital spending rather than just accounting earnings. I would also want to see EBITDA hold near $190M to $200M for a few quarters, because that would show the premium multiple is being supported by durable operating performance rather than a single strong period. If those thresholds are met, the market would have evidence that the water and surface platform is compounding in a way that can justify more of the current price.
I would move from Sell to Hold if oil and gas royalty revenue weakens for two consecutive quarters and levered free cash flow stays negative, because that would show the valuation is still ahead of the cash generation. If quarterly revenue slips back toward the $190M to $200M range while EBITDA falls below $170M, the implied cash conversion would no longer support a 39.4x EV/EBITDA multiple, and the stock would start to look like a premium asset with a fading growth rate. That is the bear case I would watch most closely, because it would mean the moat is intact but the numbers are no longer keeping up with the price.
Weighing both sides, I think the bull case is more likely to show up first because the company has already demonstrated it can add acreage, expand water services, and keep margins near 80% EBITDA. Even so, the current price already gives that execution a lot of credit, so I am not ready to pay up further until I see free cash flow stop lagging operating cash flow.
What’s your take? I rated Texas Pacific Land (TPL) SELL above — but the goal here is to get this right, not just to publish an opinion. What would you add to this analysis, or which risk or catalyst do you think I’m under- or over-weighting? Tell me in the comments.
Sources
- SEC 10-K Annual Report — filed 2026-02-18
- SEC 8-K Filing (2026-05-18)
- SEC 8-K Filing (2026-05-06)
- SEC 8-K Filing (2026-04-09)
- SEC 8-K Filing (2026-02-18)
- SEC Form 4 Insider Transaction (2026-06-08)
- SEC Form 4 Insider Transaction (2026-06-05)
- SEC Form 4 Insider Transaction (2026-06-04)
- SEC 10-K Annual Report — FY2026
- SEC 10-K Annual Report — FY2025
- SEC 10-K Annual Report — FY2024
- SEC 10-K Annual Report — FY2023
- SEC 10-K Annual Report — FY2022
Data sourced from Yahoo Finance and SEC EDGAR. Not investment advice.
Leave a Comment