
Executive Summary
Rating: SELL | MTZ
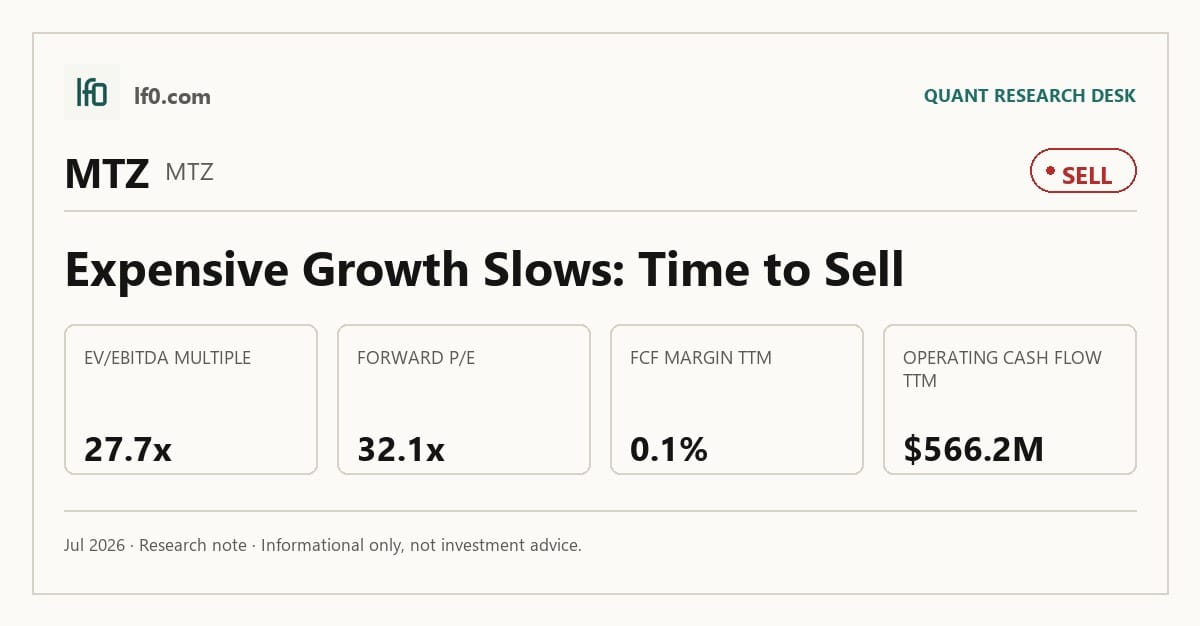
I would put my rating as a Sell because MasTec’s 34.5% TTM revenue growth is real, but the market is already pricing in a much cleaner margin and cash conversion path than the business has delivered. The stock trades at 27.7x EV/EBITDA and 32.1x forward P/E, while TTM FCF margin is only 0.1%, so the valuation assumes operating leverage that is not yet visible in the cash flow. In my view, the key tension is that the platform is broad and well positioned, yet the latest quarter showed EBITDA down to $256.8M from $361.6M in Q3 2025. I would move from Sell toward Hold only if operating margin moves materially above 3.7%, meaning the gross profit is finally flowing through to cash rather than being absorbed by project costs and overhead.
Company Profile
MasTec Inc. is a North American infrastructure engineering and construction company that builds, installs, maintains, and upgrades communications, energy, utility, and transportation assets. It earns revenue from master service agreements, which are generally multi-year contracts, and from project-specific work across wireless and wireline fiber, power transmission and distribution, renewable generation, pipelines, heavy civil work, and environmental remediation. Founded through predecessor companies more than 95 years ago, the company has shifted its mix toward low-carbon energy since 2021, adding scale in renewable energy, power delivery, heavy civil, and telecommunications through acquisitions. As of December 31, 2025, it operated 810 locations and employed about 36,000 people, mostly in the United States. MasTec is listed on the New York Stock Exchange under MTZ and has maintained investment-grade credit since 2021, supported by a $1.9B revolving credit facility and a single class of common stock.
Economic Moat
Business Model
MasTec’s most defensible edge is the ability to bundle communications, power delivery, clean energy, pipeline, and heavy civil work under one operating platform, then move crews, equipment, and project managers across those end markets as demand shifts. In my view, a well-funded competitor would struggle to copy that breadth within 3 years because the company already had about 36,000 employees and 810 locations as of December 31, 2025, and it supports that footprint with multi-year master service and other service agreements that covered 44.0% of 2025 revenue. That mix gives MasTec recurring access to work orders without rebuilding customer relationships from scratch, which is why the platform matters more than any single project win. A secondary moat is scale and reputation: it ranks among the top five contractors in Engineering News Record’s Top 400 Contractors, and that standing helps it stay on bid lists for large, complex jobs where customers value execution history. I also see some protection from the integrated service model, because customers increasingly want one contractor that can handle engineering, installation, maintenance, and emergency restoration across related infrastructure systems.
The 2021 transformation into renewable energy, power delivery, heavy civil, and telecommunications made the model broader and less dependent on any single end market, and the 2025 segment rework that moved utility operations from Communications into Power Delivery reinforced that shift. Clean energy revenue rose from about $300M in 2017 to about $4.7B in 2025, which shows the strategy has scaled rather than remaining a slide-deck ambition. That matters for the moat because a larger installed operating base and more end-market diversity make it harder for a smaller rival to match MasTec’s reach or redeploy labor as quickly.
Business & Operating Risks
The biggest current risk is policy and funding exposure: according to the risk factors in their SEC 10-K, changes to permitting, tax incentives, government funding programs, and spending policies, plus the July 2025 OBBBA clean energy credit phaseout, could affect demand for services or cause delays and cancellations. That is not abstract for MasTec, because the company builds renewable energy and other infrastructure that depends on the IIJA and IRA, and the financial data already shows the sensitivity in slower clean-energy timing and uneven project flow. Tariff and trade actions are the next material overhang. The 10-K says 2025 trade actions on Canada, Mexico, the European Union, Japan, Germany, and China have increased the cost of importing steel, concrete, and solar panels, and the February 20, 2026 Supreme Court ruling on IEEPA tariffs created significant uncertainty around tariff levels and retaliation. For a contractor with fixed-price work, that can flow straight into margin compression if contract pricing cannot reset fast enough.
Project execution risk is also central. The filing warns that large-scale projects can face permitting delays, rights-of-way issues, weather, subcontractor slippage, liquidated damages, and claims that may substantially exceed the revenue associated with a project. That language fits the business model because revenue is recognized over time under the cost-to-cost method, so estimate errors can pull forward losses into the period when they are discovered. Customer concentration and backlog quality add another layer of risk: MasTec derives a significant portion of revenue from a few customers, many contracts are cancelable on short or no advance notice, and backlog is an uncertain indicator of future revenue and earnings because master service agreements do not require minimum volumes. Taken together, these risks do not break the moat, but they do pressure the very operating leverage the moat is supposed to create.
Management Discussion & Analysis
Management appears to be responding to those risks mainly through portfolio mix and operating discipline rather than a wholesale strategic reset. The 2025 segment reorganization pushed utility operations into Power Delivery, which makes the reporting structure better aligned with the end markets where the company wants to win work. That is a sensible move because it should improve accountability around the businesses most exposed to permitting, tariff, and project-timing volatility. The company is also still leaning on its multi-segment platform and master service agreements to smooth demand, which suggests management is trying to offset policy risk with more recurring work rather than chasing one-off projects.
What I do not see yet is evidence that the tariff and clean-energy timing risks have been fully neutralized. The disclosures still point to timing uncertainty, and the latest quarter shows that the business is converting revenue into EBITDA, but not yet into strong free cash flow. In my view, that means management is addressing the risks, but the numbers have not yet proven to me that the response is enough to restore clean operating leverage.
Recent Events
The April 30, 2026 earnings release was the most important recent event because it confirms MasTec is still using quarterly updates to reset expectations for 2026. I read that as a routine but important checkpoint rather than a strategic inflection, so it leaves the core thesis materially unchanged unless the underlying release showed a sharper shift in backlog or margin mix.
The May 21, 2026 annual meeting was orderly. Shareholders re-elected Ernst N. Csiszar, Julia L. Johnson, and Jorge Mas to Class I director seats, ratified PricewaterhouseCoopers LLP as auditor for fiscal 2026, and approved executive pay on an advisory basis. In my view, that signals governance continuity, not a change in capital allocation or competitive position. The February 26, 2026 8-K was another routine earnings and guidance filing for the year ended December 31, 2025, and together these disclosures show no acquisition, divestiture, financing amendment, or leadership change since the last 10-K. That leaves the moat intact, but it also means recent events have not yet provided a new catalyst to re-rate the stock.
Financial Analysis
Growth
MTZ — Financial Growth (Quarterly, USD Mil)
| Metric | 2025-03-31 | 2025-06-30 | 2025-09-30 | 2025-12-31 | 2026-03-31 |
|---|---|---|---|---|---|
| REVENUE (USD Mil) | 2,847.7 | 3,544.7 | 3,966.9 | 3,939.8 | 3,828.8 |
| EBIT (USD Mil) | 48 | 164.6 | 257.1 | 218.7 | 134.9 |
| EBITDA (USD Mil) | 156.8 | 267.3 | 361.6 | 329.7 | 256.8 |
| NET INCOME (USD Mil) | 9.9 | 85.8 | 160.7 | 142.7 | 60.8 |
| DILUTED EPS | 0.1 | 1.1 | 2 | 1.8 | 0.8 |
Source: Yahoo Finance — Quarterly Financial Statements
Revenue rose from $2.8B in Q1 2025 to $3.8B in Q1 2026, a 34.5% increase, but the run rate has flattened after the mid-2025 step-up as quarterly revenue eased from $4B in Q3 2025 to $3.9B in Q4 2025 and $3.8B in Q1 2026. EBITDA moved in the same direction, climbing from $156.8M in Q1 2025 to $256.8M in Q1 2026, yet slipping from $361.6M in Q3 2025 to $329.7M in Q4 2025 and then to $256.8M in Q1 2026. That is a useful reminder that top-line growth alone does not prove the moat is compounding; the business still has to convert scale into steadier earnings. Diluted EPS improved from 0.1 to 0.8 over the same span, but the latest quarter shows the growth engine is decelerating rather than accelerating.
Profitability
MTZ — Profitability (TTM)
| Metric | TTM |
|---|---|
| Operating Margin (TTM) | 3.7% |
| Net Margin (TTM) | 2.9% |
| Return on Assets (TTM) | 4.9% |
| Return on Equity (TTM) | 15.0% |
| Gross Margin (TTM) | 12.8% |
| EBITDA Margin (TTM) | 7.9% |
Source: Yahoo Finance — Trailing Twelve Months (TTM)
TTM operating margin of 3.7%, TTM gross margin of 12.8%, and TTM EBITDA margin of 7.9% show a business that is past the pure start-up phase, but still has a wide gap between gross profit and operating profit. That spread means overhead, project execution costs, and other operating expenses are still absorbing most of the gross profit, so investors should focus on operating leverage rather than top-line scale alone. TTM net margin of 2.94% is positive, but it sits well below EBITDA margin, which points to meaningful depreciation, amortisation, or other below-EBITDA charges that still dilute reported earnings quality. TTM return on assets of 4.94% and return on equity of 15% indicate acceptable capital efficiency, although the ROE premium over ROA suggests leverage is amplifying returns rather than the business generating them purely from asset productivity. The key test is whether operating margin can move materially above 3.7% and net margin can keep closing the gap to EBITDA margin, because that would show the platform is turning scale into durable earnings rather than just accounting profit.
Valuation
MTZ — Valuation Multiples
| Metric | Value |
|---|---|
| Market Cap (USD Mil) | 29,816 |
| Enterprise Value (USD Mil) | 33,332 |
| Trailing P/E | 66.2 |
| Forward P/E | 32.1 |
| Price/Sales (TTM) | 2 |
| Price/Book (mrq) | 8.9 |
| EV/Revenue | 2.2 |
| EV/EBITDA | 27.7 |
| Beta (5Y Monthly) | 1.79 |
| FCF Yield % (TTM) | 0.0% |
| Forward EPS (USD) | 11.8 |
| Analyst Target Price – Mean (USD) | 465.6 |
| # Analyst Opinions | 20 |
Source: Yahoo Finance
I would keep the valuation call bearish because the stock already prices in a much cleaner earnings path than the cash flow supports. MasTec trades at 66.2x trailing P/E, 32.1x forward P/E, 2.18x EV/Revenue, and 27.7x EV/EBITDA, while TTM FCF yield is 0.0% and the company’s forward EPS is 11.8. On the analysis here, I would put fair value in a wide range of roughly $300-$450 per share, with the low end reflecting only modest multiple support if cash conversion stays weak and the high end assuming margin improvement starts to show up in free cash flow. That range sits broadly around the 465.6 analyst mean across 20 opinions, but I weight the near-zero FCF yield and 0.1% TTM FCF margin more heavily than the consensus appears to. The implied EPS path is still constructive, yet it is not especially cheap relative to peers because the market is already paying for earnings that have not fully converted into cash.
Leverage
MTZ — Leverage & Coverage (Quarterly)
| Metric | Value |
|---|---|
| Total Debt/Equity % (mrq) | 88 |
| Current Ratio (mrq) | 1.3 |
| Total Debt (mrq, USD Mil) | 3,019.9 |
| Operating Cash Flow (TTM, USD Mil) | 566.2 |
| Levered Free Cash Flow (TTM, USD Mil) | 12.6 |
| Net Debt/EBITDA (TTM) | 2.3 |
| FCF Margin % (TTM) | 0.1% |
Source: Yahoo Finance — Quarterly Financial Statements
MasTec carries $3B of total debt against a total debt/equity ratio of 88.1% and a current ratio of 1.3x, so the balance sheet is levered but not stretched. Operating cash flow was $566.2M TTM and levered free cash flow was only $12.6M, which means EBITDA is converting into very little residual cash after capex, interest, and working capital. Net debt/EBITDA of 2.3x points to manageable refinancing risk today, but the 0.1% FCF margin leaves little room for error if project execution slips or if debt needs to be refinanced into a higher-rate market. In my opinion, this is a medium leverage risk because liquidity is adequate, yet the near-zero free cash flow margin means the balance sheet is not a source of flexibility.
Insider Activity
The insider transaction record is one-sided: 7 open-market sales and 0 open-market purchases across 49 Form 4 filings from 2025-02-14 to 2026-06-03. Selling is concentrated in a few directors, led by Csiszar Ernst N, rather than broad across the full insider group, which suggests weak near-term insider conviction even though insiders still own 21.5% of shares. I would not overread one quarter of selling in isolation, but it is another reason I do not want to pay a premium multiple for the stock today.
Comparable Analysis
Growth
| Company | Revenue TTM (USD Mil) | Revenue Growth YoY % | Diluted EPS TTM |
|---|---|---|---|
| MTZ | 15,280.2 | 34.5% | 5.7 |
| DY | 6,252.1 | 56.1% | 10.5 |
| PWR | 30,121.2 | 26.3% | 7.3 |
| FIX | 10,135.7 | 1.0% | 34.7 |
| STRL | 2,884.8 | 91.6% | 11.2 |
| EME | 17,747.3 | 19.7% | 29.8 |
Source: Yahoo Finance
MTZ’s revenue growth of 34.5% TTM sits above EME at 19.7% and FIX at 1.0%, but below DY at 56.1% and STRL at 91.6%, so the market is paying for a growth rate that is good, not dominant. That premium looks partly justified because MTZ’s scale is already $15.3B of revenue TTM, which makes 34.5% growth harder to sustain than STRL’s $2.9B base, but DY’s faster top line and similar infrastructure exposure show MTZ is not the only name with a strong demand backdrop.
Valuation
| Company | Trailing P/E | Forward P/E | EV/Revenue | EV/EBITDA | Price/Sales (TTM) | Price/Book (mrq) | Market Cap (USD Mil) | Enterprise Value (USD Mil) | Beta (5Y Monthly) | FCF Yield % (TTM) | Forward EPS | Analyst Target Price – Low | Analyst Target Price – Mean | Analyst Target Price – High | # Analyst Opinions |
|---|---|---|---|---|---|---|---|---|---|---|---|---|---|---|---|
| MTZ | 66.2 | 32.1 | 2.2 | 27.7 | 2 | 8.9 | 29,816 | 33,332 | 1.79 | 0.0% | 11.8 | 108 | 465.6 | 545 | 20 |
| DY | 43.2 | 22.7 | 2.7 | 20.1 | 2.2 | 7.2 | 13,594 | 16,580 | 1.50 | 2.1% | 20 | 610 | 637.3 | 700 | 11 |
| PWR | 93.2 | 41.1 | 3.6 | 41.3 | 3.4 | 11.2 | 101,510 | 109,805 | 1.22 | 1.0% | 16.5 | 420 | 761.4 | 901 | 26 |
| FIX | 51.7 | 33.5 | 6.7 | 39.2 | 6.2 | 97.7 | 63,066 | 68,115 | 1.67 | 1.7% | 53.4 | 1,910 | 2,048.2 | 2,200 | 6 |
| STRL | 64.7 | 26.8 | 8.2 | 40.7 | 7.7 | 18.7 | 22,206 | 23,665 | 1.82 | 1.6% | 27 | 884 | 941.2 | 1,000 | 6 |
| EME | 26.5 | 24.1 | 2 | 19.1 | 2 | 9.1 | 35,085 | 35,346 | 1.12 | 2.5% | 32.7 | 885 | 1,000.1 | 1,123 | 7 |
Source: Yahoo Finance
MTZ trades at 2.18x EV/Revenue, 66.2x trailing P/E, 32.1x forward P/E, and a 0.0% FCF yield TTM, while EME is at 2.0x EV/Revenue, 26.5x trailing P/E, 24.1x forward P/E, and 2.5% FCF yield, and DY is at 2.7x EV/Revenue, 43.2x trailing P/E, 22.7x forward P/E, and 2.1% FCF yield. MTZ’s 11.8 forward EPS is below DY at $20.0, EME at $32.7, and FIX at $53.4, which means the stock is not cheap on earnings power either. The valuation gap is not just about growth; it is also about cash conversion, because peers with lower multiples are producing materially better free cash flow. I would not call MTZ near the low end of the peer set on every metric, but it is clearly expensive relative to the group on the measures that matter most for this thesis.
Profitability
| Company | Operating Margin (TTM) | Net Margin (TTM) | Return on Assets (TTM) | Return on Equity (TTM) | Gross Margin (TTM) | EBITDA Margin (TTM) |
|---|---|---|---|---|---|---|
| MTZ | 3.7% | 2.9% | 4.9% | 15.0% | 12.8% | 7.9% |
| DY | 7.3% | 5.0% | 6.8% | 19.7% | 20.5% | 13.2% |
| PWR | 4.2% | 3.7% | 4.7% | 13.5% | 15.1% | 8.8% |
| FIX | 7.9% | 12.1% | 17.3% | 53.3% | 25.1% | 17.1% |
| STRL | 17.2% | 12.0% | 12.9% | 36.7% | 23.3% | 20.1% |
| EME | 8.7% | 7.5% | 11.8% | 39.2% | 19.3% | 10.4% |
Source: Yahoo Finance
MTZ’s 12.8% gross margin and 7.9% EBITDA margin trail FIX at 25.1% and 17.1%, STRL at 23.3% and 20.1%, and EME at 19.3% and 10.4%, while its 3.7% operating margin and 2.94% net margin are also below DY’s 7.3% and 5.0%. Because the gross-margin gap is large and the operating-margin gap is not much wider, this looks more like a cost-of-revenue and project mix issue than a pure opex problem. That is important because a broader platform only deserves a premium if it can translate scale into better margins, and the current data says peers are doing that more effectively.
Leverage
| Company | Total Debt/Equity % (mrq) | Current Ratio (mrq) | Total Debt (mrq, USD Mil) | Operating Cash Flow TTM (USD Mil) | Free Cash Flow TTM (USD Mil) | Net Debt/EBITDA (TTM) | FCF Margin % (TTM) |
|---|---|---|---|---|---|---|---|
| MTZ | 88 | 1.3 | 3,019.9 | 566.2 | 12.6 | 2.3 | 0.1% |
| DY | 158.2 | 2.6 | 2,998.9 | 671.9 | 288.3 | 3 | 4.6% |
| PWR | 69.1 | 1.1 | 6,319.7 | 2,378.5 | 1,037.2 | 2.2 | 3.4% |
| FIX | 45.5 | 1.2 | 303.9 | 1,663.1 | 1,099.8 | 0.1 | 10.8% |
| STRL | 28.6 | 1.1 | 342.2 | 520.7 | 346.9 | -0.3 | 12.0% |
| EME | 13.4 | 1.3 | 516.5 | 1,194.2 | 891.5 | -0.2 | 5.0% |
Source: Yahoo Finance
MTZ’s debt/equity of 88.1% is above EME at 13.4% and STRL at 28.6%, but below DY at 158.2% and FIX at 45.5%, while net debt/EBITDA of 2.3x is close to PWR at 2.2x and better than DY at 3.0x. The key difference is free cash flow: MTZ at 0.1% FCF margin is far below EME at 5.0%, DY at 4.6%, and FIX at 10.8%, so the balance sheet is not under acute stress, but it is not being rewarded with the cash generation that would justify a richer multiple. That is why the leverage profile matters to valuation as much as to solvency.
Conclusion
I would put my rating as a Sell because the bull case depends on margin expansion and cash conversion that have not yet shown up in the numbers, while the bear case only needs the already disclosed policy, tariff, and execution risks to keep delaying project flow. The latest quarter still showed $3.8B of revenue and $256.8M of EBITDA, so the business is not deteriorating in absolute terms, but the 0.1% TTM FCF margin tells me the earnings base is not yet turning into shareholder cash. I would raise my rating more toward a Hold if operating margin moved materially above 3.7% and levered free cash flow turned meaningfully positive, because that would show the 12.8% gross margin is finally flowing through to cash rather than being absorbed by project costs and overhead. I would move from Sell to Strong Sell if quarterly revenue fell back below $3.8B while EBITDA stayed near $256.8M or lower, because that would tell me the 127.2% one-year share price gain has run ahead of cash conversion and the current 27.7x EV/EBITDA would look increasingly disconnected from the earnings quality underneath it.
Weighing both sides, I lean to the cautious case because the bull scenario needs several quarters of better execution, while the bear case only needs the current mix of policy, tariff, and project-timing risk to persist. The stock can work if the 2025 platform reshaping starts to show up in free cash flow, but until that happens, I think the market is paying too much for progress that is still incomplete.
What’s your take? I rated MasTec (MTZ) SELL above — but the goal here is to get this right, not just to publish an opinion. What would you add to this analysis, or which risk or catalyst do you think I’m under- or over-weighting? Tell me in the comments.
Sources
- SEC 10-K Annual Report — filed 2026-02-26
- SEC 8-K Filing (2026-05-22)
- SEC 8-K Filing (2026-04-30)
- SEC 8-K Filing (2026-02-26)
- SEC Form 4 Insider Transaction (2026-06-05)
- SEC Form 4 Insider Transaction (2026-05-19)
- SEC Form 4 Insider Transaction (2026-05-19)
- SEC 10-K Annual Report — FY2026
- SEC 10-K Annual Report — FY2025
- SEC 10-K Annual Report — FY2024
- SEC 10-K Annual Report — FY2023
- SEC 10-K Annual Report — FY2022
Data sourced from Yahoo Finance and SEC EDGAR. Not investment advice.
Leave a Reply