Executive Summary
Rating: SELL | VSAT
Measured from adjusted close on 2026-07-13 to 2026-10-09. Sell ratings are correct when the stock falls; Hold is tracked as a +/-10% range. Daily-close data, not intraday. Calls are tracked for 182 days from publication, then frozen as a final record.
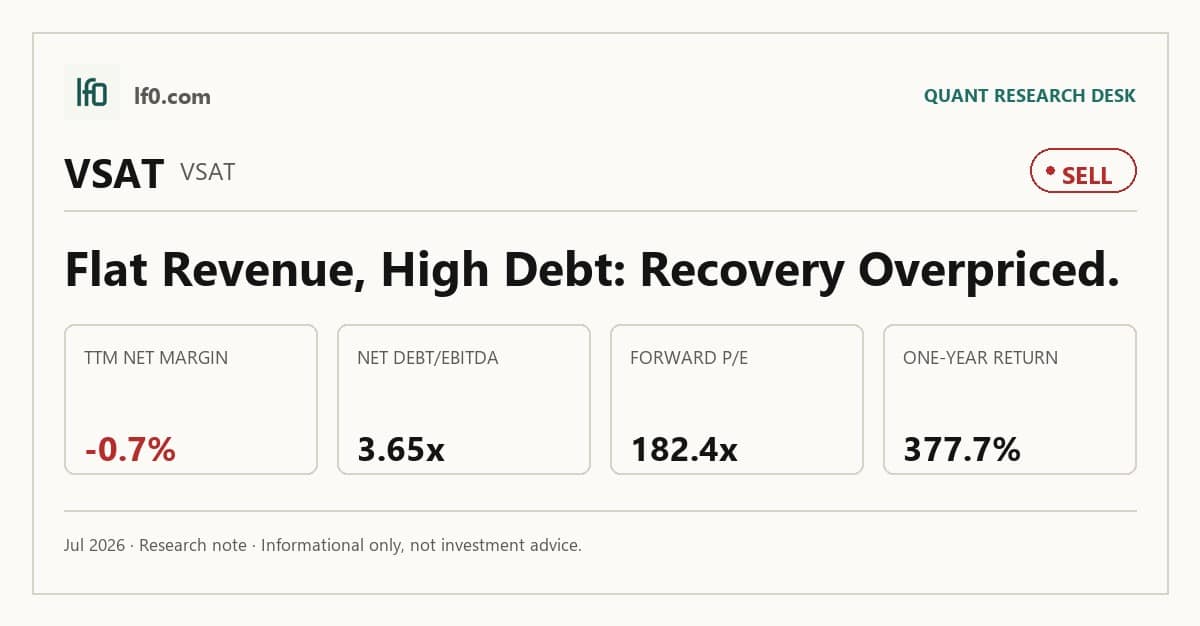
I would put my rating as a Sell because the stock already prices in a recovery that the operating data has not yet earned. Revenue was flat at $1.171B in Q1 2026, while EBITDA improved to $527.5M and net income reached $58.8M, so the business is moving in the right direction, but the 182.4x forward P/E and 3.3x EV/revenue still assume a much cleaner earnings reset than the company has delivered.
The key tension is leverage versus execution. In my view, the market is paying for margin repair and better cash conversion, yet net debt/EBITDA remains 3.7x and the company is still working through satellite and acquisition complexity. I would raise my rating toward a Hold if communication services revenue reaccelerates above $3.5B annually, which would show the aviation and government gains are finally offsetting the fixed-services drag.
Company Profile
Viasat provides satellite communications and related networking services for commercial aviation, government, maritime, and fixed broadband customers. The company earns revenue from service contracts, equipment, and development work, with a mix that depends heavily on satellite capacity, aircraft installation cycles, and government program timing.
Its business is capital intensive and long dated. New satellites can take years to plan, build, and launch, so the company’s revenue base depends on execution across a multi-year asset cycle rather than on quick product turnover.
Economic Moat
Business Model
The moat case rests on scale, orbital capacity, and long-duration customer relationships. Viasat’s installed base in aviation and government gives it recurring service revenue, and the backlog of $4.1B, with a little less than half expected to convert in the next 12 months, suggests the company still has meaningful contracted demand ahead. The ViaSat-3 program and the Inmarsat platform also support a broader network footprint, which is important because satellite operators compete on coverage, reliability, and the ability to serve high-value mobility customers.
That structural advantage is real, but it is not easy to monetize quickly. The business only compounds if new capacity comes online on time and is converted into higher-margin service revenue, so the moat depends as much on execution as on network reach.
Business & Operating Risks
The biggest disclosed risk is the $6.9B debt load as of March 31, 2026, because it limits flexibility just as Viasat is still absorbing satellite and acquisition complexity. According to the risk factors in their SEC 10-K, that leverage can require a material portion of cash flow to go to principal and interest and can make refinancing harder on commercially reasonable terms. Satellite execution risk is the next major headwind: construction delays, launch failure, orbital placement problems, and regulatory delays can all impair new satellites, and delays can also cause the company to miss milestone conditions tied to ITU filings. Competition from Starlink and terrestrial Wi-Fi and cellular services adds another layer of pressure, while cyber risk, government contract concentration, and fixed-price development work can still hit margins quickly.
Taken together, these risks do not break the moat, but they do threaten the speed at which the moat can turn into equity value. The debt burden is the clearest pressure point because it can absorb the cash flow that the network advantage is supposed to create.
Management Discussion & Analysis
Management is responding to those risks with deleveraging, tighter capital spending, and selective reinvestment. Viasat ended fiscal year 2026 with $1.7B of cash and cash equivalents, no outstanding borrowings on either revolving credit facility, and $598.2M of borrowing availability on the Viasat revolver plus $550M on the Inmarsat revolver, which gives the company liquidity but not a lot of room for a prolonged miss. The more important signal is that total outstanding indebtedness fell to $6.9B at March 31, 2026 from $7.2B a year earlier, while the company also redeemed the remaining 5.625% Senior Notes due 2025 and repaid the $300M Original Inmarsat Term Loan Facility.
Management also said fiscal year 2027 capital expenditures may be flat to slightly down versus fiscal year 2026, which tells me the integration phase is shifting from heavy buildout toward cash preservation. That matters because communication services revenue was essentially flat at $3.3B in fiscal year 2026: aviation and government growth helped, but fixed services and other declined as bandwidth was redirected toward IFC. The backlog and the expected addition of about 1,000 commercial aircraft with IFC systems support a better mix ahead, but the company still needs conversion, not just bookings, to prove the strategy is working.
Recent Events
The January 21, 2026 Export-Import Bank of the United States credit facility for ViaSat Technologies Limited, a Viasat subsidiary that will fund the ViaSat-3 F1 satellite, is the most important recent event. The $188.7M facility, with a 4.63% fixed rate and repayment starting May 25, 2026, gives the company a clearer path to finish a strategic asset that should support network capacity and long-duration service revenue. Because the loan is secured by selected subsidiary assets and carries leverage and interest coverage covenants, it also tightens discipline around execution.
Viasat also repaid the full $300M principal on Inmarsat’s original senior secured term loan in November 2025, while leaving the larger 2024 term loan in place. I read that as partial de-risking rather than full repair. The May 2026 board additions of Shekar Ayyar and Jinhy Yoon under the Cooperation Agreement with Carronade Capital Management, LP point in the same direction: more oversight, more capital-allocation scrutiny, and less tolerance for drift.
Financial Analysis
Growth
VSAT — Financial Growth (Quarterly, USD Mil)
| Metric | 2025-03-31 | 2025-06-30 | 2025-09-30 | 2025-12-31 | 2026-03-31 |
|---|---|---|---|---|---|
| REVENUE (USD Mil) | 1,147.1 | 1,171.1 | 1,140.9 | 1,157 | 1,171.3 |
| EBIT (USD Mil) | -134.3 | 55.5 | 48.3 | 180.4 | 180.9 |
| EBITDA (USD Mil) | 202.9 | 397.2 | 374.6 | 520.2 | 527.5 |
| NET INCOME (USD Mil) | -246.1 | -56.4 | -61.4 | 25 | 58.8 |
| DILUTED EPS | -1.9 | -0.4 | -0.5 | 0.2 | 0.4 |
Source: Yahoo Finance — Quarterly Financial Statements
Revenue was $1.147B in Q1 2025, $1.171B in Q2 2025, $1.141B in Q3 2025, $1.157B in Q4 2025, and $1.171B in Q1 2026. That is a flat top line, not a growth profile, and it tells me the company is still waiting for new capacity to translate into broader demand. EBITDA improved from $202.9M to $527.5M over the same span, while net income moved from a $246.1M loss to $58.8M of profit, so earnings are improving faster than revenue.
That spread matters because it shows operating leverage is starting to work, but the revenue base has not yet broken out. The current pattern is consistent with a business that is repairing margins before it can claim durable growth.
Profitability
VSAT — Profitability (TTM)
| Metric | TTM |
|---|---|
| Operating Margin (TTM) | -1.8% |
| Net Margin (TTM) | -0.7% |
| Return on Assets (TTM) | 0.4% |
| Return on Equity (TTM) | 0.1% |
| Gross Margin (TTM) | 33.0% |
| EBITDA Margin (TTM) | 30.6% |
Source: Yahoo Finance — Trailing Twelve Months (TTM)
TTM gross margin was 33.0%, EBITDA margin was 30.6%, operating margin was -1.8%, and net margin was -0.7%. The gap between gross margin and operating margin is wide, which tells me the core service layer is healthy but overhead, depreciation, and amortisation still absorb most of the gross profit. EBITDA staying positive while operating margin remains negative points to a capital-intensive model that is not yet converting accounting earnings into durable GAAP profit.
Return on assets was 0.4% TTM and return on equity was 0.1% TTM. Those returns are still too low to call the business fully mature, and they also show that the balance-sheet repair has not yet translated into meaningful shareholder returns. The key threshold I would watch is a sustained positive operating margin, because that would show the company is covering its non-cash and overhead burden with real earnings rather than with EBITDA add-backs.
Valuation
VSAT — Valuation Multiples
| Metric | Value |
|---|---|
| Market Cap (USD Mil) | 10,046 |
| Enterprise Value (USD Mil) | 15,308 |
| Forward P/E | 182.4 |
| Price/Sales (TTM) | 2.2 |
| Price/Book (mrq) | 2.2 |
| EV/Revenue | 3.3 |
| EV/EBITDA | 10.8 |
| Beta (5Y Monthly) | 1.70 |
| FCF Yield % (TTM) | 2.5% |
| Forward EPS (USD) | 0.4 |
| Analyst Target Price – Low (USD) | 49 |
| Analyst Target Price – Mean (USD) | 94.6 |
| Analyst Target Price – High (USD) | 140 |
| # Analyst Opinions | 9 |
Source: Yahoo Finance
Viasat trades at 3.3x enterprise value to revenue and 2.2x price to sales on TTM results, which is the right anchor here because trailing P/E is not available and forward P/E is 182.4x on just 0.4 of forward EPS. The market is clearly paying for an earnings reset, not current profitability, because the stock still sits at 10.8x EV/EBITDA while EBITDA margin is only 30.6% TTM and net income remains thin relative to the $15.3B enterprise value.
On my read, fair value sits in a wide range of roughly $50-$95 a share. That range is close to the analyst mean target of $94.6 and above the $49 low, so it sits inside consensus rather than against it, but I would still weight the lower half more heavily because leverage and execution risk deserve a discount. The implied earnings path is also modest: with forward EPS at $0.4, the stock is expensive on current earnings power, and that is why the valuation only works if margin repair continues.
The peer set reinforces that point. Viasat’s EV/revenue is below VIAV, IRDM, GSAT, and CIEN, but its forward P/E is still far richer than IRDM’s 42.2x and CIEN’s 47.8x. In other words, the market is not paying Viasat for peer-leading growth or returns; it is paying for a recovery that still needs to show up in the numbers.
Leverage
VSAT — Leverage & Coverage (Quarterly)
| Metric | Value |
|---|---|
| Total Debt/Equity % (mrq) | 146.7 |
| Current Ratio (mrq) | 2.4 |
| Total Debt (mrq, USD Mil) | 6,939.6 |
| Operating Cash Flow (TTM, USD Mil) | 1,589.9 |
| Levered Free Cash Flow (TTM, USD Mil) | 254.8 |
| Net Debt/EBITDA (TTM) | 3.7 |
| FCF Margin % (TTM) | 5.5% |
Source: Yahoo Finance — Quarterly Financial Statements
Total debt was $6.9B at March 31, 2026, with total debt to equity of 146.7% and a current ratio of 2.4x. That balance sheet is levered, but the liquidity cushion means near-term obligations are covered without immediate stress. TTM operating cash flow was $1.6B and levered free cash flow was $254.8M, so cash conversion is positive but thin after capex, interest, and other claims.
Net debt/EBITDA was 3.7x and FCF margin was 5.5%, which tells me EBITDA is still being absorbed by the capital structure rather than flowing cleanly to equity. I would not call that distressed, but I also would not call it comfortable. The leverage profile only becomes meaningfully better if EBITDA and free cash flow keep rising together; if one stalls, the other will not be enough to carry the thesis.
Insider Activity
The insider transaction record is one-sided: 22 open-market sales and 0 open-market purchases from 2025-02-10 to 2026-06-03. The activity is also broad rather than isolated, with multiple executives selling across several dates, which weakens the case for insider alignment with shareholders. I read that as a caution flag, not a thesis breaker, but it does not help confidence at a time when the stock already discounts a recovery.
Comparable Analysis
Growth
| Company | Revenue TTM (USD Mil) | Revenue Growth YoY % | EBITDA TTM (USD Mil) | Diluted EPS TTM |
|---|---|---|---|---|
| VSAT | 4,640.3 | 2.1% | 1,421.5 | -0.2 |
| VIAV | 1,365.7 | 42.8% | 223.5 | -0.2 |
| IRDM | 875.8 | 1.9% | 438.6 | 1 |
| GSAT | 283 | 16.7% | 109.2 | -0.1 |
| CIEN | 5,569.1 | 39.5% | 785.7 | 3 |
| ERIC | — | -10.3% | 35,870 | 0.8 |
Source: Yahoo Finance
Viasat’s revenue growth of 2.1% TTM trails VIAV’s 42.8%, CIEN’s 39.5%, and GSAT’s 16.7%, while only edging IRDM’s 1.9%. That gap says Viasat is the slowest grower in a peer set where CIEN and VIAV are already monetizing stronger demand, so the market should not pay a growth premium for Viasat unless earnings reaccelerate from its current negative diluted EPS TTM.
Valuation
| Company | Trailing P/E | Forward P/E | EV/Revenue | EV/EBITDA | Price/Sales (TTM) | Price/Book (mrq) | Market Cap (USD Mil) | Enterprise Value (USD Mil) | Beta (5Y Monthly) | FCF Yield % (TTM) | Forward EPS | Analyst Target Price – Low | Analyst Target Price – Mean | Analyst Target Price – High | # Analyst Opinions |
|---|---|---|---|---|---|---|---|---|---|---|---|---|---|---|---|
| VSAT | — | 182.4 | 3.3 | 10.8 | 2.2 | 2.2 | 10,046 | 15,308 | 1.70 | 2.5% | 0.4 | 49 | 94.6 | 140 | 9 |
| VIAV | — | 33.5 | 7.8 | 47.9 | 7.8 | 11.9 | 10,627 | 10,712 | 1.19 | 1.7% | 1.3 | 60 | 64.6 | 70 | 7 |
| IRDM | 50.6 | 42.2 | 8 | 15.9 | 6.1 | 11.3 | 5,304 | 6,970 | 0.88 | 4.8% | 1.2 | 36 | 45 | 60 | 6 |
| GSAT | — | 261.5 | 37.1 | 96.1 | 36.4 | 30 | 10,315 | 10,494 | 1.54 | -2.8% | 0.3 | 90 | 90 | 90 | 3 |
| CIEN | 154.1 | 47.8 | 11.8 | 83.5 | 11.7 | 22.6 | 65,216 | 65,594 | 1.27 | 1.1% | 9.6 | 270 | 565.7 | 720 | 19 |
| ERIC | 14.9 | 17.2 | — | — | — | 0.4 | 37,503 | — | 0.52 | 78.6% | 0.7 | 8.2 | 10.2 | 11.4 | 6 |
Source: Yahoo Finance
Viasat’s 2.5% FCF yield is below IRDM’s 4.8% and far below ERIC’s 78.6%, while its 3.3x EV/revenue sits below VIAV’s 7.8x, IRDM’s 8.0x, GSAT’s 37.1x, and CIEN’s 11.8x. On a cash basis, Viasat looks cheaper than the high-multiple growth names but not as compelling as IRDM on yield, and its 182.4x forward P/E versus IRDM’s 42.2x and CIEN’s 47.8x implies the stock is pricing in a sharp earnings rebound that is not yet visible. That is why the valuation premium only makes sense if the leverage profile improves at the same time; otherwise, the market is paying up for optionality rather than for proven cash generation.
A $1 investment a year ago would be worth $4.15 in Viasat, $4.78 in CIEN, $4.14 in GSAT, $4.15 in VIAV, and $1.60 in IRDM. I feel the market is already giving Viasat credit for a recovery that still needs to show up in earnings, because the stock’s 377.7% one-year return is far ahead of its 2.1% revenue growth and negative diluted EPS TTM.
Profitability
| Company | Operating Margin (TTM) | Net Margin (TTM) | Return on Assets (TTM) | Return on Equity (TTM) | Gross Margin (TTM) | EBITDA Margin (TTM) |
|---|---|---|---|---|---|---|
| VSAT | -1.8% | -0.7% | 0.4% | 0.1% | 33.0% | 30.6% |
| VIAV | 12.2% | -4.0% | 3.6% | -7.0% | 60.7% | 16.4% |
| IRDM | 23.2% | 12.1% | 5.5% | 21.4% | 71.6% | 50.1% |
| GSAT | 16.3% | -3.1% | 0.8% | -2.5% | 63.7% | 38.6% |
| CIEN | 15.2% | 7.9% | 6.7% | 15.5% | 43.0% | 14.1% |
| ERIC | 0.0% | 10.9% | 6.9% | 27.0% | — | — |
Source: Yahoo Finance
Viasat’s gross margin of 33.0% and EBITDA margin of 30.6% are below IRDM’s 71.6% and 50.1%, but above VIAV’s 60.7% gross margin with 16.4% EBITDA margin and GSAT’s 63.7% gross margin with 38.6% EBITDA margin. The bigger issue is operating margin at -1.8% and net margin at -0.7%, which means Viasat is still converting decent gross profit into losses, so the gap looks more like an opex and scale problem than a pure cost-of-revenue problem.
ROE of 0.1% and ROA of 0.4% are also weak versus IRDM, CIEN, and ERIC, so the company is not earning a premium return on capital. That matters because a leveraged balance sheet only helps equity holders if the underlying business can earn enough to cover the financing cost.
Leverage
| Company | Total Debt/Equity % (mrq) | Current Ratio (mrq) | Total Debt (mrq, USD Mil) | Operating Cash Flow TTM (USD Mil) | Free Cash Flow TTM (USD Mil) | Net Debt/EBITDA (TTM) | FCF Margin % (TTM) |
|---|---|---|---|---|---|---|---|
| VSAT | 146.7 | 2.4 | 6,939.6 | 1,589.9 | 254.8 | 3.7 | 5.5% |
| VIAV | 134.3 | 1.6 | 1,136.5 | 71 | 175 | 2.8 | 12.8% |
| IRDM | 382 | 2.9 | 1,789 | 410.6 | 253 | 3.8 | 28.9% |
| GSAT | 156.9 | 1.6 | 537.8 | 605 | -283.7 | 1.6 | -100.2% |
| CIEN | 54.6 | 2.7 | 1,580.6 | 1,032.8 | 700.9 | 0.5 | 12.6% |
| ERIC | 38.1 | 1.1 | — | — | 29,486.1 | — | — |
Source: Yahoo Finance
Viasat’s total debt to equity of 146.7% and net debt to EBITDA of 3.7x are heavier than CIEN’s 54.6% and 0.5x, and also above IRDM’s 382.0% and 3.8x on debt/equity, where the cash-adjusted picture is closer. Viasat’s $254.8M FCF margin is weaker than IRDM’s 28.9% and CIEN’s 12.6%, which tells me the balance sheet is serviceable but not a source of advantage; investors are paying for optionality, not for excess cash generation.
The leverage gap also helps explain part of the valuation gap. CIEN’s lower debt load and stronger free cash flow justify a cleaner multiple, while Viasat still needs execution to turn its network assets into enough cash to narrow that discount.
Conclusion
I would put my rating as a Sell because the stock already discounts a recovery that the operating data has not yet earned. Revenue was flat at $1.171B in Q1 2026, while EBITDA improved to $527.5M and net income reached $58.8M, so the business is moving in the right direction, but the 182.4x forward P/E and 3.3x EV/revenue still assume a much cleaner earnings reset than the company has delivered.
The bull case is straightforward: if communication services revenue moves above $3.5B annually and operating margin turns positive, meaning the company is covering depreciation and overhead with real earnings, I would move the rating toward Hold and then closer to Buy. A further improvement in FCF margin from 5.5% toward the high single digits would matter because it would show the capital structure is being supported by cash, not just by accounting earnings. The bear case is just as clear: if quarterly revenue slips below $1.1B or net debt/EBITDA moves above 4.0x, meaning leverage is rising faster than cash generation, I would move from Sell toward a more negative stance because the balance sheet would be absorbing the operating miss rather than cushioning it.
Weighing both sides, I still lean Sell because the earnings recovery is visible but not yet broad enough to outrun leverage and execution risk. The bull case needs another quarter or two of proof, while the bear case can reassert itself quickly if growth stalls again, so I would wait for a cleaner operating inflection before paying up for the equity.
What’s your take? I rated Viasat (VSAT) SELL above — but the goal here is to get this right, not just to publish an opinion. What would you add to this analysis, or which risk or catalyst do you think I’m under- or over-weighting? Tell me in the comments.
Sources
- SEC 10-K Annual Report — filed 2026-05-29
- SEC 8-K Filing (2026-05-28)
- SEC 8-K Filing (2026-05-07)
- SEC 8-K Filing (2026-02-05)
- SEC 8-K Filing (2026-01-26)
- SEC Form 4 Insider Transaction (2026-06-05)
- SEC Form 4 Insider Transaction (2026-06-05)
- SEC Form 4 Insider Transaction (2026-06-05)
- SEC 10-K Annual Report — FY2026
- SEC 10-K Annual Report — FY2025
- SEC 10-K Annual Report — FY2024
- SEC 10-K Annual Report — FY2023
- SEC 10-K Annual Report — FY2022
Data sourced from Yahoo Finance and SEC EDGAR. Not investment advice.
Leave a Comment