
Executive Summary
Rating: SELL | CIFR
Measured from adjusted close on 2026-07-08 to 2026-10-07. Sell ratings are correct when the stock falls; Hold is tracked as a +/-10% range. Daily-close data, not intraday. Calls are tracked for 182 days from publication, then frozen as a final record.
I would put my rating as a Sell because the stock already discounts a fast HPC monetization path, yet the latest quarter still showed only $34.8M of revenue and $114.3M of net loss. In my view, the key tension is that Cipher Digital has built a large site pipeline and a high-EBITDA operating model, but the cash conversion has not caught up, so the equity is being priced ahead of the proof. I would raise my rating more towards a Hold if revenue can hold above $70M for two straight quarters, meaning the lease ramp is becoming repeatable rather than a one-off spike.
Company Profile
Cipher Digital Inc. develops and operates industrial-scale data centers for high-performance computing, or HPC, and bitcoin mining. It earns revenue from bitcoin block rewards and transaction fees today, while its HPC platform is still being built out through long-term leases and site development.
The company was incorporated in 2021 after a business combination with Good Works Acquisition Corp. and is listed on Nasdaq under CIFR. Its portfolio spans 4.2 GW across 10 sites, including 600 MW of HPC capacity under development at two sites, 207 MW of operating bitcoin-mining capacity in Odessa, Texas, and a 34 GW pipeline across Texas and Ohio. Financing is centered on project-level structures and a capital markets program, which has left the balance sheet large relative to current revenue.
Economic Moat
Business Model
The moat case rests on site sourcing and power access. Cipher has already secured 4.2 GW of capacity across 10 sites, and that footprint is hard to replicate quickly because it depends on land control, interconnection progress, and utility relationships that a new entrant cannot assemble overnight. The company also has 300 MW of approved interconnection at Barber Lake and Black Pearl, plus a fully executed direct interconnection agreement with American Electric Power at Colchis, a 1 GW West Texas site, which turns development into a gated asset rather than a generic plan.
I also see some secondary support from execution capability. The in-house construction, engineering, and operations teams, together with the Quanta Services partnership, should help the company deliver large projects on schedule, while four granted U.S. patents and one issued patent in Taiwan add a modest layer of process protection. That said, the moat is still more about access and execution than about pricing power.
Business & Operating Risks
The main disclosed risk is execution on Barber Lake, Black Pearl, and future growth projects. According to the risk factors in the SEC 10-K, Cipher may not complete construction on time or within cost estimates, and lessees can terminate if delays are significant. That is a direct threat to the development moat because the company’s advantage only matters if sites come online and start earning rent.
Power access is the next risk. The filing warns that higher power costs, outages, shortages, and insufficient access could hurt the business, and that matters because the model depends on keeping large loads online in Texas and other constrained markets. Tenant concentration is also material: the company’s data centers are single-tenant properties, so a delay or non-renewal from a major counterparty would hit cash flow quickly. In my view, these risks do threaten the moat, but they threaten the execution layer more than the underlying site-sourcing advantage.
Management Discussion & Analysis
Management is clearly trying to shift the business toward HPC leasing, but the numbers show that transition is still capital hungry. Revenue was $223.9M in 2025, yet the company still reported a $822.2M net loss and negative operating cash flow, so the build-out is not self-funding. The company also ended 2025 with $628.3M of cash and cash equivalents, which gives near-term liquidity, but the funding story still leans on debt and equity rather than internal cash generation.
The strategic signal is mixed. Management has been consistent about moving from mining toward long-duration infrastructure leasing, and that is the right direction for the moat, but the current filing still shows a business in construction mode rather than one that has fully converted site control into recurring rent. The divestiture of the WindHQ JV interests helps simplify the portfolio, yet the unresolved issue is whether the HPC ramp can outrun the leverage burden.
Recent Events
The March 23, 2026 credit agreement was the most important recent event. It gave Cipher a $200M revolving facility with a $50M letter of credit sublimit and first-priority liens on substantially all assets, which improves liquidity but also shows lenders are demanding tighter discipline. A June 8, 2026 disclosure that Stingray Compute LLC plans to issue $810M of senior secured notes due 2031 points in the same direction: the company still has access to capital, but it is funding growth with more secured debt.
The February 20, 2026 name change to Cipher Digital Inc. is cosmetic on its own, yet it fits the broader repositioning toward a wider digital infrastructure identity. Taken together, these events support the moat thesis only if the new capital is converted into operating sites on time; otherwise they simply add leverage ahead of revenue.
Financial Analysis
Growth
CIFR — Financial Growth (Quarterly, USD Mil)
| Metric | 2025-03-31 | 2025-06-30 | 2025-09-30 | 2025-12-31 | 2026-03-31 |
|---|---|---|---|---|---|
| REVENUE (USD Mil) | 49 | 43.6 | 71.7 | 59.7 | 34.8 |
| EBIT (USD Mil) | -38.1 | -43.7 | -2.3 | -704.9 | -54.8 |
| EBITDA (USD Mil) | 5.8 | 0.8 | 57.7 | -652.6 | -35.1 |
| NET INCOME (USD Mil) | -39 | -45.8 | -3.3 | -734.2 | -114.3 |
| DILUTED EPS | -0.1 | -0.1 | 0 | — | -0.3 |
Source: Yahoo Finance — Quarterly Financial Statements
Revenue was $49M in Q1 2025, $43.6M in Q2, $71.7M in Q3, $59.7M in Q4, and $34.8M in Q1 2026. The pattern is choppy rather than compounding, and the latest quarter was down 28.8% year over year, so I do not yet see a durable ramp in the top line. EBITDA was even more volatile, swinging from $5.8M in Q1 2025 to $57.7M in Q3 before turning negative at $652.6M in Q4 and $35.1M in Q1 2026, which tells me the business is still sensitive to timing and project mix.
That volatility matters because the moat thesis depends on converting site access into repeatable contracted revenue. Until the revenue line becomes steadier, the market is paying for a future run rate that the reported quarters have not yet confirmed.
Profitability
CIFR — Profitability (TTM)
| Metric | TTM |
|---|---|
| Operating Margin (TTM) | -249.4% |
| Net Margin (TTM) | 0.0% |
| Return on Assets (TTM) | -0.2% |
| Return on Equity (TTM) | -121.7% |
| Gross Margin (TTM) | 12.4% |
| EBITDA Margin (TTM) | 79.0% |
Source: Yahoo Finance — Trailing Twelve Months (TTM)
TTM gross margin was 12.4%, while EBITDA margin was 79.0%. That spread tells me the company can generate strong pre-depreciation economics when capacity is filled, but the asset base is expensive and the economics do not yet flow through to operating profit. Operating margin was -249.4% and net margin was 0.0%, so the business is still far from converting those gross economics into shareholder earnings.
Return on assets was -0.2% and return on equity was -121.7%, which shows the capital base is not earning an adequate return. In my view, the key test is whether operating margin moves toward positive territory while EBITDA stays strong; if that happens, the platform would start to look like a real compounding infrastructure business rather than a high-cost build-out.
Valuation
CIFR — Valuation Multiples
| Metric | Value |
|---|---|
| Market Cap (USD Mil) | 8,443 |
| Enterprise Value (USD Mil) | 12,430 |
| Trailing P/E | — |
| Forward P/E | 43 |
| Price/Sales (TTM) | 40.2 |
| Price/Book (mrq) | 11.7 |
| EV/Revenue | 59.2 |
| EV/EBITDA | 75 |
| Beta (5Y Monthly) | 3.20 |
| FCF Yield % (TTM) | -34.9% |
| Forward EPS (USD) | 0.5 |
| Analyst Target Price – Low (USD) | 23 |
| Analyst Target Price – Mean (USD) | 32.6 |
| Analyst Target Price – High (USD) | 69 |
| # Analyst Opinions | 16 |
Source: Yahoo Finance
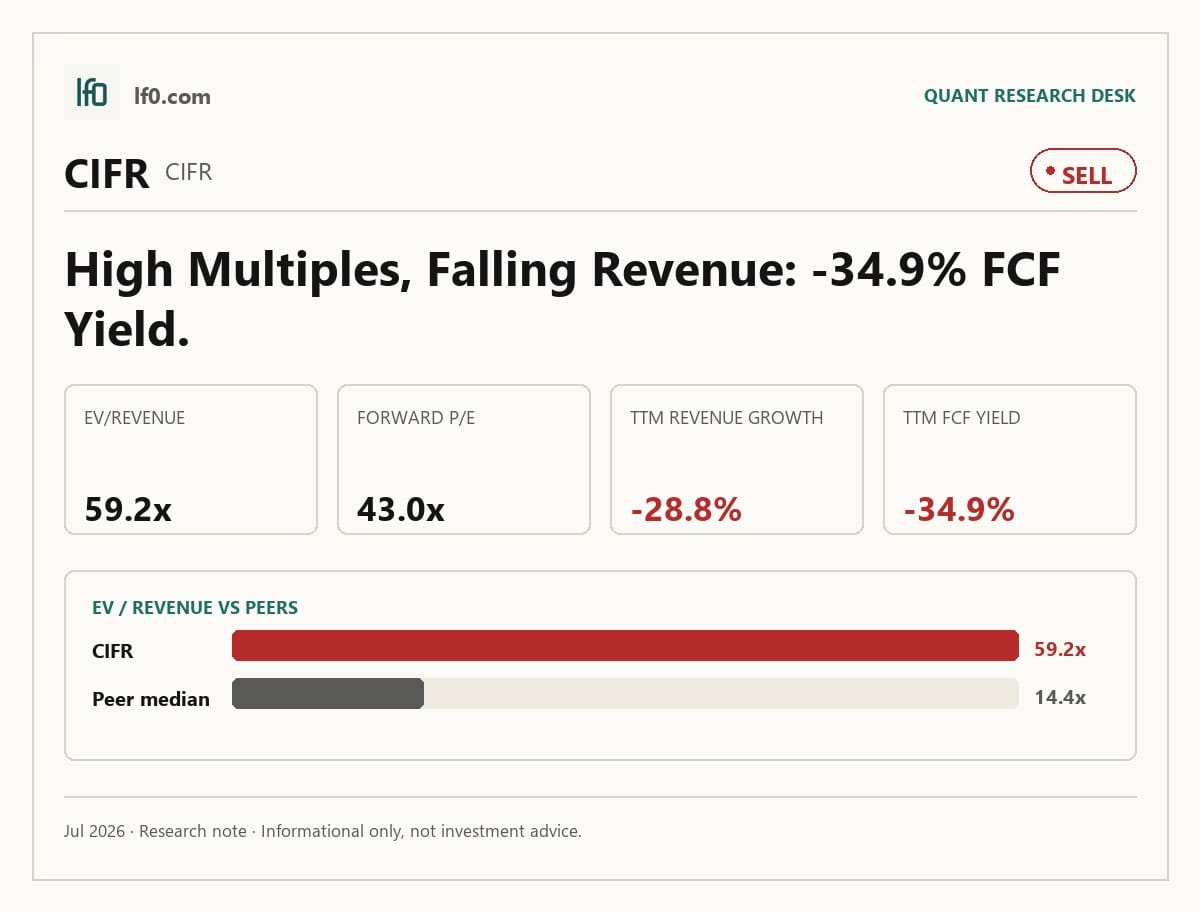
Cipher trades at a market cap of $8.4B and an enterprise value of $12.4B, which is rich relative to the current revenue base. EV/Revenue is 59.2x, Price/Sales is 40.2x, EV/EBITDA is 75.0x, and forward P/E is 43.0x on forward EPS of $0.48, so the market is already pricing in a sharp improvement in lease-up and cash generation. FCF yield is -34.9%, which is a reminder that the equity is still funding growth rather than harvesting it.
On the analysis here, I would put fair value in a range of $23–$33 per share. That sits around the analyst mean target of $32.6 and inside the broader $23–$69 range, so my view is not wildly out of line with consensus, but I weight the leverage and cash burn more heavily than the market appears to. I would also frame forward EPS at roughly $0.4–$0.6 as the near-term range that matters, which is consistent with the company’s own $0.5 forward EPS and still implies a very high multiple versus peers that have cleaner balance sheets or better growth.
The rating call is still a Sell because the valuation already assumes the HPC transition works, while the reported numbers show that the transition is not yet self-funding. In other words, the multiple is asking investors to pay for execution before execution has shown up in cash flow.
Leverage
CIFR — Leverage & Coverage (Quarterly)
| Metric | Value |
|---|---|
| Total Debt/Equity % (mrq) | 641.6 |
| Current Ratio (mrq) | 3.1 |
| Total Debt (mrq, USD Mil) | 4,746.7 |
| Operating Cash Flow (TTM, USD Mil) | -69.2 |
| Levered Free Cash Flow (TTM, USD Mil) | -2,948.1 |
| Net Debt/EBITDA (TTM) | 24.3 |
| FCF Margin % (TTM) | -1,405.0% |
Source: Yahoo Finance — Quarterly Financial Statements
Total debt to equity was 641.6%, current ratio was 3.1x, total debt was $4.7B, operating cash flow was $69.2M, levered free cash flow was $2.9B, net debt to EBITDA was 24.3x, and FCF margin was -1,405.0%. The current ratio gives some near-term liquidity cushion, but the cash profile is deeply negative and the debt load is heavy, so the balance sheet is still absorbing more risk than it is creating flexibility.
That leverage profile matters because it leaves little room for delay in the HPC ramp. If revenue keeps growing while operating cash flow improves, the debt burden becomes more manageable; if not, the company will keep relying on external capital to bridge the gap.
Insider Activity
The insider transaction record is one-sided: 15 open-market sales and no open-market purchases from 2025-03-31 to 2026-06-04. Activity was concentrated, led by V3 Holding Ltd with multiple large sales, while only a few executives and directors sold smaller blocks. I read that as a negative signal for alignment, especially when the business is still dependent on external funding and execution.
Comparable Analysis
Growth
| Company | Revenue TTM (USD Mil) | Revenue Growth YoY % | EBITDA TTM (USD Mil) | Diluted EPS TTM |
|---|---|---|---|---|
| CIFR | 209.8 | -28.8% | 165.8 | -2.3 |
| RIOT | 653.3 | 3.6% | -326.7 | -2.5 |
| IREN | 757.1 | -0.0% | 147.2 | 0.8 |
| HUT | 284.3 | 225.5% | -417.1 | -2.8 |
| MARA | 867.8 | -18.4% | -745.1 | -5.5 |
| CLSK | 739.9 | -24.9% | -387.6 | -2.1 |
Source: Yahoo Finance
CIFR’s revenue growth was -28.8% TTM, versus RIOT at 3.6%, IREN at 0.0%, HUT at 225.5%, MARA at -18.4%, and CLSK at -24.9%. That puts CIFR behind the only peer with positive growth and well below HUT’s expansion, so the market is not paying for growth leadership here.
Valuation
| Company | Trailing P/E | Forward P/E | EV/Revenue | EV/EBITDA | Price/Sales (TTM) | Price/Book (mrq) | Market Cap (USD Mil) | Enterprise Value (USD Mil) | Beta (5Y Monthly) | FCF Yield % (TTM) | Forward EPS | Analyst Target Price – Low | Analyst Target Price – Mean | Analyst Target Price – High | # Analyst Opinions |
|---|---|---|---|---|---|---|---|---|---|---|---|---|---|---|---|
| CIFR | — | 43 | 59.2 | 75 | 40.2 | 11.7 | 8,443 | 12,430 | 3.20 | -34.9% | 0.5 | 23 | 32.6 | 69 | 16 |
| RIOT | — | -34.9 | 13.3 | -26.6 | 11.9 | 3.3 | 7,786 | 8,677 | 3.81 | -5.7% | -0.6 | 20 | 29.1 | 45 | 20 |
| IREN | 52.9 | -43.4 | 21.1 | 108.6 | 19.2 | 5.2 | 14,570 | 15,981 | 4.28 | -15.9% | -0.9 | 41 | 80.9 | 126 | 15 |
| HUT | — | -52.2 | 40.3 | -27.5 | 38.4 | 7.9 | 10,910 | 11,466 | 6.07 | -2.8% | -1.9 | 70 | 126.9 | 226 | 17 |
| MARA | — | -17.3 | 7.7 | -8.9 | 5.2 | 2 | 4,478 | 6,646 | 5.37 | -11.9% | -0.7 | 7 | 18.5 | 30 | 11 |
| CLSK | — | -16.6 | 6.4 | -12.2 | 4.2 | 3.1 | 3,097 | 4,733 | 3.84 | -9.7% | -0.7 | 16 | 21.1 | 27 | 13 |
Source: Yahoo Finance
CIFR trades at 59.2x EV/Revenue and 40.2x Price/Sales, versus RIOT at 13.3x and 11.9x, IREN at 21.1x and 19.2x, HUT at 40.3x and 38.4x, MARA at 7.7x and 5.2x, and CLSK at 6.4x and 4.2x. That is a premium multiple even before you adjust for CIFR’s -34.9% FCF yield, and it is hard to justify on a growth-adjusted basis when the company’s revenue trend is weaker than most peers. A $1 investment one year ago would be worth 3.54 in CIFR, versus $2.56 in HUT, $2.35 in IREN, $1.83 in RIOT, $1.10 in CLSK, and $0.72 in MARA, so the market has already rewarded the stock for a recovery that still needs to show up in the fundamentals.
Profitability
| Company | Operating Margin (TTM) | Net Margin (TTM) | Return on Assets (TTM) | Return on Equity (TTM) | Gross Margin (TTM) | EBITDA Margin (TTM) |
|---|---|---|---|---|---|---|
| CIFR | -249.4% | 0.0% | -0.2% | -121.7% | 12.4% | 79.0% |
| RIOT | -280.5% | -132.8% | -12.1% | -32.5% | 32.4% | -50.0% |
| IREN | -64.5% | 20.9% | -3.0% | 7.7% | 68.4% | 19.4% |
| HUT | -521.5% | -109.8% | -16.2% | -27.4% | 59.7% | -146.7% |
| MARA | -558.1% | -234.8% | -15.6% | -67.3% | 45.3% | -85.9% |
| CLSK | -246.3% | -67.7% | -18.2% | -34.8% | 50.7% | -52.4% |
Source: Yahoo Finance
CIFR’s gross margin was 12.4%, below RIOT at 32.4%, IREN at 68.4%, HUT at 59.7%, MARA at 45.3%, and CLSK at 50.7%. EBITDA margin was 79.0%, which is higher than the peer set, but I view that as a function of operating leverage and non-cash items rather than a cleaner operating model. ROE was -121.7% and ROA was -0.2%, so the company is not yet generating attractive returns on the capital it has deployed.
Leverage
| Company | Total Debt/Equity % (mrq) | Current Ratio (mrq) | Total Debt (mrq, USD Mil) | Operating Cash Flow TTM (USD Mil) | Free Cash Flow TTM (USD Mil) | Net Debt/EBITDA (TTM) | FCF Margin % (TTM) |
|---|---|---|---|---|---|---|---|
| CIFR | 641.6 | 3.1 | 4,746.7 | -69.2 | -2,948.1 | 24.3 | -1,405.0% |
| RIOT | 36.6 | 1.1 | 877.2 | -633.5 | -445.9 | -2.1 | -68.2% |
| IREN | 148.8 | 3.7 | 3,964.9 | 392.5 | -2,311 | 11.9 | -305.3% |
| HUT | 25 | 0.9 | 422.9 | -132.6 | -300.6 | -0.6 | -105.7% |
| MARA | 105.6 | 1.8 | 2,464 | -834.7 | -531.1 | -2.6 | -61.2% |
| CLSK | 181.6 | 8.3 | 1,790.7 | -526.3 | -300.7 | -3.9 | -40.6% |
Source: Yahoo Finance
CIFR’s total debt to equity was 641.6%, versus RIOT at 36.6%, IREN at 148.8%, HUT at 25.0%, MARA at 105.6%, and CLSK at 181.6%. Net debt to EBITDA was 24.3x, while RIOT was -2.1x, IREN was 11.9x, HUT was -0.6x, MARA was -2.6x, and CLSK was -3.9x, so CIFR is the most levered name in the group on a cash-flow basis. That helps explain part of the valuation gap: investors are paying for growth optionality, but they are also taking on more balance-sheet risk than they are with most peers.
Conclusion
I would put my rating as a Sell because the stock is already discounting a successful HPC ramp, while the latest revenue, cash flow, and leverage figures still point to a business in transition rather than one that has earned a premium multiple. The key tension is that the site pipeline and interconnection assets are real, but the reported numbers have not yet shown that those assets are turning into stable, repeatable cash generation.
I would raise my rating more towards a Hold if revenue can stay above $70M for two consecutive quarters and operating cash flow moves materially closer to breakeven, because that would tell me the lease ramp is becoming durable and the fixed-cost base is being absorbed. I would move from Sell to Strong Sell if revenue falls back below $35M for another quarter while debt remains near $4.7B, meaning the company is still carrying a heavy balance sheet without enough operating momentum to support it.
Weighing both paths, I think the bear case is more likely to show up first because the leverage is already high and the valuation leaves little room for execution slippage. I would stay cautious until the company proves that higher revenue is sticking and that cash generation is improving, because without that, the current multiple looks too demanding for the risk profile.
What’s your take? I rated Cipher Digital (CIFR) SELL above — but the goal here is to get this right, not just to publish an opinion. What would you add to this analysis, or which risk or catalyst do you think I’m under- or over-weighting? Tell me in the comments.
Sources
- SEC 10-K Annual Report — filed 2026-02-24
- SEC 8-K Filing (2026-06-08)
- SEC 8-K Filing (2026-06-08)
- SEC 8-K Filing (2026-05-05)
- SEC 8-K Filing (2026-03-25)
- SEC 8-K Filing (2026-02-24)
- SEC 8-K Filing (2026-02-11)
- SEC Form 4 Insider Transaction (2026-06-08)
- SEC Form 4 Insider Transaction (2026-06-05)
- SEC Form 4 Insider Transaction (2026-06-05)
- SEC 10-K Annual Report — FY2026
- SEC 10-K Annual Report — FY2025
- SEC 10-K Annual Report — FY2024
- SEC 10-K Annual Report — FY2023
- SEC 10-K Annual Report — FY2022
Data sourced from Yahoo Finance and SEC EDGAR. Not investment advice.
Leave a Comment