| Company | Oct 25 | Nov 25 | Dec 25 | Jan 26 | Feb 26 | Mar 26 | Apr 26 | May 26 | Jun 26 | Jul 26 | Aug 26 | Sep 26 | 12-Mo |
|---|---|---|---|---|---|---|---|---|---|---|---|---|---|
| WULF | +36% | +0% | -26% | +16% | +21% | -11% | +51% | +18% | -3% | -29% | -14% | -2% | +30% |
| IREN | +29% | -21% | -21% | +42% | -24% | -16% | +33% | +40% | -28% | -20% | +1% | +10% | -13% |
| APLD | +51% | -22% | -10% | +38% | -20% | -13% | +44% | +38% | -21% | -27% | -7% | -4% | +6% |
| RIOT | +4% | -18% | -21% | +22% | +5% | -24% | +39% | +57% | +1% | -26% | -6% | +6% | +6% |
| CIFR | +48% | +9% | -27% | +8% | -2% | -18% | +38% | +33% | +4% | -9% | -31% | +2% | +26% |
| MARA | +0% | -35% | -24% | +6% | -6% | -9% | +47% | +20% | -3% | -19% | -5% | +5% | -38% |
Source: Yahoo Finance monthly adjusted close.
Quick Thesis
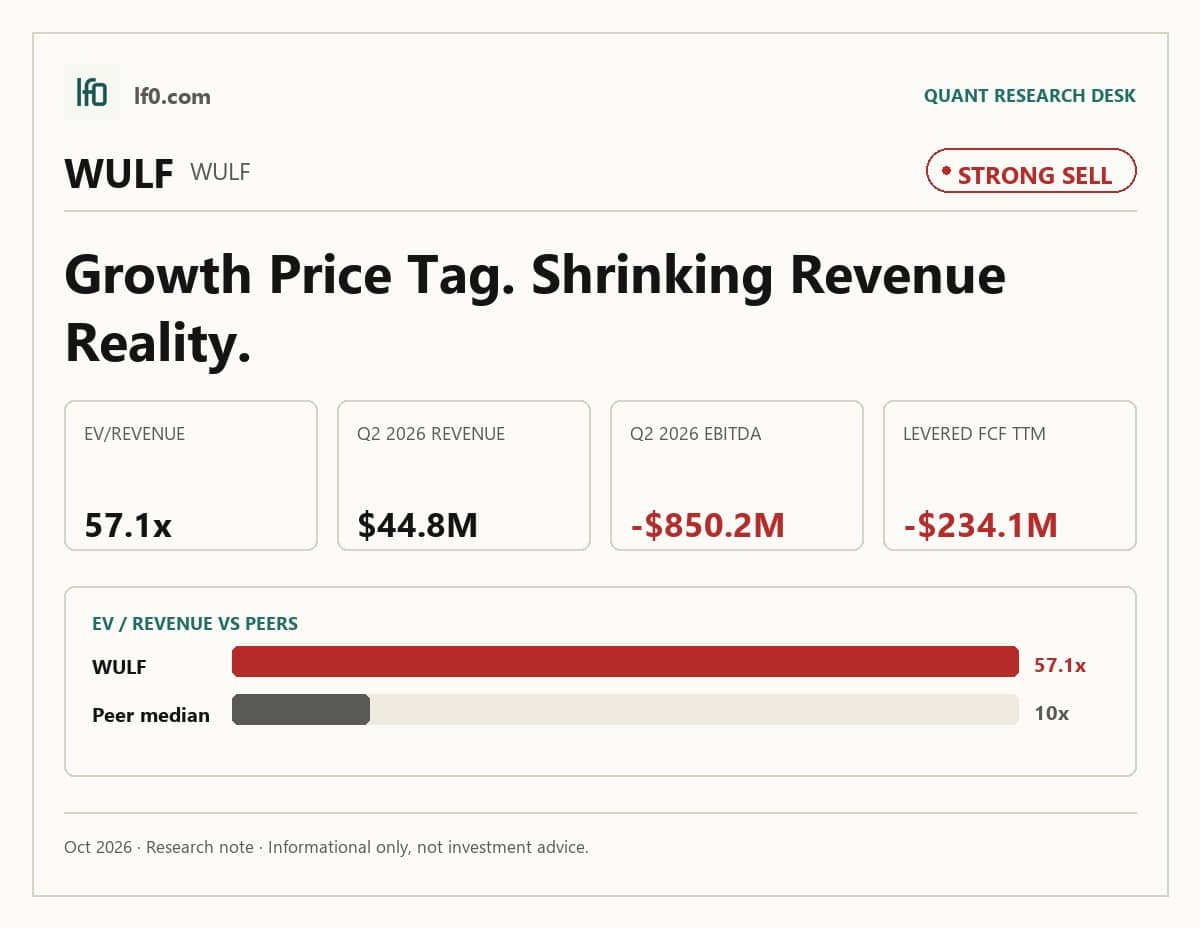
- Rated strong sell — the stock prices in a future HPC ramp that is not yet showing up in cash flow.
- Best strength: $2.6B of cash, or $5.25 per share, gives TeraWulf time to fund the buildout.
- Biggest risk: levered free cash flow was -$234.1M TTM, so the balance sheet is still funding losses.
- Valuation is rich at 57.1x EV/Revenue and 41.6x Price/Sales.
- I would turn more constructive only if contracted load starts producing a positive operating margin.
Executive Summary
Rating: STRONG SELL | WULF
Measured from adjusted close on n/a to 2026-10-09. Sell ratings are correct when the stock falls; Hold is tracked as a +/-10% range. Daily-close data, not intraday. Calls are tracked for 182 days from publication, then frozen as a final record.
I would put my rating as a strong sell because TeraWulf is still funding a capital-intensive HPC buildout with negative free cash flow, a 0.75 current ratio, and a 3,549.7% debt-to-equity ratio, while the stock already trades at 57.1x EV/Revenue and 41.6x Price/Sales. The long-duration campus control at Lake Mariner, Abernathy, and Cayuga is real, but the current financials show that investors are paying for future contracted cash flow before it has converted into earnings or self-funding capacity.
I would raise my rating more towards a buy if the company can show two things at once: positive EBITDA on a sustained basis and a clear step-down in cash burn, because that would tell me the buildout is starting to absorb fixed costs rather than consume them. On the current revenue base of $44.8M in Q2 2026, even a move from the present deeply negative EBITDA margin to a positive operating margin would materially change the deleveraging path, since every point of margin improvement would flow into a business that is still carrying $5.2B of debt and only $2.6B of cash.
Company Profile
TeraWulf Inc. is a vertically integrated owner, developer, and operator of large-scale digital infrastructure in the United States, built for high-performance computing workloads such as artificial intelligence, machine learning, and advanced cloud applications. It earns revenue from long-term hosting and data center lease arrangements, while legacy bitcoin mining still contributes most current revenue. Founded in Delaware in February 2021, it began trading on Nasdaq under WULF on December 14, 2021.
Its platform centers on the Lake Mariner Data Campus in Barker, New York, the Abernathy HPC Campus in Abernathy, Texas, and the Cayuga Site in Lansing, New York. Together, those sites support 522 MW of contracted critical IT load, and the development pipeline targets 250 MW to 500 MW of new capacity annually. The company is financed through equity, at-the-market offerings, and convertible securities, with no cash dividend policy.
Economic Moat
Business Model
The long-duration control of utility-scale infrastructure is the part of TeraWulf’s model I feel is hardest to replicate within 3 years, because the company controls land use through ownership or long-term ground leases, interconnection rights, electrical and cooling infrastructure, and, where applicable, on-site generation. That control is already embedded in two contracted campuses, Lake Mariner and Abernathy, which together have 522 MW of contracted critical IT load, while the Cayuga Site adds a third anchor with potential for up to 400 MW of gross capacity and about 320 MW of contractual critical IT load.
I also see a secondary advantage in the long-term, credit-enhanced customer contracts, especially the 25-year Abernathy Fluidstack lease and the Akela Fluidstack leases backed by Google credit support, because that structure lowers counterparty risk and makes financing more bankable than a typical speculative data center build. The company does not hold patents, so the defensibility comes from site control, power access, and contract structure rather than intellectual property.
Business & Operating Risks
The most material risk is execution on Lake Mariner, Abernathy, and the other build-outs, because the company does not earn the full lease revenue until construction is finished and the filing says delays can trigger lease termination rights, backstop gaps, and completion guarantees that may not be sufficient. That risk is already showing up in the financial data as capital intensity rather than revenue conversion, so the construction language is not hypothetical.
Power access and interconnection are the next real constraint. According to the risk factors in their SEC 10-K, each new HPC data center needs significant quantities of electricity, and limitations on generation, transmission, and distribution or increased costs to procure power could limit expansion or force curtailment. That matters because the model depends on low-cost, reliable power, and the filing also says securing and expanding interconnection facilities has become slower and more expensive, which can push projects past target dates and raise the cost base before revenue starts.
Customer concentration and counterparty credit are also important. The filing warns that TeraWulf depends on significant customers, and if a customer defaults, becomes insolvent, or renews on less favorable terms, revenue could be materially adversely affected. That is not generic boilerplate here because the company is building around a small number of large HPC customers, so one weak counterparty can move both occupancy and cash collection.
The risk profile does not break the moat, but it does test it: the company’s site control and credit-enhanced contracts still look like a real structural edge, while the main threat is that project timing and power access delay the moment when that edge turns into cash flow.
Management Discussion & Analysis
Management is signalling a full pivot of capital toward HPC data centers, not bitcoin mining, and the numbers show that shift is already consuming the balance sheet. In 2025, the company issued long-term debt and convertible notes that brought in $5.1B of net financing proceeds, while investing activities used $1.4B, including $792.2M more on plant and equipment, $450M in joint-venture investments, and $21.7M for Beowulf E&D, so investors should read the strategy as aggressively funded expansion rather than self-financed growth.
The Beowulf E&D acquisition on May 21, 2025, which added about 94 employees, and the Cayuga ground lease for about 183 acres with up to 400 MW of gross capacity both point to a larger in-house development platform. That should improve execution, but it also raises the capital intensity of the model. The Abernathy joint venture is 100% pre-leased to Fluidstack under a 25-year sublease with Google credit enhancement, and that is the clearest evidence that management is prioritizing long-duration, credit-supported HPC revenue over speculative buildout.
The strategy is aligned with the risks above, but it has not yet solved them. Management is still operating 245 MW of legacy mining capacity at Lake Mariner, yet it explicitly does not intend to deploy incremental growth capital there, so the mining fleet is now a cash-generating bridge rather than the growth engine.
Recent Events
The most significant development I see is the May 26, 2026 purchase agreement for the Muskie Data Campus in Eastern Kentucky, a 285-acre hyperscale site that can scale to 1 GW over time. The initial 500 MW is slated to ramp in the second half of 2028, with another 500 MW targeted for the second half of 2030, and the concurrent power and transmission agreements give TeraWulf a clearer path to large-load delivery. In my view, that strengthens the thesis because it turns the company’s AI and HPC platform from a financing story into a land, power, and interconnection story.
The April 14, 2026 capital raise and credit package were equally important. TeraWulf priced 47.4 million shares at $19.00 for about $900M of gross proceeds, then closed the deal on April 16, 2026 with net proceeds of about $1B after the upsized option. On the same date, it also disclosed allocations for a $250M senior secured revolving credit facility. I read that combination as a material balance-sheet upgrade, because it gives the company more funding headroom for campus buildout and reduces near-term execution risk.
The May 8, 2026 first-quarter release was routine by itself, but it confirmed that management is still using the market to fund expansion rather than relying on operating cash flow. Taken together, the recent 8-Ks strengthen the investment case by improving liquidity and adding a large, power-backed growth site, even though they also underline how capital intensive the buildout remains.
Financial Analysis
Growth
WULF — Financial Growth (Quarterly, USD Mil)
| Metric | 2025-03-31 | 2025-06-30 | 2025-09-30 | 2025-12-31 | 2026-03-31 | 2026-06-30 |
|---|---|---|---|---|---|---|
| REVENUE (USD Mil) | — | 47.6 | 50.6 | 35.8 | 34 | 44.8 |
| EBIT (USD Mil) | — | -14.4 | -445.2 | -60 | -349.1 | -873.3 |
| EBITDA (USD Mil) | — | 5.2 | -417.6 | -30.4 | -318.7 | -850.2 |
| NET INCOME (USD Mil) | — | -18.4 | -455.1 | -126.6 | -427.6 | -939.9 |
| DILUTED EPS | -0.2 | -0.1 | -1.1 | — | -1 | -1.9 |
Source: Yahoo Finance — Quarterly Financial Statements
Revenue was $44.8M in Q2 2026 versus $47.6M in Q2 2025, down 5.9% year over year, after $34M in Q1 2026 and $35.8M in Q4 2025. That pattern shows a choppy top line rather than steady scaling, so investors should not extrapolate one quarter’s rebound into a durable run rate. EBITDA moved much faster and much worse than revenue, falling to -$850M in Q2 2026 from -$418M in Q3 2025 and -$319M in Q1 2026, which signals operating losses are widening faster than sales can absorb them. I view the growth signal as bearish because revenue is flat to down while earnings are deteriorating sharply.
Profitability
WULF — Profitability (TTM)
| Metric | TTM |
|---|---|
| Operating Margin (TTM) | -307.0% |
| Net Margin (TTM) | 0.0% |
| Return on Assets (TTM) | -4.8% |
| Return on Equity (TTM) | -1,211.8% |
| Gross Margin (TTM) | 69.3% |
| EBITDA Margin (TTM) | -164.0% |
Source: Yahoo Finance — Trailing Twelve Months (TTM)
TTM gross margin of 69.3% shows the core hosting layer is healthy, but the TTM EBITDA margin of -164% and operating margin of -307% show overhead, development spend, and non-cash charges are overwhelming that gross profit. The gap between gross margin and EBITDA margin is especially wide, which points to a business still in heavy build-out rather than one with mature operating leverage.
TTM net margin is 0%, but that masks the scale of losses because the underlying quarterly data show large negative net income in the latest periods. TTM ROA of -4.79% and TTM ROE of -1.21e+03% both signal that capital is not yet earning a return, and the huge ROE versus ROA gap suggests leverage is amplifying the loss rather than creating durable equity returns. Investors should watch for EBITDA margin turning positive first, because that would show the platform is starting to absorb fixed costs. Bear signal: the profitability profile is still deeply negative, and the path to sustained earnings remains unproven.
Valuation
WULF — Valuation Multiples
| Metric | Value |
|---|---|
| Current Share Price (USD) | 13.8 |
| Market Cap (USD Mil) | 6,871 |
| Enterprise Value (USD Mil) | 9,429 |
| Forward P/E | -57.5 |
| Price/Sales (TTM) | 41.6 |
| Price/Book (mrq) | 46.7 |
| EV/Revenue | 57.1 |
| EV/EBITDA | -34.8 |
| Beta (5Y Monthly) | 4.25 |
| FCF Yield % (TTM) | -3.4% |
| Forward EPS (USD) | -0.2 |
| Analyst Target Price – Low (USD) | 15 |
| Analyst Target Price – Mean (USD) | 33.6 |
| Analyst Target Price – High (USD) | 65 |
| # Analyst Opinions | 24 |
Source: Yahoo Finance
TeraWulf screens as a pure valuation stress case, so I would anchor on sales and cash flow rather than earnings multiples. The stock trades at 57.1x EV/Revenue and 41.6x Price/Sales at a current share price of $13.8, which means the market is paying a very rich multiple for a business that is still far from consistent profitability. The negative 57.5x forward P/E and negative 34.8x EV/EBITDA are not useful cheapness signals here because forward EPS is -$0.24 and EBITDA is still negative, so those ratios mainly show that the equity is being priced off a future earnings recovery that has not arrived yet.
FCF Yield is -3.41%, and with levered free cash flow of -$234.1M TTM, the market is not getting cash return support today. Book value per share is $0.295, so the stock trades at 46.7x book, while total cash per share is $5.249, which helps liquidity but does not justify the valuation by itself. Beta is 4.25, so the shares also carry very high market sensitivity.
On my read, fair value sits well below the current quote unless the company proves that contracted load can turn into cash flow quickly. The analyst set is not thin, with 24 opinions, and my range would sit below the $33.6 mean target because I weight the negative free cash flow and the still-early stage of monetization more heavily than the consensus appears to. I would put the stock in a rough $6–$15 range, which is still above the implied downside from current operating losses but far below the market’s current optimism. Forward EPS of -$0.24 also looks weak versus peers that are closer to breakeven or already positive on the next year’s estimates, so WULF is not cheap on an earnings-growth basis even after adjusting for its large cash balance.
The overall valuation picture is a bear signal, and it is hard to argue otherwise while revenue is still below $50M a quarter and the business remains dependent on external financing.
Leverage
WULF — Leverage & Coverage (Quarterly)
| Metric | Value |
|---|---|
| Total Debt/Equity % (mrq) | 3,549.6 |
| Current Ratio (mrq) | 0.7 |
| Total Debt (mrq, USD Mil) | 5,236.7 |
| Operating Cash Flow (TTM, USD Mil) | -279.2 |
| Levered Free Cash Flow (TTM, USD Mil) | -234.1 |
| Net Debt/EBITDA (TTM) | -9.7 |
| FCF Margin % (TTM) | -141.7% |
Source: Yahoo Finance — Quarterly Financial Statements
TeraWulf’s leverage profile is stretched and the cash story is negative. Total Debt/Equity was 3,549.7% mrq, Current Ratio was 0.75 mrq, and Total Debt was $5.2B mrq, so the balance sheet is carrying far more debt than equity and only limited near-term liquidity. Operating Cash Flow was -$279.2M TTM, Levered Free Cash Flow was -$234.1M TTM, Net Debt/EBITDA was -9.7x TTM, and FCF Margin was -141.7% TTM, which tells me EBITDA is not converting into cash and the business is still absorbing capital rather than funding itself.
The cash cushion matters, but it does not erase the leverage problem. Total cash is $2.6B, or $5.25 per share, which gives the company time to execute, yet that liquidity is being used to bridge losses rather than to compound returns. In my opinion, this is high refinancing risk because the current ratio is below 1.0 and cash burn is ongoing, so any delay in HPC contract ramp or a tighter refinancing window would quickly pressure flexibility. Bear signal: leverage is elevated, FCF is deeply negative, and financial flexibility is constrained.
Insider Activity
The insider transaction record I see here is clearly net selling, with 13 open-market sales versus 10 purchases over 2024-12-31 to 2026-05-27. The pattern is concentrated rather than broad, led by Paul B. Prager, while the other recent activity is mostly option-related and neutral. In my view, that is a bear signal because the open-market selling is persistent and concentrated, which weakens alignment with outside shareholders.
Comparable Analysis
LF0 has published standalone analyses of these peers: Cipher Digital (CIFR) (rated Sell); MARA Holdings (MARA) (rated Sell).
Growth
| Company | Revenue TTM (USD Mil) | Revenue Growth YoY % | Diluted EPS TTM |
|---|---|---|---|
| WULF | 165.2 | -6.0% | -4.4 |
| IREN | 707 | -26.7% | -2.2 |
| APLD | 872.2 | 432.4% | -0.9 |
| RIOT | 674.5 | 13.9% | -3.9 |
| CIFR | 191.1 | -43.0% | -2.9 |
| MARA | 804.2 | -26.7% | -9.4 |
Source: Yahoo Finance
WULF’s revenue fell 6.0% TTM to $165.2M, while IREN fell 26.7% to $707M and MARA fell 26.7% to $804.2M, so WULF is shrinking less than two large peers even though APLD grew 432.4% to $872.2M and RIOT grew 13.9% to $674.5M. The problem is that WULF’s negative growth is still negative, so the market is paying for a recovery that has not shown up in the top line; that makes the premium to IREN and MARA easier to defend than the discount to APLD or RIOT.
Valuation
| Company | Current Share Price (USD) | Forward P/E | EV/Revenue | EV/EBITDA | Price/Sales (TTM) | Price/Book (mrq) | Beta (5Y Monthly) | FCF Yield % (TTM) | Forward EPS | Analyst Target Price – Low | Analyst Target Price – Mean | Analyst Target Price – High | # Analyst Opinions |
|---|---|---|---|---|---|---|---|---|---|---|---|---|---|
| WULF | 13.8 | -57.5 | 57.1 | -34.8 | 41.6 | 46.7 | 4.25 | -3.4% | -0.2 | 15 | 33.6 | 65 | 24 |
| IREN | 35.2 | -8.8 | 22.7 | 417.7 | 19.6 | 3.2 | 4.27 | -30.4% | -4 | 40 | 78.1 | 139 | 18 |
| APLD | 23.7 | -30.2 | 14.7 | -103.3 | 8.2 | 4 | 6 | -59.8% | -0.8 | 22 | 64.3 | 93 | 15 |
| RIOT | 16.9 | -18.1 | 10 | -7.5 | 9.4 | 2.9 | 3.76 | -11.3% | -0.9 | 22 | 31.2 | 42 | 22 |
| CIFR | 13.5 | 80.2 | 54.3 | 108.1 | 29.4 | 10 | 3.21 | -51.6% | 0.2 | 18 | 30.4 | 59 | 22 |
| MARA | 9.6 | -46 | 7.4 | -3.2 | 4.6 | 2.2 | 5.35 | -31.3% | -0.2 | 10 | 18.6 | 30 | 13 |
Source: Yahoo Finance
WULF trades at 57.1x EV/Revenue and 41.6x Price/Sales, versus RIOT at 10.0x and 9.4x, APLD at 14.7x and 8.2x, and MARA at 7.4x and 4.6x, while its FCF Yield is -3.41% versus IREN at -30.4%, APLD at -59.8%, RIOT at -11.3%, CIFR at -51.6%, and MARA at -31.3%. That FCF gap matters more than the P/E because WULF at least has $2.6B of cash, or $5.25 per share, against a $13.8 share price, but the stock still prices in a much cleaner monetization path than the -$0.24 forward EPS suggests.
Using peer EV/Revenue of 7.4x to 22.7x on WULF’s $165.2M revenue gives an implied EV of $1.2B to $3.7B. After accounting for the company’s $5.2B of debt and $2.6B of cash, that points to a rough equity value range of about $0 to $6.2 per share, which is well below the current price and shows how much execution the market is already discounting. On a like-for-like basis, WULF’s forward EPS of -$0.24 is still weaker than the peers that are closer to breakeven or positive, so the stock is not cheap just because it has a large cash balance.
Profitability
| Company | Operating Margin (TTM) | Net Margin (TTM) | Gross Margin (TTM) | EBITDA Margin (TTM) |
|---|---|---|---|---|
| WULF | -307.0% | 0.0% | 69.3% | -164.0% |
| IREN | -102.5% | -99.4% | 68.9% | 5.4% |
| APLD | -18.2% | -53.0% | 21.6% | -14.2% |
| RIOT | -122.3% | -196.3% | 28.3% | -133.3% |
| CIFR | -301.7% | 0.0% | -10.0% | 50.3% |
| MARA | -265.2% | 0.0% | 40.1% | -233.6% |
Source: Yahoo Finance
WULF’s gross margin of 69.3% is actually above IREN’s 68.9%, but its EBITDA margin of -164.0% and operating margin of -307.0% are far worse than IREN’s 5.4% and -102.5%, APLD’s -14.2% and -18.2%, and RIOT’s -133.3% and -122.3%. That pattern says the issue is not cost of revenue but scale and overhead, because WULF converts a healthy gross margin into the worst operating loss in the group.
Leverage
| Company | Total Debt/Equity % (mrq) | Current Ratio (mrq) | Total Debt (mrq, USD Mil) | Net Debt/EBITDA (TTM) | FCF Margin % (TTM) |
|---|---|---|---|---|---|
| WULF | 3,549.6 | 0.7 | 5,236.7 | -9.7 | -141.7% |
| IREN | 187.3 | 3.6 | 7,839.5 | 50.7 | -596.8% |
| APLD | 170.6 | 2.6 | 6,483.4 | -28.5 | -491.2% |
| RIOT | 40 | 1.6 | 877.8 | -0.5 | -106.6% |
| CIFR | 950.6 | 3 | 5,586.8 | 49.5 | -1,516.3% |
| MARA | 140.2 | 0.9 | 2,466 | -1.1 | -145.2% |
Source: Yahoo Finance
Total debt/equity is 3,549.7%, far above IREN’s 187.3%, APLD’s 170.6%, RIOT’s 40.0%, and MARA’s 140.2%, while current ratio is only 0.75 versus IREN’s 3.6 and APLD’s 2.6. Net debt/EBITDA is negative for all the loss-makers, but WULF’s -9.7x is not a comfort signal when free cash flow is -$234.1M TTM and FCF margin is -141.7%; the balance sheet is cash-rich today, yet the operating burn means that cash is being consumed rather than compounding.
Conclusion
I would put my rating as a strong sell because TeraWulf still has to prove that its contracted HPC pipeline can turn into recurring cash before the financing cushion gets used up. The asset base is interesting, but the stock is already priced as if that conversion is well underway, and I do not think the latest numbers support that confidence yet.
The bull case is straightforward: if Lake Mariner, Abernathy, and Muskie start converting contracted load into a positive operating margin, the business would begin to absorb fixed costs instead of consuming capital. I would raise my rating more towards a buy if EBITDA turns positive on a sustained basis and cash burn steps down materially, because that would show the buildout is finally earning its keep. On the current revenue base of $44.8M in Q2 2026, that would need to come through in the numbers quickly enough to offset the fact that the company is still carrying $5.2B of debt and only $2.6B of cash.
The bear case is that the ramp slips while free cash flow stays near the current -$234.1M TTM run rate. If that happens, I would move from strong sell to an even more defensive stance because the equity would be financed for longer without the revenue conversion investors need. A further drop in current ratio below 0.75, meaning liquidity tightens further, or another quarter where revenue stays near the low- to mid-$40M range while EBITDA remains deeply negative, would tell me the balance sheet is being asked to carry too much of the growth plan.
Weighing both sides, I think the bear case is more likely to show up first because the company still has to prove that contracted capacity turns into recurring cash before the financing cushion gets used up. The asset base is interesting, but the stock is already priced as if that conversion is well underway, and I do not think the latest numbers support that confidence yet.
What to Watch Next
- EBITDA turning positive on a sustained basis — would support moving the rating toward buy.
- Free cash flow moving materially above the current -$234.1M TTM run rate — would show the buildout is self-funding more quickly.
- Current ratio staying above 0.75 — would help preserve liquidity through the ramp.
- Revenue holding above the low- to mid-$40M quarterly range while margins improve — would confirm the HPC conversion is real.
- Contracted load at Lake Mariner, Abernathy, and Muskie converting into operating margin — would be the clearest proof that the pivot is working.
What’s your take? I rated TeraWulf (WULF) STRONG SELL above — but the goal here is to get this right, not just to publish an opinion. What would you add to this analysis, or which risk or catalyst do you think I’m under- or over-weighting? Tell me in the comments.
Sources
- SEC 10-K Annual Report — filed 2026-02-27
- SEC 8-K Filing (2026-05-26)
- SEC 8-K Filing (2026-05-08)
- SEC 8-K Filing (2026-04-16)
- SEC 8-K Filing (2026-04-15)
- SEC 8-K Filing (2026-04-14)
- SEC 8-K Filing (2026-03-16)
- SEC Form 4 Insider Transaction (2026-05-28)
- SEC Form 4 Insider Transaction (2026-05-20)
- SEC Form 4 Insider Transaction (2026-05-20)
- SEC 10-K Annual Report — FY2026
- SEC 10-K Annual Report — FY2025
- SEC 10-K Annual Report — FY2024
- SEC 10-K Annual Report — FY2023
- SEC 10-K Annual Report — FY2022
Data sourced from Yahoo Finance and SEC EDGAR. Not investment advice.
Leave a Comment