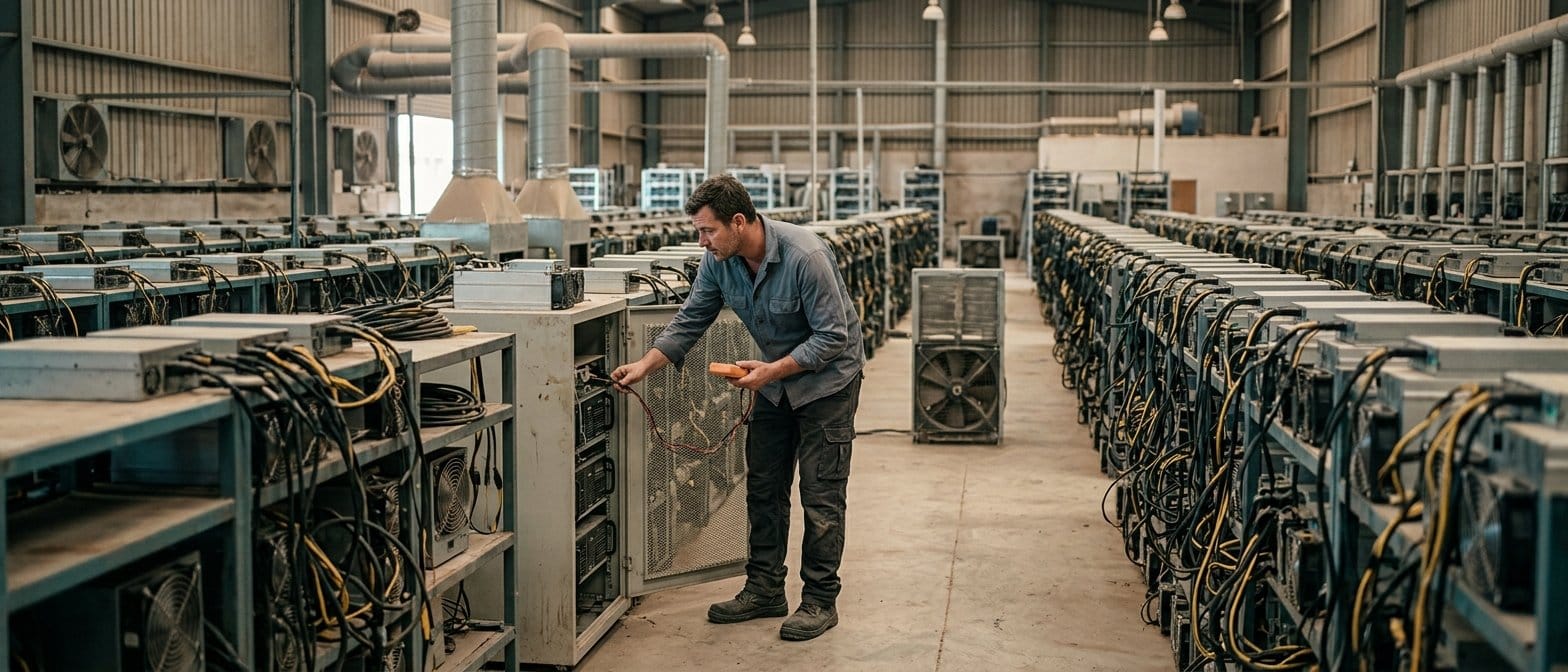
| Company | Jul 25 | Aug 25 | Sep 25 | Oct 25 | Nov 25 | Dec 25 | Jan 26 | Feb 26 | Mar 26 | Apr 26 | May 26 | Jun 26 | 12-Mo |
|---|---|---|---|---|---|---|---|---|---|---|---|---|---|
| MARA | +3% | -1% | +14% | +0% | -35% | -24% | +6% | -6% | -9% | +47% | +20% | -3% | -11% |
| RIOT | +19% | +3% | +38% | +4% | -18% | -21% | +22% | +5% | -24% | +39% | +57% | +1% | +142% |
| CLSK | +3% | -17% | +53% | +23% | -15% | -33% | +17% | -16% | -14% | +47% | +46% | -20% | +32% |
| IREN | +11% | +64% | +77% | +29% | -21% | -21% | +42% | -24% | -16% | +33% | +40% | -28% | +214% |
| HUT | +14% | +26% | +30% | +46% | -11% | +2% | +22% | -5% | -12% | +62% | +65% | -8% | +521% |
| BTDR | +12% | +11% | +20% | +30% | -40% | -16% | +16% | -41% | +12% | +31% | +55% | -9% | +38% |
Source: Yahoo Finance monthly adjusted close.
Executive Summary
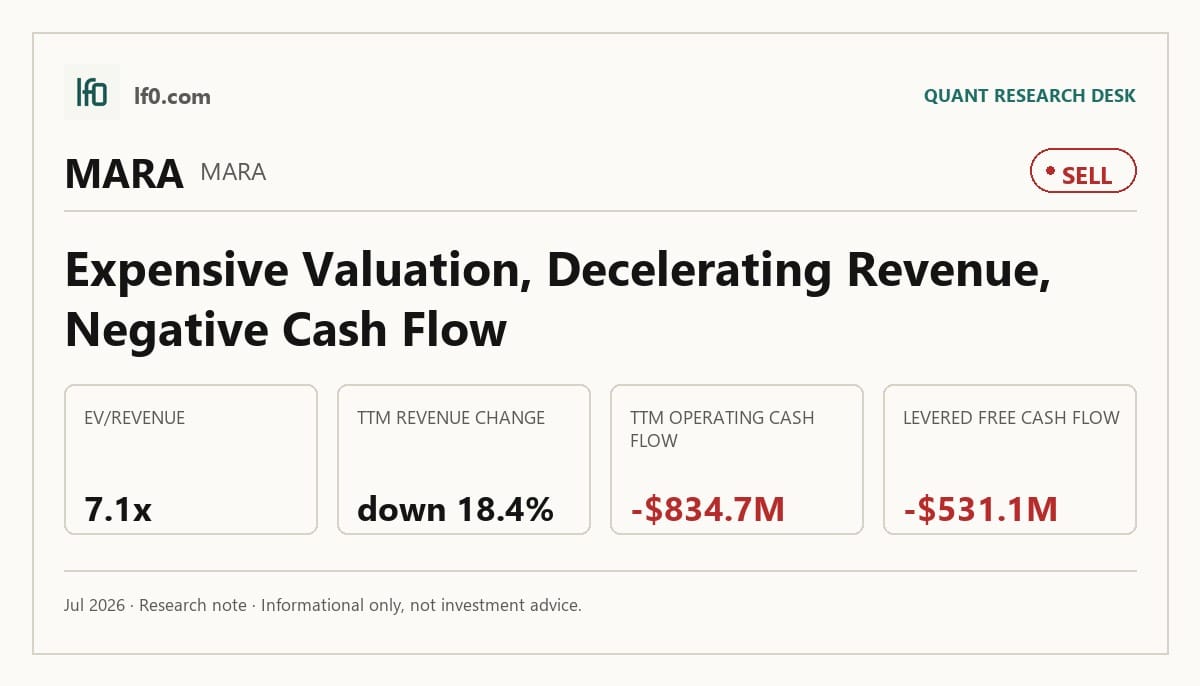
Rating: SELL | MARA
Measured from adjusted close on 2026-07-20 to 2026-10-16. Sell ratings are correct when the stock falls; Hold is tracked as a +/-10% range. Daily-close data, not intraday. Calls are tracked for 182 days from publication, then frozen as a final record.
I would put my rating as a Sell because MARA is still being valued on optionality while the core business remains cash consumptive and highly exposed to bitcoin price swings. Revenue fell to $174.6M in Q1 2026 from $213.9M in Q1 2025, and levered free cash flow was -$531.1M TTM, so the stock is not yet backed by a self-funding operating model. The one thing that could change my view is a sustained bitcoin price above roughly $90,000, which would be high enough to support cleaner mining economics and reduce the need for asset sales or dilution.
Company Profile
MARA Holdings Inc. is an energy and digital infrastructure company that earns revenue primarily by mining bitcoin with application-specific integrated circuits, then selectively monetizing bitcoin through lending, structured trading, collateralized financing, and sales. It is also building artificial intelligence inference and high-performance computing capacity, with future revenue expected from compute capacity, private cloud, and joint-venture development on power-rich sites. Founded in 2010, it changed its name from Marathon Digital Holdings, Inc. to MARA Holdings, Inc. on August 29, 2024, and it lists on Nasdaq under MARA. As of December 31, 2025, it operated across four continents and 18 data centers, with about 19 GW of total capacity and roughly 70% of operating capacity owned and controlled. At year-end 2025, it held 53,822 bitcoin and had combined cash and cash equivalents, excluding restricted cash and digital assets, of $5.3B.
Economic Moat
Business Model
The clearest structural advantage here is control of energy and digital infrastructure, not bitcoin mining itself. A competitor can buy mining rigs, but I feel it is much harder to replicate 18 data centers across four continents, roughly 19 GW of total capacity, and a portfolio that is about 70% owned without years of site control, interconnection work, and capital deployment. MARA operated about 490,000 mining rigs globally at December 31, 2025, with an energized hashrate of about 66.4 EH/s, and it is extending that footprint into AI and HPC through Exaion and the Starwood Digital Ventures agreement. That matters because the same power base can support multiple workloads, which is more durable than a pure bitcoin-mining model.
Business & Operating Risks
The main disclosed risk is still bitcoin price volatility, because revenue is primarily derived from mining bitcoin and a lower bitcoin price cuts revenue and profitability dollar for dollar. Liquidity and refinancing risk are also material: MARA may need additional capital, and its bitcoin-collateralized credit lines create margin-call exposure if collateral values fall. Operationally, the company remains dependent on hashrate, power, hardware access, and network uptime, while the Starwood and Exaion initiatives add execution and cross-border complexity. In my view, those risks do not break the moat itself, but they do threaten the economics of the platform that moat is supposed to support.
Management Discussion & Analysis
Management is actively trying to answer those risks by broadening the business beyond bitcoin mining, but the financing mix still leans on external capital and bitcoin monetization. The company started a $2B at-the-market offering in March 2025, issued $1B of 0.0% senior notes due 2032 in July 2025, and sold 35,339,308 shares under ATM programs, which tells me growth is still being funded before the new platform is proven. The shift from a full HODL posture to bitcoin sales in the second half of 2025 and in 2026 is a practical response to liquidity pressure, yet it also shows the balance sheet is still doing a lot of the work. The AI and HPC pivot is real, but it is not yet cash generative.
Recent Events
The April 29, 2026 agreement to buy Long Ridge Energy & Power for about $1.5B is the most important recent development because it adds a 485 MW combined-cycle gas plant, expected to reach 505 MW in the second half of 2026, plus 1,600 acres of industrial land with water and fiber access. That strengthens the moat thesis by giving MARA a clearer path to power-constrained digital infrastructure, not just bitcoin mining. The February 26, 2026 Strategic Agreement with Starwood Capital is similar in spirit: it gives MARA a way to develop, lease, and market U.S. data center sites while preserving mining rights if a site is not converted. The March 25, 2026 repurchase of about $1B of convertible notes is also constructive, but it was funded with bitcoin sales, so it improves the capital stack without eliminating the underlying dependence on treasury assets.
Financial Analysis
Growth
MARA — Financial Growth (Quarterly, USD Mil)
| Metric | 2025-03-31 | 2025-06-30 | 2025-09-30 | 2025-12-31 | 2026-03-31 |
|---|---|---|---|---|---|
| REVENUE (USD Mil) | 213.9 | 238.5 | 252.4 | 202.3 | 174.6 |
| EBIT (USD Mil) | -642.7 | 1,029.5 | 173.6 | -1,880.3 | -1,282.6 |
| EBITDA (USD Mil) | -484.8 | 1,191.3 | 340.9 | -1,594.5 | -1,091.1 |
| NET INCOME (USD Mil) | -533.2 | 808.2 | 123.1 | -1,709.4 | -1,259.6 |
| DILUTED EPS | -1.6 | 1.8 | 0.3 | -4.5 | -3.3 |
Source: Yahoo Finance — Quarterly Financial Statements
Revenue fell to $174.6M in Q1 2026 from $213.9M in Q1 2025, a decline of 18.4%, after peaking at $252.4M in Q3 2025 and then sliding again. EBITDA was far more volatile, swinging from -$484.8M in Q1 2025 to $1.2B in Q2 2025 before dropping back to -$1.1B in Q1 2026, which tells me the business is still dominated by bitcoin-price and mark-to-market effects rather than steady operating momentum. That volatility is consistent with the mining model, but it also means growth alone does not yet translate into durable earnings power.
Profitability
MARA — Profitability (TTM)
| Metric | TTM |
|---|---|
| Operating Margin (TTM) | -558.1% |
| Net Margin (TTM) | -234.8% |
| Return on Assets (TTM) | -15.6% |
| Return on Equity (TTM) | -67.3% |
| Gross Margin (TTM) | 45.3% |
| EBITDA Margin (TTM) | -85.9% |
Source: Yahoo Finance — Trailing Twelve Months (TTM)
TTM gross margin was 45.3%, so the core mining and energy platform still has decent unit economics before overhead. The problem is that operating margin was -558% and EBITDA margin was -85.9%, which shows the company is not converting gross profit into operating earnings. Net margin was -235%, ROA was -15.6%, and ROE was -67.3%, so capital is still destroying value rather than compounding it. The gap between gross margin and EBITDA margin is the key tell: the moat may be real, but the current cost structure is not yet letting that moat flow through to equity returns.
Valuation
MARA — Valuation Multiples
| Metric | Value |
|---|---|
| Market Cap (USD Mil) | 4,076 |
| Enterprise Value (USD Mil) | 6,127 |
| Forward P/E | -15.7 |
| Price/Sales (TTM) | 4.7 |
| Price/Book (mrq) | 1.8 |
| EV/Revenue | 7.1 |
| EV/EBITDA | -8.2 |
| Beta (5Y Monthly) | 5.37 |
| FCF Yield % (TTM) | -13.0% |
| Forward EPS (USD) | -0.7 |
| Analyst Target Price – Low (USD) | 5.5 |
| Analyst Target Price – Mean (USD) | 18.1 |
| Analyst Target Price – High (USD) | 30 |
| # Analyst Opinions | 11 |
Source: Yahoo Finance
MARA trades on sales and asset value because earnings are still negative. EV/Revenue is 7.1x, Price/Sales is 4.7x, and Price/Book is 1.8x, while forward P/E is -15.7x and EV/EBITDA is -8.2x because forward EPS is -$0.7 and EBITDA remains negative. In my view, that means the market is paying for a future step-up in monetization from bitcoin mining and AI/HPC, not for current cash generation. On the analysis here, I would put fair value in a range of about $6-$14 per share, which sits below the 18.1 analyst mean and well below the 30 high; with 11 analyst opinions, that is a real consensus, and my range is lower because I weight cash burn and leverage more heavily than the sell-side appears to. The implied EPS range is still negative, roughly -$0.8 to -$0.4 per share, which is broadly in line with the company’s own forward EPS of -$0.7 and only modestly better than peers such as RIOT and CLSK; that tells me the stock is not cheap on earnings power, even if it looks optically supported by book value. I would become more constructive only if the company starts turning gross margin into positive operating margin, because that would make the current multiple easier to defend.
Leverage
MARA — Leverage & Coverage (Quarterly)
| Metric | Value |
|---|---|
| Total Debt/Equity % (mrq) | 105.6 |
| Current Ratio (mrq) | 1.8 |
| Total Debt (mrq, USD Mil) | 2,464 |
| Operating Cash Flow (TTM, USD Mil) | -834.7 |
| Levered Free Cash Flow (TTM, USD Mil) | -531.1 |
| Net Debt/EBITDA (TTM) | -2.6 |
| FCF Margin % (TTM) | -61.2% |
Source: Yahoo Finance — Quarterly Financial Statements
Total debt to equity was 105.6%, current ratio was 1.8x, and total debt was $2.5B, while total cash was $513.7M. Operating cash flow was -$834.7M TTM and levered free cash flow was -$531.1M, so the business is still consuming liquidity rather than generating it. Net debt to EBITDA was -2.6x and FCF margin was -61.2%, but the negative EBITDA makes the leverage ratio look better than the cash flow reality. In practical terms, the balance sheet is manageable only if operating performance improves; otherwise, financing choices will keep mattering more than operating leverage.
Insider Activity
The insider transaction record is one-sided: there were 21 open-market sales and no open-market purchases over the 2025-01-13 to 2026-05-18 window. The selling was broad, with the CEO, CFO, and General Counsel all participating, which does not suggest strong alignment at the margin. I read that as a negative signal, although it is secondary to the much larger issue of cash burn and bitcoin dependence.
Comparable Analysis
Growth
| Company | Revenue TTM (USD Mil) | Revenue Growth YoY % | Diluted EPS TTM |
|---|---|---|---|
| MARA | 867.8 | -18.4% | -5.5 |
| RIOT | 653.3 | 3.6% | -2.5 |
| CLSK | 739.9 | -24.9% | -2.1 |
| IREN | 757.1 | -0.0% | 0.8 |
| HUT | 284.3 | 225.5% | -2.8 |
| BTDR | 739 | 169.4% | -1.6 |
Source: Yahoo Finance
MARA’s revenue fell 18.4% TTM to $867.8M, while RIOT grew 3.6% to $653.3M, CLSK fell 24.9% to $739.9M, IREN was flat at -0.0% on $757.1M, HUT surged 225.5% to $284.3M, and BTDR grew 169.4% to $739M. That leaves MARA in the middle of the pack on scale but behind the faster growers, so it is not earning a growth premium.
Valuation
| Company | Forward P/E | EV/Revenue | EV/EBITDA | Price/Sales (TTM) | Price/Book (mrq) | Beta (5Y Monthly) | FCF Yield % (TTM) | Forward EPS | Analyst Target Price – Low | Analyst Target Price – Mean | Analyst Target Price – High | # Analyst Opinions |
|---|---|---|---|---|---|---|---|---|---|---|---|---|
| MARA | -15.7 | 7.1 | -8.2 | 4.7 | 1.8 | 5.37 | -13.0% | -0.7 | 5.5 | 18.1 | 30 | 11 |
| RIOT | -26.1 | 11.6 | -23.2 | 10.6 | 2.9 | 3.81 | -6.5% | -0.7 | 20 | 29.5 | 45 | 20 |
| CLSK | -18 | 6.6 | -12.6 | 4.5 | 3.4 | 3.84 | -9.0% | -0.7 | 16 | 22.3 | 27 | 13 |
| IREN | -35.8 | 18.2 | 93.5 | 15.9 | 4.3 | 4.28 | -19.2% | -0.9 | 41 | 80.9 | 126 | 15 |
| HUT | -49.2 | 38.2 | -26.1 | 36.2 | 7.5 | 6.07 | -2.9% | -1.9 | 70 | 134.9 | 226 | 16 |
| BTDR | -30.3 | 5.8 | 9.2 | 3.5 | 3.4 | 2.47 | -28.2% | -0.4 | 15 | 22.6 | 35 | 12 |
Source: Yahoo Finance
MARA’s EV/Revenue of 7.1x sits above CLSK at 6.6x and BTDR at 5.8x, below RIOT at 11.6x, and far below IREN at 18.2x and HUT at 38.2x. On a growth-adjusted basis, that is not especially attractive because MARA’s revenue is shrinking while RIOT and the smaller names are still expanding, and the stock’s -46.5% one-year total return has lagged IREN’s 86.3% and HUT’s 313.4%. The market is paying for volatility here, not for a cleaner growth profile.
Profitability
| Company | Operating Margin (TTM) | Net Margin (TTM) | Return on Assets (TTM) | Return on Equity (TTM) | Gross Margin (TTM) | EBITDA Margin (TTM) |
|---|---|---|---|---|---|---|
| MARA | -558.1% | -234.8% | -15.6% | -67.3% | 45.3% | -85.9% |
| RIOT | -280.5% | -132.8% | -12.1% | -32.5% | 32.4% | -50.0% |
| CLSK | -246.3% | -67.7% | -18.2% | -34.8% | 50.7% | -52.4% |
| IREN | -64.5% | 20.9% | -3.0% | 7.7% | 68.4% | 19.4% |
| HUT | -521.5% | -109.8% | -16.2% | -27.4% | 59.7% | -146.7% |
| BTDR | -43.4% | -27.0% | 6.2% | -26.1% | 3.5% | 62.5% |
Source: Yahoo Finance
MARA’s gross margin of 45.3% is better than RIOT’s 32.4% but below CLSK’s 50.7%, IREN’s 68.4%, and HUT’s 59.7%. The more important comparison is EBITDA margin: MARA is at -85.9%, worse than RIOT at -50.0%, CLSK at -52.4%, and far behind IREN at 19.4% and BTDR at 62.5%. That spread says MARA’s problem is not just mining economics; it is overhead and operating intensity.
Leverage
| Company | Total Debt/Equity % (mrq) | Current Ratio (mrq) | Total Debt (mrq, USD Mil) | Net Debt/EBITDA (TTM) | FCF Margin % (TTM) |
|---|---|---|---|---|---|
| MARA | 105.6 | 1.8 | 2,464 | -2.6 | -61.2% |
| RIOT | 36.6 | 1.1 | 877.2 | -2.1 | -68.2% |
| CLSK | 181.6 | 8.3 | 1,790.7 | -3.9 | -40.6% |
| IREN | 148.8 | 3.7 | 3,964.9 | 11.9 | -305.3% |
| HUT | 25 | 0.9 | 422.9 | -0.6 | -105.7% |
| BTDR | 277.9 | 1.8 | 2,028.7 | 3.8 | -99.6% |
Source: Yahoo Finance
MARA’s debt to equity of 105.6% is higher than RIOT’s 36.6% and HUT’s 25.0%, but lower than CLSK’s 181.6%, IREN’s 148.8%, and BTDR’s 277.9%. The current ratio of 1.8x is better than RIOT’s 1.1x and HUT’s 0.9x, yet the company still posted -$531.1M of levered free cash flow, so liquidity is not the same as self-funding capacity. IREN’s positive operating cash flow and BTDR’s lower debt-to-equity show that balance-sheet quality can support a richer valuation, which is why MARA does not deserve to trade as if leverage were a strength.
Conclusion
I would put my rating as a Sell because the key tension is still unresolved: MARA has built a more defensible infrastructure base, but the numbers have not yet shown that this base can absorb bitcoin volatility and still produce positive cash flow. TTM operating cash flow was -$834.7M and levered free cash flow was -$531.1M, so the moat is not yet translating into equity value in a way I can underwrite with confidence.
I would raise my rating more towards a Hold if bitcoin stays above roughly $90,000, meaning the mining margin is strong enough to reduce the need for asset sales or dilution, and if the company can show a positive operating margin, meaning overhead is finally being absorbed. That would tell me the platform is beginning to fund itself rather than lean on the balance sheet. I would move from Sell to Strong Sell if bitcoin falls back below roughly $70,000, because that would likely deepen cash burn and force more aggressive financing choices at the wrong time.
My final view is that the bear case is more likely to show up first. The AI and HPC buildout is interesting, but until free cash flow turns positive, I think the stock will keep trading more on bitcoin sentiment than on durable operating progress.
What’s your take? I rated MARA Holdings (MARA) SELL above — but the goal here is to get this right, not just to publish an opinion. What would you add to this analysis, or which risk or catalyst do you think I’m under- or over-weighting? Tell me in the comments.
Sources
- SEC 10-K Annual Report — filed 2026-03-02
- SEC 8-K Filing (2026-05-11)
- SEC 8-K Filing (2026-04-30)
- SEC 8-K Filing (2026-03-26)
- SEC 8-K Filing (2026-02-26)
- SEC 8-K Filing (2026-02-26)
- SEC 8-K Filing (2026-02-25)
- SEC Form 4 Insider Transaction (2026-05-20)
- SEC Form 4 Insider Transaction (2026-05-20)
- SEC Form 4 Insider Transaction (2026-05-20)
- SEC 10-K Annual Report — FY2026
- SEC 10-K Annual Report — FY2025
- SEC 10-K Annual Report — FY2024
- SEC 10-K Annual Report — FY2023
- SEC 10-K Annual Report — FY2022
Data sourced from Yahoo Finance and SEC EDGAR. Not investment advice.
Leave a Comment