| Company | Oct 25 | Nov 25 | Dec 25 | Jan 26 | Feb 26 | Mar 26 | Apr 26 | May 26 | Jun 26 | Jul 26 | Aug 26 | Sep 26 | 12-Mo |
|---|---|---|---|---|---|---|---|---|---|---|---|---|---|
| WM | -10% | +9% | +1% | +1% | +8% | -4% | +1% | -9% | +6% | +2% | -3% | -6% | -6% |
| RSG | -9% | +4% | -2% | +2% | +6% | -4% | -4% | -4% | +6% | -1% | +5% | -5% | -7% |
| WCN | -5% | +5% | -1% | -4% | +3% | -6% | +1% | -9% | +12% | +0% | -1% | -7% | -12% |
| GFL | -8% | +4% | -6% | +0% | +3% | -6% | -4% | -16% | +10% | +12% | +2% | -1% | -12% |
| CWST | -7% | +9% | +2% | +3% | -8% | -15% | -0% | +4% | +18% | -7% | +3% | -13% | -15% |
| CLH | -9% | +8% | +3% | +11% | +13% | -2% | +9% | -10% | +6% | +5% | +1% | -2% | +34% |
Source: Yahoo Finance monthly adjusted close.
Quick Thesis
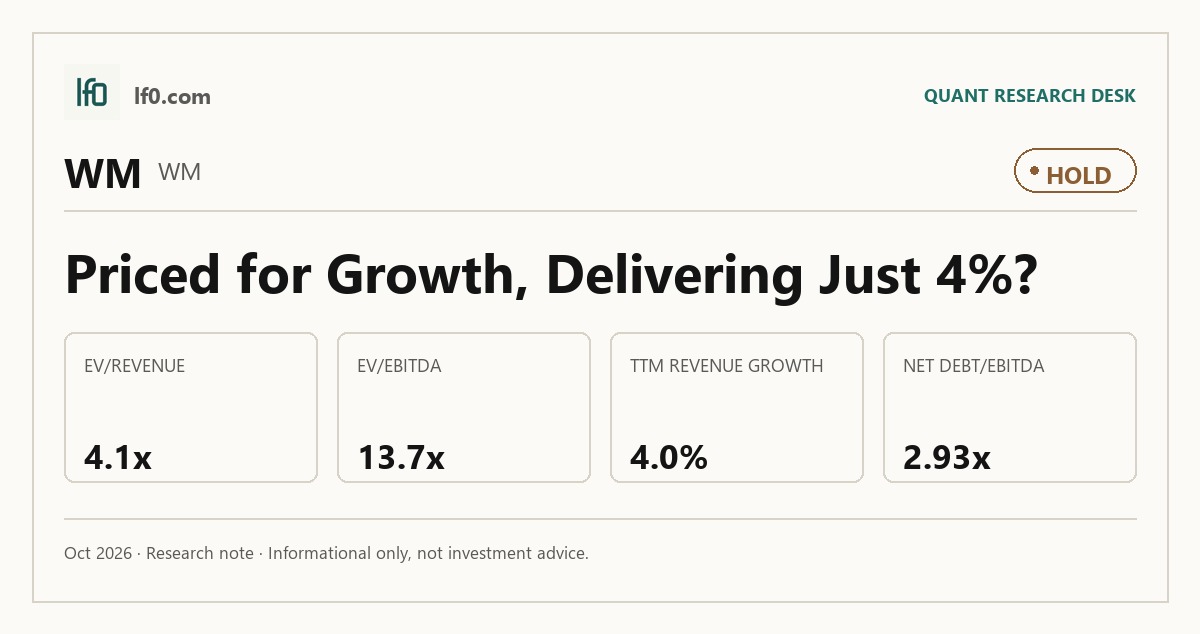
- Rated Hold — durable moat, but valuation already reflects it.
- Strongest support: $6.5B TTM operating cash flow and 19.0% operating margin.
- Main risk: $23.4B of debt and 2.93x net debt/EBITDA.
- Valuation is fair to slightly rich at 13.7x EV/EBITDA and 4.1x EV/revenue.
- I would turn more constructive if Healthcare Solutions cleans up billing and net debt/EBITDA falls below 2.5x.
Executive Summary
Rating: HOLD | WM
We’ll begin tracking this call’s performance since publication once sufficient adjusted-close data is available.
I would put my rating as a Hold because Waste Management has a durable landfill-led moat, but the stock already prices in most of that quality. The company’s 19.0% TTM operating margin and 9.2% TTM FCF margin show a business that still converts scale into cash, yet the 2.93x net debt/EBITDA ratio and 0.91 current ratio leave less room for execution error than the market multiple implies. In my view, the key tension is whether Stericycle integration can lift cash conversion faster than integration and compliance costs weigh on it. I would raise my rating toward Buy if free cash flow moves above $3B and Healthcare Solutions shows cleaner billing and collections, because that would tell me the acquisition is adding to the core franchise rather than absorbing it.
Company Profile
Waste Management, Inc. is a holding company listed on the New York Stock Exchange under WM, with operations run through subsidiaries. It serves the U.S. and Canada through collection, transfer, disposal, recycling, renewable energy, and healthcare waste services. The 2024 Stericycle acquisition added regulated waste and secure information destruction, which broadened the company beyond traditional municipal and industrial waste. The business owns or operates 257 landfill sites, 342 transfer stations, 113 recycling facilities, 49 organics facilities, 103 landfill gas projects, 42 autoclave facilities, 17 medical waste incinerators, and 99 secure information destruction sites.
Economic Moat
Business Model
The landfill network is the hardest asset for a well-funded competitor to replicate quickly. Waste Management owned or operated 253 solid waste landfills and four hazardous waste landfills as of December 31, 2025, and that scale matters because landfill ownership is the gatekeeper to disposal economics, internalization, and higher consolidated margins. I feel that a rival could buy trucks or add collection routes faster than it could assemble a comparable permitted disposal footprint, because siting, permitting, closure obligations, and local opposition create a long build cycle. The 342 transfer stations reinforce that advantage by making the network more efficient in dense urban markets, so the moat is not just the landfill count but the connected system that feeds it.
Business & Operating Risks
The most material disclosed risk is the Stericycle integration, because the current 10-K ties it directly to the Healthcare Solutions segment and to billing, pricing, and systems execution. According to the risk factors in their SEC 10-K, the acquired business faces ERP system and related billing and collection issues, customer loss from service frustration, and delayed revenue growth from planned pricing increases. That risk threatens the moat less than it threatens cash conversion: the landfill network still exists, but the integration can delay the earnings benefit the broader platform was supposed to deliver. The second risk is landfill regulation and permitting, especially PFAS and other emerging contaminants, which can lift operating costs and constrain capacity even when demand is steady.
Management Discussion & Analysis
Management is still treating Stericycle integration as the main capital allocation priority, while also keeping shareholder returns in place. Waste Management spent $404M on acquisitions in 2025 and still carried $22.9B of debt at year-end, yet it authorized up to $3B of future share repurchases and lifted the quarterly dividend to $0.945 for 2026. That tells me management is confident in cash generation, but not so confident that it is willing to ignore integration risk or balance-sheet discipline. The 2025 free cash flow improvement to $2.9B from $2.3B in 2024 also supports the idea that the portfolio is moving into a harvest phase, which is important because the moat only compounds if cash conversion keeps improving.
Recent Events
The March 20, 2026 amendment to the revolving credit agreement adds back equity-based compensation and interest accretion in the leverage ratio test. That loosens covenant optics without changing the underlying business, so it gives management a little more room to fund integration and capital returns. I also view the leadership changes as constructive: Devina Rankin’s transition, Rafael Carrasco’s retirement, and Tara Hemmer’s promotion to chief operating officer point to continuity rather than a strategic reset. The annual meeting was clean as well, with all nine director nominees elected and the auditor ratified, which suggests no governance stress around the integration.
Financial Analysis
Growth
WM — Financial Growth (Quarterly, USD Mil)
| Metric | 2025-06-30 | 2025-09-30 | 2025-12-31 | 2026-03-31 | 2026-06-30 |
|---|---|---|---|---|---|
| REVENUE (USD Mil) | 6,430 | 6,443 | 6,313 | 6,227 | 6,684 |
| EBIT (USD Mil) | 1,160 | 1,000 | 1,158 | 1,116 | 1,257 |
| EBITDA (USD Mil) | 1,868 | 1,729 | 1,928 | 1,812 | 1,995 |
| NET INCOME (USD Mil) | 726 | 603 | 742 | 723 | 785 |
| DILUTED EPS | 1.8 | 1.5 | 1.8 | 1.8 | 1.9 |
Source: Yahoo Finance — Quarterly Financial Statements
WM’s revenue has been choppy but still positive: $6.2B in Q1 2026 rose to $6.7B in Q2 2026, after $6.3B in Q4 2025 and $6.4B in Q3 2025. EBITDA grew from $1.8B in Q1 2026 to $2B in Q2 2026, while net income moved from $723M to $785M, so operating leverage is still working. The Q2 step-up looks like a normal seasonal rebound rather than a one-off, which matters because the thesis depends on recurring cash generation rather than a single quarter of strength.
Profitability
WM — Profitability (TTM)
| Metric | TTM |
|---|---|
| Operating Margin (TTM) | 19.0% |
| Net Margin (TTM) | 11.1% |
| Return on Assets (TTM) | 6.6% |
| Return on Equity (TTM) | 29.8% |
| Gross Margin (TTM) | 40.6% |
| EBITDA Margin (TTM) | 30.3% |
Source: Yahoo Finance — Trailing Twelve Months (TTM)
TTM operating margin was 19.0%, gross margin was 40.6%, and EBITDA margin was 30.3%, so the company still keeps a healthy spread between what it collects and what it spends to run the network. TTM net margin was 11.1%, which means depreciation, amortisation, interest, and taxes still take a large bite out of earnings, but the business is clearly profitable at the GAAP level. TTM return on assets was 6.57% and TTM return on equity was 29.8%; the wide ROE versus ROA spread shows leverage is amplifying returns, so I would want to see ROA keep rising as Stericycle integration matures.
Valuation
WM — Valuation Multiples
| Metric | Value |
|---|---|
| Current Share Price (USD) | 208.6 |
| Market Cap (USD Mil) | 83,379 |
| Enterprise Value (USD Mil) | 106,316 |
| Trailing P/E | 29.5 |
| Forward P/E | 23 |
| Price/Sales (TTM) | 3.2 |
| Price/Book (mrq) | 8.4 |
| EV/Revenue | 4.1 |
| EV/EBITDA | 13.7 |
| Beta (5Y Monthly) | 0.43 |
| FCF Yield % (TTM) | 2.8% |
| Forward EPS (USD) | 9.1 |
| Analyst Target Price – Low (USD) | 220 |
| Analyst Target Price – Mean (USD) | 257.6 |
| Analyst Target Price – High (USD) | 277 |
| # Analyst Opinions | 25 |
Source: Yahoo Finance
WM trades at 4.1x EV/revenue, 13.7x EV/EBITDA, 29.5x trailing P/E, and 23x forward P/E, with a 2.8% FCF yield and a 0.43 beta. At a current share price of $209, investors are paying 8.4x book value and 22.9x forward EPS, so the stock is not cheap on earnings or asset value. On the analysis here, I would put fair value in a range of roughly $140-$261 per share, which is broad enough to include the current price but not wide enough to argue for a clear discount. That range sits inside the $220-$$277 analyst target band and below the $258 mean, which tells me the market is already giving WM credit for steady execution. The company’s 9.09 forward EPS is also solid versus peers, but the premium multiple is only partly justified by that earnings power.
Leverage
WM — Leverage & Coverage (Quarterly)
| Metric | Value |
|---|---|
| Total Debt/Equity % (mrq) | 235.3 |
| Current Ratio (mrq) | 0.9 |
| Total Debt (mrq, USD Mil) | 23,356 |
| Operating Cash Flow (TTM, USD Mil) | 6,517 |
| Levered Free Cash Flow (TTM, USD Mil) | 2,348.4 |
| Net Debt/EBITDA (TTM) | 2.9 |
| FCF Margin % (TTM) | 9.2% |
Source: Yahoo Finance — Quarterly Financial Statements
WM’s leverage is elevated but still serviceable. Total debt/equity was 235.3%, the current ratio was 0.907, and total debt was $23.4B, so the balance sheet is debt-heavy and working capital is tight. Against that, operating cash flow was $6.5B and levered free cash flow was $2.3B, which shows the business still throws off meaningful cash after interest and capex. Net debt/EBITDA was 2.93x and FCF margin was 9.2%, so EBITDA is converting to cash, but not with a large cushion. In my view this is a medium refinancing risk because cash generation is solid, yet the sub-1.0 current ratio and 2.93x net leverage leave less room if rates stay high or integration spending rises.
Insider Activity
The insider transaction record is one-sided selling: 67 open-market sales, $66.4M total, and no open-market purchases in the 2025-01-15 to 2026-06-05 window. The activity is broad, with multiple executives selling rather than one isolated seller, so I read it as a weak alignment signal for shareholders rather than a strong one. That does not break the thesis, but it does mean management is not signaling conviction through buying.
Comparable Analysis
Growth
| Company | Revenue TTM (USD Mil) | Revenue Growth YoY % | EBITDA TTM (USD Mil) | Diluted EPS TTM |
|---|---|---|---|---|
| WM | 25,667 | 4.0% | 7,774 | 7.1 |
| RSG | 16,891 | 4.6% | 5,257 | 7 |
| WCN | 9,763.9 | 6.4% | 3,124.5 | 4.1 |
| GFL | 6,972.2 | 16.3% | 1,674.8 | -0.5 |
| CWST | 1,955.5 | 16.9% | 419 | 0.1 |
| CLH | 6,243.6 | 11.9% | 1,196.7 | 8.2 |
Source: Yahoo Finance
WM’s revenue growth of 4.0% TTM sits just below RSG’s 4.6% and well below WCN’s 6.4%, GFL’s 16.3%, CWST’s 16.9%, and CLH’s 11.9%, while WM’s diluted EPS of 7.1 is almost identical to RSG’s 7.0 and ahead of WCN’s 4.1 and GFL’s -0.5. I read that as a mature, steady-growth profile rather than a growth leader, so the market should not pay a large growth premium unless WM can move beyond mid-single-digit top-line expansion.
Valuation
| Company | Current Share Price (USD) | Trailing P/E | Forward P/E | EV/Revenue | EV/EBITDA | Price/Sales (TTM) | Price/Book (mrq) | Market Cap (USD Mil) | Enterprise Value (USD Mil) | Beta (5Y Monthly) | FCF Yield % (TTM) | Forward EPS | Analyst Target Price – Low | Analyst Target Price – Mean | Analyst Target Price – High | # Analyst Opinions |
|---|---|---|---|---|---|---|---|---|---|---|---|---|---|---|---|---|
| WM | 208.6 | 29.5 | 23 | 4.1 | 13.7 | 3.2 | 8.4 | 83,379 | 106,316 | 0.43 | 2.8% | 9.1 | 220 | 257.6 | 277 | 25 |
| RSG | 215.5 | 30.6 | 26.7 | 4.8 | 15.3 | 3.9 | 5.5 | 65,995 | 80,386 | 0.40 | 2.9% | 8.1 | 208 | 245.1 | 272 | 24 |
| WCN | 153.6 | 37.1 | 24.7 | 5 | 15.6 | 4 | 4.9 | 38,633 | 48,646 | 0.48 | 2.7% | 6.2 | 162 | 200.4 | 220 | 25 |
| GFL | 42.2 | — | 46.5 | 3.6 | 15.1 | 2.2 | 2.9 | 15,221 | 25,305 | 0.51 | 2.2% | 0.9 | 40 | 50.5 | 63.1 | 13 |
| CWST | 83.5 | 927.4 | 57 | 3.5 | 16.1 | 2.7 | 3.4 | 5,312 | 6,748 | 0.78 | 2.3% | 1.5 | 91 | 111 | 130 | 10 |
| CLH | 317.5 | 38.5 | 31.7 | 3.1 | 16.2 | 2.7 | 5.7 | 16,762 | 19,389 | 0.88 | 2.3% | 10 | 325 | 359.1 | 390 | 15 |
Source: Yahoo Finance
WM’s 2.8% FCF yield is slightly below RSG’s 2.9%, above WCN’s 2.7%, and ahead of GFL’s 2.2% and the 2.3% yields at CWST and CLH. On revenue, WM’s 4.1x EV/revenue is cheaper than RSG’s 4.8x and WCN’s 5.0x, while its 29.5x trailing P/E is below WCN’s 37.1x but still above the cheaper cash-yield names. A $1 investment one year ago would be worth $1.0 in WM, $1.0 in RSG, $0.9 in WCN, $0.9 in GFL, $0.9 in CWST, and $1.4 in CLH, so WM has lagged the best operator in the group by a wide margin. I think the market is paying for stability and cash generation, but not for a re-rating that the stock has not earned yet.
Profitability
| Company | Operating Margin (TTM) | Net Margin (TTM) | Return on Assets (TTM) | Return on Equity (TTM) | Gross Margin (TTM) | EBITDA Margin (TTM) |
|---|---|---|---|---|---|---|
| WM | 19.0% | 11.1% | 6.6% | 29.8% | 40.6% | 30.3% |
| RSG | 20.4% | 12.9% | 6.2% | 18.2% | 43.0% | 31.1% |
| WCN | 19.7% | 10.9% | 5.5% | 13.0% | 42.5% | 32.0% |
| GFL | 6.9% | -2.9% | 1.3% | -2.3% | 20.2% | 24.0% |
| CWST | 5.0% | 0.3% | 1.7% | 0.4% | 33.4% | 21.4% |
| CLH | 15.5% | 7.0% | 6.1% | 15.6% | 32.3% | 19.2% |
Source: Yahoo Finance
WM’s 19.0% operating margin, 11.1% net margin, 40.6% gross margin, and 30.3% EBITDA margin are all ahead of GFL’s 6.9%, -2.9%, 20.2%, and 24.0%, and also above CWST’s 5.0%, 0.3%, 33.4%, and 21.4%. Against RSG, though, WM trails on operating margin by 1.4 points and net margin by 1.8 points, which suggests WM’s economics are solid but not best in class. The gap looks more like peer scale and route density than a structural weakness, but it still limits how much multiple expansion I would expect.
Leverage
| Company | Total Debt/Equity % (mrq) | Current Ratio (mrq) | Total Debt (mrq, USD Mil) | Operating Cash Flow TTM (USD Mil) | Free Cash Flow TTM (USD Mil) | Net Debt/EBITDA (TTM) | FCF Margin % (TTM) |
|---|---|---|---|---|---|---|---|
| WM | 235.3 | 0.9 | 23,356 | 6,517 | 2,348.4 | 2.9 | 9.2% |
| RSG | 118.8 | 0.6 | 14,295 | 4,542 | 1,942.6 | 2.7 | 11.5% |
| WCN | 121.7 | 0.7 | 9,638.6 | 2,513.2 | 1,048.7 | 3.1 | 10.7% |
| GFL | 134.5 | 0.8 | 10,142.3 | 1,421.5 | 328.6 | 5.9 | 4.7% |
| CWST | 91.6 | 1 | 1,447.7 | 351.1 | 121.7 | 3.4 | 6.2% |
| CLH | 111 | 2.1 | 3,249.1 | 902.5 | 383.8 | 2.3 | 6.2% |
Source: Yahoo Finance
WM’s 235.3% debt/equity and 2.9x net debt/EBITDA are higher than RSG’s 118.8% and 2.7x, but lower than GFL’s 134.5% and 5.9x, while WM’s 9.2% FCF margin is below RSG’s 11.5% and above GFL’s 4.7%. That mix says WM is using leverage as a financing choice rather than a distress signal, but the balance sheet is not as conservative as RSG’s, so the valuation should not assume a lower-risk capital structure than the peer median. In other words, WM’s profitability helps justify the premium, but the leverage profile keeps that premium from widening much further.
Conclusion
I would put my rating as a Hold because Waste Management’s moat is intact, but the stock already prices in most of the quality and the balance-sheet cushion is not wide enough to ignore execution risk. The business is generating 19.0% operating margin and $6.5B of operating cash flow, yet it is also carrying $23.4B of debt and still working through Stericycle integration, so the next leg of upside depends on cash conversion improving rather than just staying stable.
The bull case is that Stericycle integration keeps improving while pricing and mix continue to lift cash conversion. If free cash flow moves above $3B over the next year, meaning the company is clearly converting more of its earnings into cash, WM could fund the $0.945 quarterly dividend, keep repurchases active, and pull net debt/EBITDA closer to 2.5x. That would make the current multiple easier to defend and would also support a move toward the upper end of the analyst target range.
The bear case is that billing and collection issues, PFAS-related landfill costs, or recycling commodity weakness slow cash conversion before the market gets paid back for the acquisition. If Healthcare Solutions keeps lagging and free cash flow stays near $2.3B while debt remains above $23B, leverage would stay close to 3.0x and the stock would be left relying on a premium multiple without enough earnings acceleration to support it. A further drop in recycling revenue, similar to the $166M year-over-year decline cited in the filing, would make that downside case more credible because it would show the non-landfill businesses are still too volatile to offset integration drag.
Weighing both sides, I lean to Hold rather than Buy because the upside case depends on execution that is still in progress, while the downside is cushioned by the landfill network and recurring cash flow. I would become more constructive if free cash flow clearly moved above $3B and Healthcare Solutions showed clean billing and collection trends for several quarters, because that would tell me the acquisition is adding to, not just absorbing, the core franchise.
What to Watch Next
- Free cash flow above $3B — would support a move toward Buy.
- Healthcare Solutions billing and collections — cleaner trends would show integration is working.
- Net debt/EBITDA below 2.5x — would improve balance-sheet flexibility.
- Recycling revenue trend — another sharp decline would weaken the non-landfill offset.
- PFAS and landfill compliance costs — faster inflation would pressure margins.
What’s your take? I rated Waste Management (WM) HOLD above — but the goal here is to get this right, not just to publish an opinion. What would you add to this analysis, or which risk or catalyst do you think I’m under- or over-weighting? Tell me in the comments.
Sources
- SEC 10-K Annual Report — filed 2026-02-09
- SEC 8-K Filing (2026-05-14)
- SEC 8-K Filing (2026-05-13)
- SEC 8-K Filing (2026-04-28)
- SEC 8-K Filing (2026-03-25)
- SEC 8-K Filing (2026-03-13)
- SEC 8-K Filing (2026-03-06)
- SEC Form 4 Insider Transaction (2026-06-08)
- SEC Form 4 Insider Transaction (2026-05-21)
- SEC Form 4 Insider Transaction (2026-05-21)
- SEC 10-K Annual Report — FY2026
- SEC 10-K Annual Report — FY2025
- SEC 10-K Annual Report — FY2024
- SEC 10-K Annual Report — FY2023
- SEC 10-K Annual Report — FY2022
Data sourced from Yahoo Finance and SEC EDGAR. Not investment advice.
Leave a Comment