Expected price range
Each range is set from the stock’s recent price history and our Strong Sell rating, using its own 1-year realised volatility (47% annualised) as the width of a ~68% statistical band, and checked against that rating so the range leans the same way as our view. Starting price $14.51 (close 2026-11-19). The stock traded between $13.34 and $18.92 over the last 6 months and between $9.12 and $18.92 over the last year. This is an illustration of where our view and normal volatility point, not a forecast, price target or investment advice; the stock can move outside it.
| Company | Nov 25 | Dec 25 | Jan 26 | Feb 26 | Mar 26 | Apr 26 | May 26 | Jun 26 | Jul 26 | Aug 26 | Sep 26 | Oct 26 | 12-Mo |
|---|---|---|---|---|---|---|---|---|---|---|---|---|---|
| SHIP | +24% | -11% | +17% | +33% | -9% | +15% | +4% | -12% | +30% | +1% | -5% | -3% | +100% |
| SBLK | +6% | -3% | +19% | +15% | -11% | +9% | +8% | -7% | +15% | +11% | -5% | -3% | +62% |
| GSL | +13% | -0% | +7% | +11% | -9% | +9% | -8% | +3% | +18% | +2% | -1% | -5% | +41% |
| DSX | +13% | -16% | +40% | +11% | -3% | +0% | -6% | -11% | +16% | +13% | +1% | -9% | +45% |
| ESEA | +5% | -8% | +5% | +20% | -2% | +5% | -9% | +5% | +19% | -3% | -6% | -6% | +22% |
| SB | +13% | -9% | +18% | +15% | -3% | +6% | -7% | +2% | +24% | +12% | -1% | -6% | +76% |
Source: Yahoo Finance monthly adjusted close.
Quick Thesis
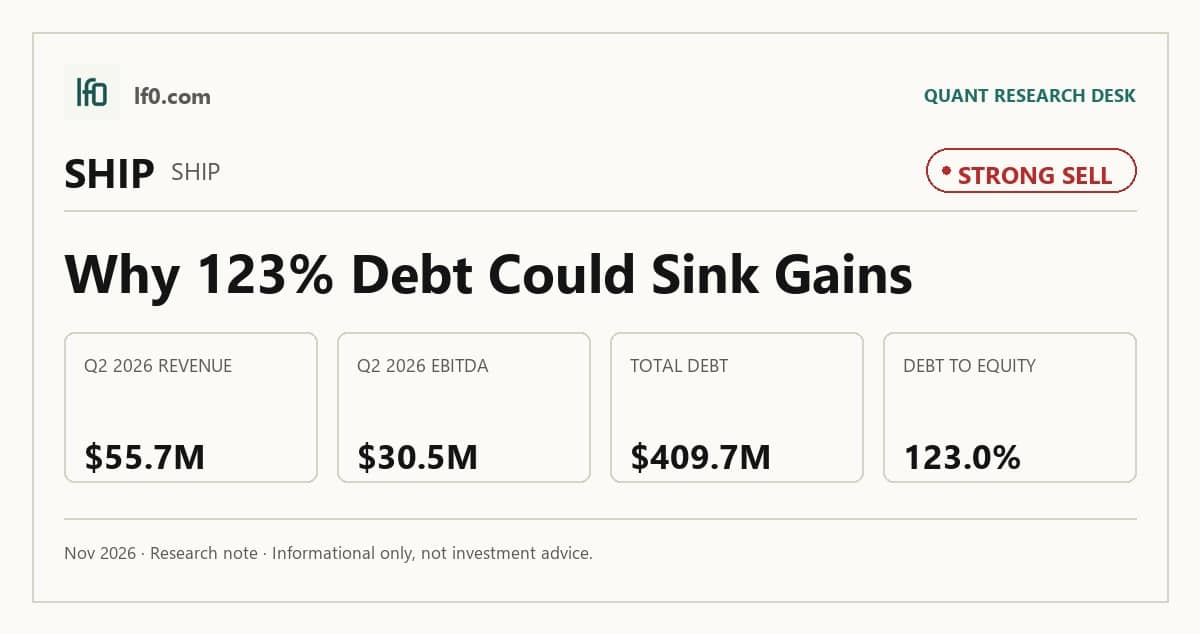
- Rated strong sell because leverage and cyclicality leave too little margin for error.
- Q2 2026 revenue was $55.7M, with EBITDA at $30.5M.
- Total debt was $409.7M, or 123.0% of equity.
- The stock trades at 7.0x EV/EBITDA and 5.1x trailing P/E.
- I would only turn less bearish if EBITDA stays above $30M and debt starts falling.
Executive Summary
We’ll begin tracking this call’s performance since publication once sufficient adjusted-close data is available.
I would put my rating as a strong sell because Seanergy’s earnings are improving, but the balance sheet still leaves too little room for a dry bulk rate setback. Revenue rose to $55.7M in Q2 2026 from $37.5M in Q2 2025, and EBITDA climbed to $30.5M from $8.5M, so the fleet is earning through the cycle rather than merely surviving it. Even so, debt of $409.7M against equity of $321.1M keeps the capital structure tight, which means the equity still depends on rate strength holding up. I would only move toward a less bearish view if EBITDA stays above $30M for another quarter and debt begins to fall, because that would show the current earnings run rate is durable rather than a one-quarter spike.
Company Profile
Seanergy Maritime Holdings Corp. is an international dry bulk shipping company that transports iron ore, coal, bauxite, and grains worldwide through 18 Capesize vessels and 2 Newcastlemax vessels with about 3.6M deadweight tons of capacity. It earns revenue mainly from long-term time charters tied to Baltic Exchange Capesize index rates, with some vessels on bareboat charter and sale and leaseback structures that finance fleet growth. The company was incorporated in the Republic of the Marshall Islands on January 4, 2008 as Seanergy Merger Corp. and changed its name to Seanergy Maritime Holdings Corp. on July 11, 2008. It is headquartered in Glyfada, Greece and listed on Nasdaq under SHIP. As of the 2026 20-F, it had five newbuildings under construction, four Capesize and one Newcastlemax, while one Capesize vessel was agreed for sale.
Economic Moat
Business Model
The fleet’s long-term time charters are the most defensible element here, because every vessel is already employed under index-linked contracts tied to the 5-routes time charter average of the Baltic Capesize Index, and two vessels earn a fixed floor rate plus profit sharing. I feel that this structure is harder to replicate than a simple spot book because it combines charter coverage, charterer relationships, and vessel-specific optionality on rate conversion, so a well-funded entrant would need years to build the same counterparty access. A secondary support comes from the fleet itself: Seanergy owns or finance leases 18 Capesize dry bulk vessels and 2 Newcastlemax dry bulk vessels with approximately 3,633,861 dwt, and the company also has five newbuilding vessels under construction. In my view, that asset base is still exposed to dry bulk cyclicality, but the charter mix and the ability to shift some vessels between fixed and floating exposure give the business more resilience than a pure spot operator.
Five years ago, the business was smaller and more levered to balance-sheet repair than to fleet renewal. In 2020’s 10-K, prior filings showed a fleet centered on older Capesize tonnage and a restructuring backdrop, while today the company has 20 owned or finance-leased vessels, five newbuildings under construction, and one agreed vessel sale, which means the portfolio is being actively refreshed rather than merely maintained. The 2023 acquisition of the M/V Titanship through a bareboat charter, the 2024 purchases of the M/V Iconship and M/V Kaizenship, and the 2025 additions of the M/V Meiship and M/V Blueship show a clear pivot toward younger, more efficient tonnage, while the 2025 sale of the M/V Geniuship and the 2026 agreement to sell the M/V Squireship show capital is being recycled out of older assets. The 2023 SAFeCRAFT Project Consortium, a European Union funded alternative-fuels program that will retrofit one Capesize vessel to use hydrogen for electric power generation, adds an environmental angle that did not exist in the earlier fleet model. On balance, the business is structurally stronger than five years ago because the fleet is larger, more modern, and more contract-protected, even though it remains a cyclical shipping platform.
Business & Operating Risks
The most material disclosed risk is charter rate volatility, because Seanergy is almost entirely exposed to index-linked dry bulk earnings and the filing explicitly says charter hire rates remain significantly below their historic high and that a decline could hurt earnings, revenue, profitability, and covenant compliance. That risk is already visible in the financial data: the stock’s economics are tied to the Baltic Capesize Index, and lower index rates flow straight into revenue while the fixed cost base and debt service stay in place. The current financial data also makes the sensitivity clear: with $409.7M of debt outstanding, even a modest rate drop would pressure cash flow and could force waivers or asset sales if lenders tighten terms.
A second company-specific risk is the combination of vessel value declines and covenant pressure. According to the risk factors in their SEC 10-K, a fall in vessel values could limit the amount of funds that the company can borrow or trigger breaches of certain financial covenants, and the filing adds that lenders could accelerate debt and foreclose on vessels if covenants are missed. That is not hypothetical boilerplate for Seanergy because the fleet is concentrated in Capesize and Newcastlemax vessels, so a broad dry bulk de-rating would hit both earnings and collateral values at the same time. The financial data in this article already shows why this matters: $409.7M of debt against a small fleet means asset coverage is central to the credit story, and any vessel value decline would tighten the balance sheet quickly.
The third risk that stands out is the new U.S. and China port fee regime. The filing gives specific rates of $50 per net ton for Chinese owners and $18 per net ton for Chinese built vessels, rising to $140 per net ton and $33 per net ton by 2028, with implementation still uncertain and a one-year suspension ending November 10, 2026. Seanergy currently operates 20 vessels and says one was constructed in China, so the direct exposure may be limited, but the indirect risk is real because charterers could demand lower rates if fees are passed through. The financial data does not yet show a direct hit, so this is a forward cost risk rather than a current earnings drag.
The risk picture has shifted materially over five years. In prior filings, pandemic disruption was a prominent operating risk, but the current 10-K still lists epidemic and pandemic disease only as a generic industry risk, which has faded from the center of the story. By contrast, the current filing adds much sharper language around U.S. and China port fees, the 2025 tariff actions, and the 2026 suspension deadline, which were not present in the same form in earlier filings. The current filing also elevates climate compliance, with the IMO net zero framework postponed until October 2026 and the EU Emissions Trading Scheme and FuelEU Maritime Regulation already in force, so regulatory cost pressure is more concrete than it was three years ago. The disclosed risks do not threaten the charter-based moat itself, but they do directly threaten the leverage that makes the equity fragile.
Management Discussion & Analysis
Management is leaning on refinancings and sale and leasebacks rather than outright deleveraging, which tells me the company is funding liquidity first and balance-sheet repair second. As of December 31, 2025, outstanding borrowings were $294M, and as of March 28, 2026, they had risen to $380.2M, so the balance sheet is being kept liquid by rolling and rewrapping debt rather than shrinking it. The company also entered into five sale and leaseback agreements after year end, including the BOCL Partnership Sale and Leaseback, a $26.5M financing for the M/V Partnership, and the BOCL Newbuilding 1 Sale and Leaseback, a $57.8M pre-delivery financing for a scrubber-fitted Newcastlemax vessel; that supports near-term funding needs, but it also adds another layer of vessel-level obligations instead of reducing leverage. Management’s 2026 liquidity needs include the $83.7M balloon payment for the M/V Dukeship and $238.0M of shipbuilding contract payments, so the capital plan is clearly expansionary and refinancing dependent, not a balance-sheet repair plan. The fact that the fleet is almost entirely on index-linked charters also means management is leaning into market exposure rather than locking in certainty, so the earnings path remains tied to dry bulk rates and vessel availability.
Prior filings were directionally mixed but mostly supportive of management’s credibility. In 2025’s 20-F, management said the Piraeus Bank Loan Facility would extend maturity and lower cost, and the current filing confirms that the facility was fully refinanced on February 27, 2025, with the new $53.6M Piraeus Bank term loan carrying term SOFR plus 2.05%, so that commitment was delivered. Prior filings also pointed to refinancing the August 2021 Alpha Bank Loan Facility, and the current 20-F shows that the outstanding $10.9M and $4.4M tranches were fully refinanced on March 20, 2025, again confirming execution. The weaker point is tone versus results: prior-year language leaned on liquidity and flexibility, yet 2025 revenue fell 6.0% to $158.1M and net income fell 51.0% to $21.2M, so the operating backdrop was softer than the financing narrative implied. Management has executed on refinancing, but the dependence on sale and leaseback structures alongside a 16.0% drop in TCE to $20,937 in 2025 shows that capital actions have outpaced operating improvement.
Recent Events
The most recent corporate developments reinforce the same tension: Seanergy is extending liquidity, but it is doing so while keeping the equity tied to a volatile freight market. The refinancing of the Piraeus Bank and Alpha Bank facilities reduced near-term maturity pressure, and the post-year-end sale and leaseback transactions added funding capacity for newbuildings and vessel obligations. That supports the moat by keeping the fleet intact, but it also confirms that management is still using asset-level financing to bridge the gap between operating cash flow and capital needs.
Financial Analysis
LF0 has published standalone analyses of these peers: Star Bulk Carriers (SBLK) (rated Hold).
Growth
SHIP — Financial Growth (Quarterly, USD Mil)
| Metric | 2025-06-30 | 2025-09-30 | 2025-12-31 | 2026-03-31 | 2026-06-30 |
|---|---|---|---|---|---|
| REVENUE (USD Mil) | 37.5 | 47 | 49.4 | 42.9 | 55.7 |
| EBIT (USD Mil) | 8.5 | 18.3 | 15.6 | 14.5 | 30.5 |
| EBITDA (USD Mil) | 8.5 | 18.3 | 15.6 | 14.5 | 30.5 |
| NET INCOME (USD Mil) | 2.9 | 12.8 | 12.5 | 9.5 | 26.2 |
| DILUTED EPS | 0.1 | 0.6 | 0.6 | 0.5 | 1.2 |
Source: Yahoo Finance — Quarterly Financial Statements
Seanergy’s revenue has turned up sharply in the latest two quarters: $42.9M in Q1 2026 versus $37.5M in Q2 2025, then $55.7M in Q2 2026. EBITDA and net income are rising faster than revenue, with EBITDA at $30.5M in Q2 2026 versus $18.3M in Q2 2025 and net income at $26.2M versus $12.8M, so operating leverage is clearly working. The Q2 2026 jump looks like a rate-driven swing rather than a structural step change, and that matters because the business can re-rate quickly when Capesize rates are firm, but it can just as quickly give back those gains if freight weakens.
Growth versus peers
| Company | Revenue TTM (USD Mil) | Revenue Growth YoY % | EBITDA TTM (USD Mil) | Diluted EPS TTM |
|---|---|---|---|---|
| SHIP | 204.7 | 22.3% | 118.1 | 2.9 |
| SBLK | 1,203 | 44.5% | 497.8 | 2.5 |
| GSL | 766.3 | 2.9% | 462 | 10.4 |
| DSX | 215.9 | 4.7% | 75.2 | 0.5 |
| ESEA | 223.8 | -5.0% | 155.5 | 19.5 |
| SB | 325.5 | 24.6% | 178.9 | 1 |
Source: Yahoo Finance
SHIP’s revenue rose 22.3% TTM to $204.7M, which trails SBLK’s 44.5% and SB’s 24.6% but beats GSL’s 2.9%, DSX’s 4.7%, and ESEA’s -5.0%. That puts SHIP in the middle of the pack, and the premium to GSL and DSX looks justified because SHIP is still compounding faster, but SBLK’s faster top-line growth makes SHIP’s smaller revenue base look less dominant than its 66.4% one-year return suggests.
Profitability
SHIP — Profitability (TTM)
| Metric | TTM |
|---|---|
| Operating Margin (TTM) | 42.0% |
| Net Margin (TTM) | 36.3% |
| Return on Assets (TTM) | 7.9% |
| Return on Equity (TTM) | 24.6% |
| Gross Margin (TTM) | — |
| EBITDA Margin (TTM) | — |
Source: Yahoo Finance — Trailing Twelve Months (TTM)
TTM operating margin of 42.0%, TTM net margin of 36.3%, TTM return on assets of 7.9%, and TTM return on equity of 24.6% show a profitable shipping platform, not a distressed one. The 5.7-point gap between operating and net margin means interest and other below-operating-line items are taking a meaningful share of earnings, so investors should watch whether net margin keeps tracking operating margin rather than slipping away from it. ROE is more than three times ROA, which means returns are being amplified by leverage rather than by asset productivity alone. That is acceptable only while charter cash flow stays firm, because leverage can cut both ways if rates soften. I would weight the operating margin and net margin most heavily here because they show the core charter business is already earning money, while the ROE premium is a financing effect. The profitability profile is a bull signal on operations, but it does not offset the balance-sheet risk elsewhere in the thesis.
Profitability versus peers
| Company | Operating Margin (TTM) | Net Margin (TTM) | Return on Assets (TTM) | Return on Equity (TTM) | Gross Margin (TTM) | EBITDA Margin (TTM) |
|---|---|---|---|---|---|---|
| SHIP | 42.0% | 36.3% | 7.9% | 24.6% | — | — |
| SBLK | 27.9% | 23.9% | 5.4% | 11.7% | — | — |
| GSL | 49.9% | 50.8% | 8.4% | 20.8% | — | — |
| DSX | 18.2% | 27.9% | 2.1% | 11.5% | — | — |
| ESEA | 57.5% | 58.9% | 11.2% | 27.1% | — | — |
| SB | 36.9% | 33.2% | 5.1% | 11.9% | — | — |
Source: Yahoo Finance
SHIP’s 42.0% operating margin and 36.3% net margin are above SBLK’s 27.9% and 23.9%, DSX’s 18.2% and 27.9%, and SB’s 36.9% and 33.2%, while GSL’s 49.9% and 50.8% and ESEA’s 57.5% and 58.9% remain higher. The gap looks more structural than cyclical because SHIP’s margins are strong without needing the scale of SBLK or the ultra-high profitability of ESEA, which suggests a better cost structure than most dry bulk peers even if it is not the most profitable operator in the group. ROE of 24.6% and ROA of 7.9% also sit above most of the peer set, but the spread tells me leverage is doing part of the work.
Valuation
SHIP — Valuation Multiples
| Metric | Value |
|---|---|
| Current Share Price (USD) | 14.5 |
| Market Cap (USD Mil) | 321 |
| Enterprise Value (USD Mil) | 557 |
| Trailing P/E | 5.1 |
| Forward P/E | 4.8 |
| Price/Sales (TTM) | 1.6 |
| Price/Book (mrq) | 1 |
| EV/Revenue | 2.9 |
| EV/EBITDA | 7 |
| Beta (5Y Monthly) | 1.23 |
| FCF Yield % (TTM) | — |
| Forward EPS (USD) | 3.4 |
| Analyst Target Price – Low (USD) | 18 |
| Analyst Target Price – Mean (USD) | 26 |
| Analyst Target Price – High (USD) | 37 |
| # Analyst Opinions | 4 |
Source: Yahoo Finance
Seanergy Maritime trades at 2.9x EV/Revenue and 1.6x Price/Sales on a current share price of $14.5, so the market is paying about 2.9 times enterprise value for each dollar of trailing sales. With trailing P/E at 5.1x and forward P/E at 4.8x, the stock is also priced as if earnings stay strong rather than mean-revert, which is consistent with the 3.4 forward EPS and the 60.9% 52-week gain. The 7.0x EV/EBITDA multiple is the cleanest earnings anchor here, and it implies investors are underwriting a still-healthy cash-earning fleet rather than a cyclical trough. Price/Book is 1.0x against book value per share of $15.7, so the stock sits just above stated equity value, which leaves little book-value cushion if vessel values soften. FCF Yield is not supplied, so cash generation is better read through the 7.8% trailing dividend yield and 20.2% payout ratio, which suggest the dividend is covered but not by a wide margin. Beta is 1.23, so the shares should remain more volatile than the market. On the analysis here, I would put fair value in a range of $9-$23 per share, which is below the $26 analyst mean target and inside the $18-$$37 consensus band; I weight the lower end more heavily because leverage is still high and the equity deserves less credit than the consensus appears to be giving it. I would also frame forward EPS in a $3.1-$3.6 range, which brackets the $3.4 consensus and looks reasonable against peers, but the quality of that earnings power is less attractive than the raw number suggests because the return profile is still leverage aided rather than balance-sheet clean. The valuation picture is not cheap enough for me to look through the debt load, and that is why I stay strongly negative despite the low headline multiples.
Valuation versus peers
| Company | Current Share Price (USD) | Trailing P/E | Forward P/E | EV/Revenue | EV/EBITDA | Price/Sales (TTM) | Price/Book (mrq) | Market Cap (USD Mil) | Enterprise Value (USD Mil) | Beta (5Y Monthly) | FCF Yield % (TTM) | Forward EPS | Analyst Target Price – Low | Analyst Target Price – Mean | Analyst Target Price – High | # Analyst Opinions |
|---|---|---|---|---|---|---|---|---|---|---|---|---|---|---|---|---|
| SHIP | 14.5 | 5.1 | 4.8 | 2.9 | 7 | 1.6 | 1 | 321 | 557 | 1.23 | — | 3.4 | 18 | 26 | 37 | 4 |
| SBLK | 26.2 | 10.7 | 6.6 | 3.2 | 7.6 | 2.5 | 1.3 | 3,093 | 3,773 | 0.86 | — | 3.9 | 33 | 34.4 | 38 | 5 |
| GSL | 40.5 | 4 | — | 2.1 | 3 | 2 | 0.7 | 1,507 | 1,646 | 1 | — | 9.6 | 50 | 51 | 52 | 3 |
| DSX | 2.2 | 4.6 | — | 2.7 | 6.7 | 1.2 | 0.5 | 281 | 575 | 0.62 | — | 0.6 | 3.8 | 3.8 | 3.8 | 1 |
| ESEA | 59.4 | 3.2 | 3.6 | 2 | 2.6 | 1.9 | 0.8 | 425 | 435 | — | — | 17.7 | 85 | 92 | 96 | 4 |
| SB | 7.7 | 8.1 | — | 3.5 | 6 | 2.5 | 0.9 | 888 | 1,138 | 1.07 | — | 0.8 | 9.7 | 10.1 | 10.4 | 2 |
Source: Yahoo Finance
SHIP trades at 2.9x EV/Revenue, 5.1x trailing P/E, and 1.6x P/S, versus SBLK at 3.2x, 10.7x, and 2.5x, SB at 3.5x, 8.1x, and 2.5x, GSL at 2.1x, 4.0x, and 2.0x, DSX at 2.7x, 4.6x, and 1.2x, and ESEA at 2.0x, 3.2x, and 1.9x. On those numbers SHIP is not the cheapest, but it is priced below SBLK and SB despite stronger growth than GSL, DSX, and ESEA; using SHIP’s $204.7M revenue and the peer EV/Revenue range of 2.0x to 3.5x gives an illustrative enterprise value of $407.3M to $724.6M, or about $9.0 to $23.4 per share after netting SHIP’s $409.7M debt and $167.9M cash and dividing by 21.7M shares. I feel the market is already giving SHIP credit for a recovery that still needs to show up in earnings, especially with only 4 analyst opinions and a mean target of $26 versus the current $14.5. The valuation gap is not wide enough to compensate for the leverage gap, which is why the stock screens as optically cheap but not obviously mispriced.
Leverage
SHIP — Leverage & Coverage (Quarterly)
| Metric | Value |
|---|---|
| Total Debt/Equity % (mrq) | 123 |
| Current Ratio (mrq) | — |
| Total Debt (mrq, USD Mil) | 409.7 |
| Operating Cash Flow (TTM, USD Mil) | 109 |
| Levered Free Cash Flow (TTM, USD Mil) | — |
| Net Debt/EBITDA (TTM) | — |
| FCF Margin % (TTM) | — |
Source: Yahoo Finance — Quarterly Financial Statements
Total debt was $409.7M and total debt to equity was 123.0%, so leverage is meaningful relative to the equity base. Operating cash flow was $109M, which shows the fleet is still generating cash, but the absence of a reported free cash flow figure means I would not assume much residual cushion after capex and financing costs. Total cash was $167.9M, or $7.93 per share, which gives some near-term liquidity support. In my view, this is medium to high refinancing risk because debt is sizable, cash generation is positive but not clearly abundant, and the balance sheet would become more sensitive if charter rates soften or if a refinancing lands at materially higher coupons. The leverage profile is the main reason I am not willing to give the stock the benefit of the doubt.
Leverage versus peers
| Company | Total Debt/Equity % (mrq) | Current Ratio (mrq) | Total Debt (mrq, USD Mil) | Operating Cash Flow TTM (USD Mil) | Free Cash Flow TTM (USD Mil) | Net Debt/EBITDA (TTM) | FCF Margin % (TTM) |
|---|---|---|---|---|---|---|---|
| SHIP | 123 | — | 409.7 | 109 | — | — | — |
| SBLK | 46.9 | 1.9 | 1,179 | 455.2 | 169.8 | — | — |
| GSL | 31.3 | 1.6 | 633.7 | 520.6 | 56.8 | — | — |
| DSX | 109.9 | 2 | 606.2 | — | — | — | — |
| ESEA | 37.3 | 4 | 202.1 | 149.7 | 90.8 | — | — |
| SB | 56.6 | 1.6 | 559.2 | 169.4 | 37.2 | — | — |
Source: Yahoo Finance
SHIP’s debt to equity is 123.0%, above SBLK’s 46.9%, GSL’s 31.3%, ESEA’s 37.3%, SB’s 56.6%, and DSX’s 109.9%, so the balance sheet is clearly more stretched than the better-capitalized peers. Yet SHIP also has $7.9 of cash per share versus SBLK’s $4.5, DSX’s $1.8, and SB’s $2.7, which softens the raw debt figure and makes the leverage look more like a financing choice than an immediate distress signal; the absence of FCF data for SHIP keeps the comparison from being cleaner, but the debt load still deserves a valuation discount. That is the key cross-check in the peer set: SHIP’s stronger margins do not erase the fact that it carries more leverage than most of the group, so the market should not pay it a premium multiple on profitability alone.
Insider Activity
| Date | Insider | Role | Type | Shares | Price |
|---|---|---|---|---|---|
| 2026-04-06 | Gyftakis Stavros | See Remarks | S | 3,570 | $13.95 |
The insider transaction record I see here is limited to one filing over a single day, and it shows one open-market sale with no open-market purchases. In my view, that makes the pattern concentrated rather than broad, but it is still only one transaction, so the sample is thin and should not be overread. The insider transaction pattern is a neutral signal, not a thesis driver.
Conclusion
I would put my rating as a strong sell because the recent earnings improvement is real, but the equity still depends too heavily on freight rates staying firm. Revenue rose to $55.7M in Q2 2026 and EBITDA climbed to $30.5M, which tells me the fleet is generating strong operating leverage right now. The problem is that $409.7M of debt against $321.1M of equity leaves very little room for a dry bulk downturn, and that leverage is the first thing I would expect to bite if Capesize rates soften.
I would move toward a less bearish view if quarterly revenue stays above $50M for another two quarters and EBITDA holds above $30M, because that would show the current run rate is not a one-quarter spike. At that level, annualized EBITDA would be roughly $120M, which would make the current 7.0x EV/EBITDA look easier to justify and would give the company more room to absorb refinancing costs without leaning so hard on vessel values. I would also want to see debt begin to fall before I change my view, because the balance sheet is still the main source of downside.
I would keep the strong sell, and expect the downside to be larger, if quarterly revenue falls back below $40M or EBITDA slips under $15M, because that would tell me the recent margin expansion was mostly rate timing rather than a durable step up in cash generation. With $409.7M of debt already on the balance sheet, a drop of that size would quickly tighten coverage and make the current equity value much more sensitive to any further weakness in Capesize rates.
Weighing both paths, I think the bull case could show up first, but not by enough to justify owning the shares after the recent move. The company has enough operating leverage to keep surprising on the upside if freight rates stay firm, yet the leverage and cyclicality are still high enough that I want proof of sustained earnings before moving off strong sell.
What to Watch Next
- Quarterly revenue above $50M — would support a less bearish view.
- EBITDA above $30M — would confirm the current run rate is holding.
- Debt beginning to fall from $409.7M — would improve the equity cushion.
- Capesize rates staying firm — would keep the earnings leverage intact.
- Revenue below $40M or EBITDA below $15M — would reinforce the strong sell case.
What’s your take? I rated Seanergy Maritime (SHIP) STRONG SELL above — but the goal here is to get this right, not just to publish an opinion. What would you add to this analysis, or which risk or catalyst do you think I’m under- or over-weighting? Tell me in the comments.
Our track record: every directional call is tracked publicly on The Scorecard, and Stocks Covered lists every company we have rated and when.
Sources
Data sourced from Yahoo Finance and SEC EDGAR. Not investment advice.
Get daily options strategies built on our research
Sign up and get access to our private Discord and Telegram options channels, updated daily. Every play is built on our equity research and the rating we give the company.
Educational content only, not investment advice. Hypothetical results, not a guarantee of future performance.
Our options track record so far: +33% in 4 weeks, hypothetical and unrealised. See the track record.
Leave a Comment