Expected price range
Each range is set from the stock’s recent price history and our Strong Sell rating, using its own 1-year realised volatility (68% annualised) as the width of a ~68% statistical band, and checked against that rating so the range leans the same way as our view. Starting price $37.78 (close 2026-11-12). The stock traded between $33.74 and $72.24 over the last 6 months and between $33.74 and $72.65 over the last year. This is an illustration of where our view and normal volatility point, not a forecast, price target or investment advice; the stock can move outside it.
| Company | Nov 25 | Dec 25 | Jan 26 | Feb 26 | Mar 26 | Apr 26 | May 26 | Jun 26 | Jul 26 | Aug 26 | Sep 26 | Oct 26 | 12-Mo |
|---|---|---|---|---|---|---|---|---|---|---|---|---|---|
| MP | -2% | -18% | +16% | +0% | -18% | +37% | -2% | -13% | -26% | +32% | -14% | -16% | -37% |
| ALB | +32% | +9% | +21% | +5% | +1% | +10% | -10% | -23% | -13% | +15% | -21% | -14% | -6% |
| FCX | +3% | +18% | +19% | +13% | -14% | -1% | +14% | -4% | -0% | +21% | -8% | -11% | +51% |
| NEM | +12% | +10% | +13% | +16% | -17% | +3% | -1% | -15% | +0% | +35% | -8% | -8% | +33% |
| LAC | +2% | -23% | +12% | +4% | -22% | +45% | -9% | -26% | -25% | +8% | -15% | -23% | -63% |
| SQM | +31% | +7% | +12% | -1% | +6% | +14% | -6% | -14% | -9% | +18% | -16% | -16% | +15% |
Source: Yahoo Finance monthly adjusted close.
Quick Thesis
- Rated Strong Sell — valuation already prices in a profit inflection that the numbers do not yet show.
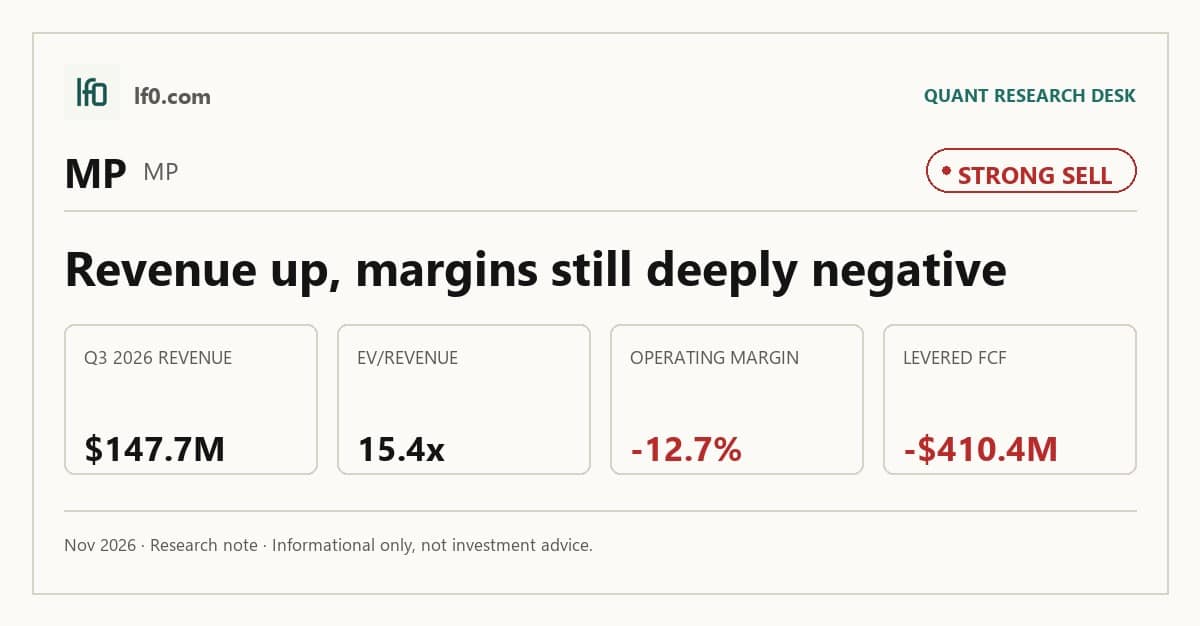
- Strongest point: revenue reached $147.7M in Q3 2026, but margins are still negative.
- Biggest risk: levered free cash flow was -$410.4M TTM, so the buildout still consumes cash.
- Valuation is rich: 15.4x EV/revenue and 35.7x forward P/E versus negative TTM margins.
- I would turn more constructive only if operating margin turns positive and quarterly EBITDA stays above $18.3M.
Executive Summary
Measured from adjusted close on 2026-11-12 to 2026-11-12. Sell ratings are correct when the stock falls; Hold is tracked as a +/-10% range. Daily-close data, not intraday. Calls are tracked for 182 days from publication, then frozen as a final record.
I would put my rating as a Strong Sell because the stock is already discounting a cleaner earnings profile than the current numbers justify. MP Materials has a real strategic asset base, but the latest figures still show negative TTM operating margin of -12.7%, negative net margin of -7.63%, and levered free cash flow of -$410.4M, so the equity is being asked to pay for a future that has not yet shown up in cash generation.
The core strength is the company’s vertically integrated rare earth platform, anchored by Mountain Pass and the downstream magnet buildout. The core risk is that the same buildout is still cash consumptive and execution-heavy, which leaves little room for delay if the ramp slips. I would become more constructive only if operating margin moves into positive territory and quarterly EBITDA holds above $18.3M, because that would show the fixed-cost base is finally being absorbed by volume.
Company Profile
MP Materials Corp. is the largest producer of rare earth materials in the Western Hemisphere. It owns and operates Mountain Pass, a rare earth mine and processing facility in San Bernardino County, California, and the Independence Facility in Fort Worth, Texas, where it makes rare earth metal, alloy, precursor products, and NdFeB permanent magnets.
Revenue comes mainly from NdPr oxide and metal sales to customers in Japan, South Korea, and broader Asia, plus magnet precursor sales to General Motors in the U.S. and, from late 2025, NdFeB magnet production. The company is headquartered in Las Vegas, Nevada, listed on the New York Stock Exchange under MP, and financed with public equity. In July 2025, it entered into public-private partnership agreements with the U.S. Department of War, which support expansion of Independence and a second magnet plant, the 10X Facility, expected to begin commissioning in 2028.
Economic Moat
Business Model
Mountain Pass is the core advantage here because it combines mining, refining, and finishing on one site and gives MP Materials a processing chain that a well-funded competitor would struggle to rebuild quickly. In my view, the moat is not just geology. The site also uses a dry stack tailings process, a closed-loop water system that satisfies about 95% of those needs, and an idle chlor-alkali facility that can be recommissioned for separations inputs, which lowers water, reagent, and logistics intensity.
The downstream buildout at Independence adds a second layer to that edge. MP began manufacturing NdFeB permanent magnets in December 2025, and the DoW-backed 10X Facility is expected to add 7,000 metric tons of annual capacity when it comes on line. That matters because the company is moving from a single upstream asset into a more complete U.S. supply chain, which is harder to replicate than a standalone mine.
Business & Operating Risks
The most material disclosed risk is the DoW transaction structure, because the company now depends on a government counterparty for both funding and offtake while the filing says future support cannot be assured. The Price Protection Agreement sets a $110 per kilogram floor for NdPr, and the company may need to seek alternate financing if appropriated funding is delayed or unavailable. That is a live operating risk, not a theoretical one, because the strategic plan now depends on a contract structure that could be delayed, challenged, or reinterpreted.
Execution risk is the other clear threat. Mountain Pass still has to hit throughput, recoveries, uptime, yields, and product quality targets, while Independence and the 10X Facility must be designed, built, staffed, and commissioned on schedule. The risk is not that the moat disappears; it is that the moat only pays off if the company can keep the ramp on time and on spec. The disclosed risks therefore test the moat’s monetization, not its existence.
Management Discussion & Analysis
Management is clearly responding to those risks by leaning into a capital-intensive, state-backed scale-up rather than balance-sheet repair. The July 2025 DoW package, the $400.0 million Series A preferred issuance, the $150.0 million Samarium Project Loan, and the $1 billion revolving credit facility all point to a plan built around funding the downstream ramp, not shrinking it.
That strategy has already produced some operating progress. The Price Protection Agreement generated $51M of income in 2025, and the Apple prepayment structure added demand visibility, but operating cash flow was still negative and free cash flow remained deeply negative. In my view, management is addressing the buildout risk directly, yet the numbers show the company is still relying on external support to bridge the gap between strategic ambition and self-funding cash generation.
Recent Events
The most important recent development was the July 2025 DoW transaction package, which changed the company’s structure as much as any operating milestone. It tied MP more closely to a domestic magnet supply chain, added funding for the 10X Facility and related projects, and gave the company a policy-backed route to scale that should strengthen the moat if execution holds.
The other notable event was the start of magnet manufacturing in December 2025. That is strategically important because it moves MP further down the value chain and reduces dependence on upstream concentrate sales. I see that as a moat-positive step, but it also raises the execution bar because the company now has to prove it can run a more complex industrial system at commercial scale.
Financial Analysis
LF0 has published standalone analyses of these peers: Newmont Corporation (NEM) (rated Hold).
Growth
MP — Financial Growth (Quarterly, USD Mil)
| Metric | 2025-09-30 | 2025-12-31 | 2026-03-31 | 2026-06-30 | 2026-09-30 |
|---|---|---|---|---|---|
| REVENUE (USD Mil) | 53.6 | 52.7 | 90.6 | 108.5 | 147.7 |
| EBIT (USD Mil) | -49.9 | 20.4 | -3.8 | -19.6 | -17.8 |
| EBITDA (USD Mil) | -27.4 | 45.1 | 28.3 | 15.7 | 18.3 |
| NET INCOME (USD Mil) | -41.8 | 9.4 | -8 | -20.3 | -20.7 |
| DILUTED EPS | -0.2 | 0.1 | 0 | -0.1 | -0.1 |
Source: Yahoo Finance — Quarterly Financial Statements
Revenue rose sharply across the latest reported quarters, reaching $147.7M in Q3 2026 after $108M in Q2 2026 and $90.6M in Q1 2026. EBITDA stayed positive at $18.3M in Q3 2026, but it did not keep pace with sales growth, which tells me the company is scaling revenue faster than it is scaling earnings.
That gap matters because it shows the business is still in the early part of the margin ramp. The top line is moving in the right direction, and the step-up is consistent with the downstream buildout described above, but the current growth profile still needs to convert into a more durable earnings base before I would treat it as self-sustaining.
Growth versus peers
| Company | Revenue TTM (USD Mil) | Revenue Growth YoY % | Diluted EPS TTM |
|---|---|---|---|
| MP | 518.5 | 190.9% | -0.2 |
| ALB | 6,153.2 | 18.8% | 4.2 |
| FCX | 26,442 | 8.2% | 2.4 |
| NEM | 26,606 | 15.2% | 8.6 |
| LAC | — | — | -0.4 |
| SQM | 6,725.4 | 136.7% | 4.9 |
Source: Yahoo Finance
MP’s revenue growth is the standout in the peer set at 190.9% TTM, ahead of SQM at 136.7% and well above ALB at 18.8%, FCX at 8.2%, and NEM at 15.2%. The catch is that MP’s diluted EPS is still -$0.2 TTM, while ALB, FCX, NEM, and SQM are all profitable, so the growth rate is not yet translating into earnings.
Profitability
TTM operating margin was -12.7%, net margin was -7.63%, return on assets was -1.09%, and return on equity was -1.67%. Those figures tell me the company is still below profitability on a GAAP basis and has not yet reached scale economics.
The negative ROE and ROA also show that leverage is not inflating returns. The problem is weak underlying earnings power, not financial engineering. For this thesis to work, operating margin has to move toward positive territory and net margin has to narrow materially, because that would show the cost base is finally being absorbed by volume.
Profitability versus peers
| Company | Operating Margin (TTM) | Net Margin (TTM) | Return on Assets (TTM) | Return on Equity (TTM) |
|---|---|---|---|---|
| MP | -12.7% | -7.6% | -1.1% | -1.7% |
| ALB | 17.1% | 11.1% | 4.0% | 7.0% |
| FCX | 28.6% | 13.0% | 8.0% | 15.7% |
| NEM | 55.6% | 34.7% | 16.4% | 27.3% |
| LAC | 0.0% | 0.0% | -1.7% | -3.7% |
| SQM | 38.7% | 20.6% | 11.6% | 21.8% |
Source: Yahoo Finance
MP’s operating margin is -12.7% and net margin is -7.63%, while ALB posts 17.1% and 11.1%, FCX 28.6% and 13.0%, NEM 55.6% and 34.7%, and SQM 38.7% and 20.6%. The peer group is already generating real returns, so MP’s negative margins point to a cost structure and mix problem rather than a simple scale gap.
Valuation
MP Materials is trading on a growth-and-policy lens, but the current multiples still look expensive against the earnings base it has today. EV/revenue is 15.4x, forward P/E is 35.7x, and price/sales is 16.4x, while the company still posts negative TTM operating and net margins. That combination tells me the market is paying for a much cleaner future than the current income statement supports.
The balance sheet helps, but it does not solve the valuation problem. The company has $1.3B of cash, $983.6M of debt, and a 6.755 current ratio, so liquidity is not the issue; the issue is that free cash flow is still -$410.4M TTM. In my view, that means the equity is being valued on the assumption that the downstream ramp will quickly turn into cash, not just revenue.
On the analysis here, I would put fair value below the current share price, and my range would sit under the $67.5 analyst mean target even though it remains above the $40 low target. I do not think the consensus is thin, with 16 analyst opinions, but I weight the cash burn and margin profile more heavily than the market appears to. Forward EPS is 0.467, and that is still too small relative to the current multiple stack to justify the stock’s premium unless earnings accelerate much faster than the latest run rate implies.
Valuation versus peers
| Company | Current Share Price (USD) | Trailing P/E | Forward P/E | EV/Revenue | EV/EBITDA | Price/Sales (TTM) | Price/Book (mrq) | Market Cap (USD Mil) | Enterprise Value (USD Mil) | Forward EPS | Analyst Target Price – Low | Analyst Target Price – Mean | Analyst Target Price – High | # Analyst Opinions |
|---|---|---|---|---|---|---|---|---|---|---|---|---|---|---|
| MP | 37.3 | — | 35.7 | 15.4 | 57.2 | 16.4 | 3.4 | 6,548 | 6,146 | 0.5 | 40 | 67.5 | 100 | 16 |
| ALB | 93.5 | 23.1 | 9.7 | 2.2 | 10.2 | 2.1 | 1.4 | 11,325 | 13,596 | 8.5 | 83.3 | 139.3 | 211 | 21 |
| FCX | 60.1 | 25.3 | 14.7 | 3.5 | 9.8 | 3.3 | 4.1 | 89,138 | 95,159 | 4.2 | 33 | 78.2 | 90 | 22 |
| NEM | 113.5 | 13.9 | 11.7 | 4.6 | 7.3 | 4.8 | 3.5 | 123,113 | 119,870 | 10.1 | 70 | 135.4 | 165 | 20 |
| LAC | 1.5 | — | — | — | — | — | 0.4 | 604 | 939 | -0.2 | 2.3 | 5.1 | 10 | 9 |
| SQM | 53.7 | 11.3 | 8.7 | 2.5 | 6.2 | 2.3 | 2.5 | 15,636 | 16,500 | 6.7 | 44.4 | 80.4 | 110 | 18 |
Source: Yahoo Finance
MP trades at 15.4x EV/revenue, 35.7x forward P/E, and 16.4x price/sales, versus ALB at 2.2x, 9.7x, and 2.1x, FCX at 3.5x, 14.7x, and 3.3x, NEM at 4.6x, 11.7x, and 4.8x, and SQM at 2.5x, 8.7x, and 2.3x. On a peer-multiple basis, the stock screens rich, and that premium is only defensible if MP’s downstream ramp turns into materially better margins and cash flow than the peer group already has.
Leverage
MP’s total debt to equity is 41.61%, and the current ratio is 6.755, so the balance sheet is not stretched in the near term. Total debt is $983.6M, while total cash is $1.3B and cash per share is $7.5, which means net liquidity is still positive.
That cushion matters because operating cash flow was -$54.61M TTM and levered free cash flow was -$410.4M TTM. The company is still funding growth and ramp costs rather than generating surplus cash, so the leverage story is less about current solvency than about how long the company can keep spending before the buildout starts paying for itself.
Leverage versus peers
| Company | Total Debt/Equity % (mrq) | Current Ratio (mrq) | Total Debt (mrq, USD Mil) | Operating Cash Flow TTM (USD Mil) | Free Cash Flow TTM (USD Mil) |
|---|---|---|---|---|---|
| MP | 41.6 | 6.8 | 983.6 | -54.6 | -410.4 |
| ALB | 18.5 | 2.3 | 1,998.2 | 1,850.5 | 1,250.1 |
| FCX | 30.8 | 2 | 10,356 | 6,217 | 1,867 |
| NEM | 15.6 | 2.5 | 5,584 | 13,098 | 9,154.1 |
| LAC | 59.6 | 5.5 | 1,161 | -35.7 | -1,348.9 |
| SQM | 61.2 | 2.6 | 5,314.4 | 2,768.1 | 2,618.8 |
Source: Yahoo Finance
MP’s debt/equity is 41.61%, which is below SQM’s 61.2% but above ALB’s 18.5% and NEM’s 15.6%. The more important read is the 6.755 current ratio, which is stronger than ALB’s 2.3, FCX’s 2.0, NEM’s 2.5, and SQM’s 2.6, although MP’s -$410.4M of levered free cash flow still means liquidity is being consumed rather than replenished.
Insider Activity
The insider transaction record is decisively net selling: 37 open-market sales versus 1 open-market purchase, with $168.2M of sales against $962,540 of buying over the 2024-12-31 to 2026-06-03 window. The pattern is concentrated rather than broad, because James H. Litinsky accounts for nearly all of the open-market activity, while the only purchase came from Michael Stuart Rosenthal on 2026-05-20.
I read that as a caution flag, not a thesis breaker. High insider ownership at 19.6% is still a governance positive, but the scale and persistence of the selling suggest the people closest to the company have been willing to reduce exposure into strength.
Conclusion
The tension in this name is simple: the strategic platform is better than it was two years ago, but the income statement has not yet earned the valuation the market is assigning. MP has a real moat in Mountain Pass and a more complete domestic supply chain than before, yet the stock still trades at 15.4x EV/revenue and 35.7x forward P/E. The income statement and cash flow are weaker than that valuation implies: TTM operating margin is -12.7% and levered free cash flow is -$410.4M.
I would raise my rating toward Hold if operating margin moves into positive territory and quarterly EBITDA stays above $18.3M, because that would show the downstream ramp is finally absorbing the fixed cost base. I would also want to see operating cash flow turn positive, since that would mean the company is no longer funding the buildout primarily from the balance sheet. If revenue keeps rising but cash flow stays negative, the market will still be paying for a future that has not yet arrived.
The bear case is that revenue growth continues while cash burn persists, which would leave the stock expensive on every relevant metric. If levered free cash flow remains near -$410.4M TTM and the company keeps leaning on outside capital to fund the ramp, I would move from Strong Sell to an even more cautious stance only if the buildout slips enough that liquidity starts to tighten faster than revenue expands. For now, I think the market is ahead of the fundamentals, and I would wait for the margin and cash-flow proof before getting more constructive.
What to Watch Next
- Operating margin turning positive — would show the cost base is finally being absorbed.
- Quarterly EBITDA staying above $18.3M — would support a move toward Hold.
- Operating cash flow turning positive — would confirm the ramp is becoming self-funding.
- Levered free cash flow improving from -$410.4M — would reduce financing pressure.
- Revenue growth continuing without margin slippage — would strengthen the downstream thesis.
What’s your take? I rated MP Materials (MP) STRONG SELL above — but the goal here is to get this right, not just to publish an opinion. What would you add to this analysis, or which risk or catalyst do you think I’m under- or over-weighting? Tell me in the comments.
Our track record: every directional call is tracked publicly on The Scorecard, and Stocks Covered lists every company we have rated and when.
Sources
- SEC 10-K Annual Report — filed 2026-02-26
- SEC 8-K Filing (2026-05-07)
- SEC 8-K Filing (2026-02-26)
- SEC Form 4 Insider Transaction (2026-06-05)
- SEC Form 4 Insider Transaction (2026-05-29)
- SEC Form 4 Insider Transaction (2026-05-20)
- SEC 10-K Annual Report — FY2026
- SEC 10-K Annual Report — FY2025
- SEC 10-K Annual Report — FY2024
- SEC 10-K Annual Report — FY2023
- SEC 10-K Annual Report — FY2022
Data sourced from Yahoo Finance and SEC EDGAR. Not investment advice.
Leave a Comment