| Company | Jul 25 | Aug 25 | Sep 25 | Oct 25 | Nov 25 | Dec 25 | Jan 26 | Feb 26 | Mar 26 | Apr 26 | May 26 | Jun 26 | 12-Mo |
|---|---|---|---|---|---|---|---|---|---|---|---|---|---|
| NEM | +7% | +20% | +14% | -4% | +12% | +10% | +13% | +16% | -17% | +3% | -1% | -15% | +62% |
| AU | +1% | +24% | +24% | -3% | +27% | -0% | +9% | +38% | -23% | -4% | +5% | -16% | +87% |
| GFI | +3% | +37% | +25% | -8% | +12% | +2% | +15% | +17% | -21% | -6% | -6% | -16% | +46% |
| HMY | -4% | -1% | +37% | -9% | +19% | +1% | +7% | +7% | -32% | +5% | +16% | -17% | +11% |
| AEM | +5% | +16% | +17% | -5% | +8% | -3% | +12% | +32% | -19% | -7% | -3% | -15% | +32% |
Source: Yahoo Finance monthly adjusted close.
Executive Summary
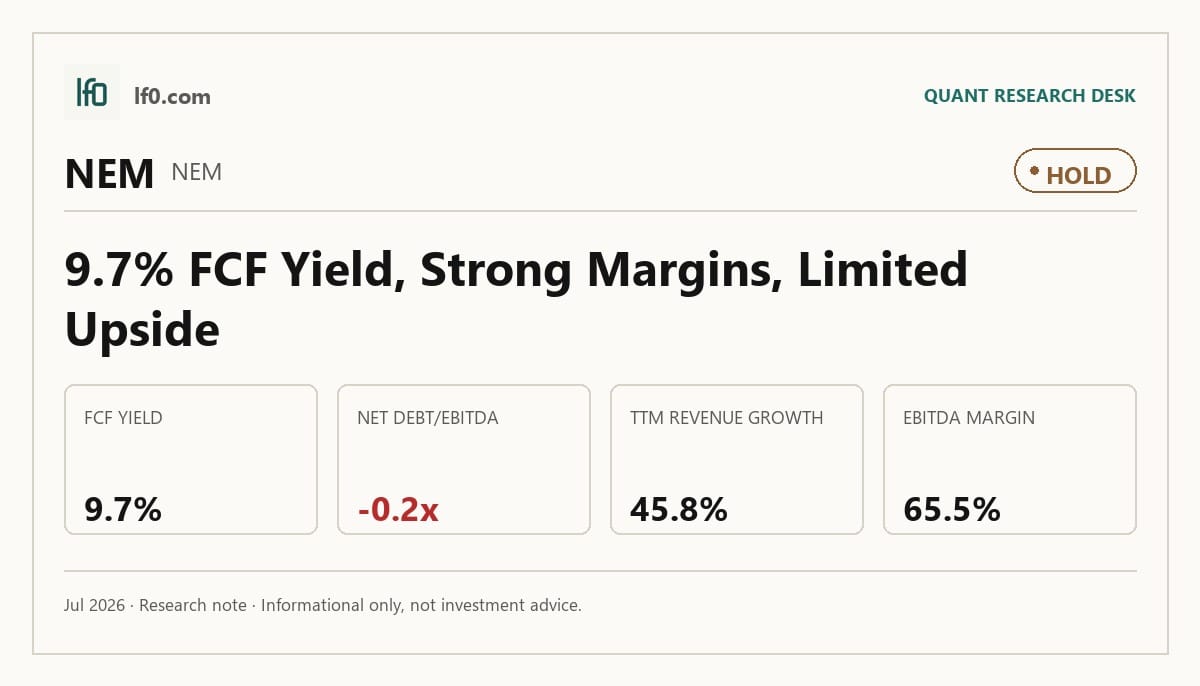
Rating: HOLD | NEM
Measured from adjusted close on 2026-07-15 to 2026-10-22. Sell ratings are correct when the stock falls; Hold is tracked as a +/-10% range. Daily-close data, not intraday. Calls are tracked for 182 days from publication, then frozen as a final record.
I would put my rating as a Hold because Newmont is already discounting a very strong gold price environment, and the current earnings base is unusually sensitive to bullion staying elevated. TTM free cash flow yield is 9.7% and net debt/EBITDA is -0.2x, so the balance sheet is not the problem; the issue is that the stock has already absorbed a lot of the good news from higher gold prices, portfolio simplification, and strong cash conversion. I feel the market is giving credit for a durable cash engine, but the share price leaves less room for disappointment if gold normalizes. I would raise my rating more towards a Buy if gold stays near or above the 2025 average of $3,432/oz, because that would keep the current margin structure intact and support continued buybacks.
Company Profile
Newmont Corporation was incorporated in 1921 and is a gold producer with copper, silver, lead, and zinc output. It sells most gold as refined bullion after dor bars are sent to refiners, and it also sells copper, silver, lead, and zinc concentrates to smelters. The company completed the Newcrest Mining Limited acquisition on November 6, 2023, then sold Telfer in Q4 2024, CC&V, Musselwhite, and Éléonore in Q1 2025, Porcupine and Akyem in Q2 2025, and the Coffee project in Q4 2025. Ahafo North in Ghana began commercial production in October 2025. Newmont is headquartered in Denver, Colorado, and operates in the United States, Papua New Guinea, Australia, Ghana, Suriname, Argentina, the Dominican Republic, Chile, Peru, Ecuador, Mexico, and Canada. It is listed on the NYSE under NEM, with CDIs on the ASX and PDIs on the PNGX.
Economic Moat
Business Model
The reserve base and mine portfolio are the hard-to-replicate assets here. Newmont ended 2025 with attributable proven and probable gold reserves of 118.2 million ounces, attributable measured and indicated gold resources of 88.1 million ounces, attributable inferred gold resources of 60.6 million ounces, and an aggregate land position of approximately 19,200 square miles. I feel that a well-funded competitor cannot rebuild that reserve and jurisdiction mix within 3 years because the value rests on long-life ore bodies, permitting, and land tenure rather than on a single plant or brand. The operating footprint adds another layer of resilience: 13 reportable segments at December 31, 2025, including 12 mining operations plus a 38.5% interest in Nevada Gold Mines, which gives Newmont diversification across assets and jurisdictions.
Business & Operating Risks
The most material risk is metal price exposure, because Newmont is still unhedged on gold, copper, silver, lead and zinc and the filing says a substantial or extended decline would hurt revenues, net income, and operating cash flows. Permitting, land tenure, and community opposition are the next major headwinds: Boddington’s existing tailings facility is expected to reach permitted capacity in 2026, Cadia is seeking approval to extend operations beyond 2031, and the company still faces the possibility that key permits or approvals may be revoked or suspended. Operational disruption from geotechnical, water, energy, and climate events is also a real earnings risk, with the filing pointing to pit wall failures, tailings failures, water shortages, and severe weather. Jurisdictional and fiscal risk is another important drag, especially in Peru, Ghana, Mexico, PNG, and Argentina, where tax and water rules can change after capital is already committed.
Taken together, these risks do not break the moat, but they do pressure the economics of the portfolio that supports it. The bigger threat is not that the reserve base is easy to copy; it is that permitting, fiscal changes, and commodity swings can slow the conversion of that reserve base into cash.
Management Discussion & Analysis
Management is responding to those risks with a more disciplined capital-allocation framework, but the response is only partial because the company still depends on a high gold price deck. In February 2026 the Board declared a $0.26 per share dividend under an updated framework tied to cycle resilience and a resilient balance sheet, and the company also completed a $2 billion debt tender in 2025 and redeemed the 2026 Senior Notes. At the same time, Newmont authorized a $3 billion share repurchase program in July 2025, while still funding Tanami Expansion 2 and Cadia Panel Caves, so management is balancing shareholder returns with long-dated development spend rather than choosing one over the other. That mix tells me the company is trying to protect the moat by keeping the portfolio focused and the balance sheet flexible, but the current cash generation still depends heavily on commodity pricing.
Recent Events
The most significant recent development is the leadership change disclosed on April 24, 2026: Executive Vice President and Chief Technical Officer Francois Hardy will retire on June 30, 2026, and Erin Workman will serve as acting Chief Technical Officer starting in May 2026. That weakens near-term continuity in the technical bench, although the handoff looks orderly because Workman has held exploration and portfolio roles since 2021. The April 23, 2026 earnings release and the February 19, 2026 full-year filing were routine disclosures, so they did not change the structural thesis. The May 12, 2026 annual meeting was broadly supportive of governance continuity because all proposals passed, including director elections, say-on-pay, and auditor ratification.
Financial Analysis
Growth
NEM — Financial Growth (Quarterly, USD Mil)
| Metric | 2025-03-31 | 2025-06-30 | 2025-09-30 | 2025-12-31 | 2026-03-31 |
|---|---|---|---|---|---|
| REVENUE (USD Mil) | 5,010 | 5,317 | 5,524 | 6,818 | 7,307 |
| EBIT (USD Mil) | 2,550 | 3,183 | 2,559 | 3,279 | 4,622 |
| EBITDA (USD Mil) | 3,143 | 3,803 | 3,202 | 3,944 | 5,254 |
| NET INCOME (USD Mil) | 1,891 | 2,061 | 1,832 | 1,301 | 3,262 |
| DILUTED EPS | 1.7 | 1.9 | 1.7 | 1.2 | 3 |
Source: Yahoo Finance — Quarterly Financial Statements
Revenue rose from $5B in Q1 2025 to $7.3B in Q1 2026, a 45.9% increase, while EBITDA climbed to $5.3B from $3.1B a year earlier. Net income also improved to $3.3B from $1.9B, which tells me the business is not just growing top line but also converting that growth into earnings. The step-up in Q1 2026 is important because it shows the streamlined portfolio and stronger gold price environment are feeding through to the income statement at the same time.
Profitability
NEM — Profitability (TTM)
| Metric | TTM |
|---|---|
| Operating Margin (TTM) | 61.4% |
| Net Margin (TTM) | 33.9% |
| Return on Assets (TTM) | 14.9% |
| Return on Equity (TTM) | 25.8% |
| Gross Margin (TTM) | 67.4% |
| EBITDA Margin (TTM) | 65.5% |
Source: Yahoo Finance — Trailing Twelve Months (TTM)
TTM gross margin of 67.4% and EBITDA margin of 65.5% show that Newmont is still converting a large share of revenue into pre-depreciation earnings, which is what matters most in a capital-intensive miner. Operating margin is 61.4%, so depreciation and amortisation are present but not overwhelming the core mining economics, and net margin of 33.9% shows that a meaningful share of operating profit still reaches the bottom line. ROA of 14.9% and ROE of 25.8% point to solid capital efficiency, with the ROE-to-ROA gap reflecting leverage rather than a weak asset base. That margin profile is consistent with the moat discussion above: the reserve base is not just large, it is producing cash at a high rate.
Valuation
NEM — Valuation Multiples
| Metric | Value |
|---|---|
| Market Cap (USD Mil) | 101,225 |
| Enterprise Value (USD Mil) | 98,076 |
| Trailing P/E | 12.3 |
| Forward P/E | 8.8 |
| Price/Sales (TTM) | 4.1 |
| Price/Book (mrq) | 2.9 |
| EV/Revenue | 3.9 |
| EV/EBITDA | 6 |
| Beta (5Y Monthly) | 0.48 |
| FCF Yield % (TTM) | 9.7% |
| Forward EPS (USD) | 10.8 |
| Analyst Target Price – Low (USD) | 67 |
| Analyst Target Price – Mean (USD) | 135.8 |
| Analyst Target Price – High (USD) | 175 |
| # Analyst Opinions | 21 |
Source: Yahoo Finance
Newmont’s valuation anchor is EV/Revenue at 3.93x, with EV/EBITDA at 6.0x, trailing P/E at 12.3x, and forward P/E at 8.81x. At a market cap of $101.2B and enterprise value of $98.1B, the stock is pricing in a gold producer that can keep turning a 65.5% EBITDA margin and 39.3% FCF margin into durable cash flow. FCF yield of 9.7% is the cleanest value signal here, and it says investors are getting a high cash return even before any rerating. On the analysis here, I would put fair value in a range of roughly $83-$163 per share, which is broadly consistent with the peer EV/revenue range already discussed and with the company’s own leverage and cash-generation profile. That range sits inside the analyst target band of $67–$175, with a mean of $135.8 across 21 opinions, so my view is not far from consensus even though I weight cash conversion and balance-sheet strength more heavily than the average target appears to. Forward EPS of $10.8 also looks reasonable versus peers, but Newmont is not cheap enough to call a clear bargain on earnings alone.
Leverage
NEM — Leverage & Coverage (Quarterly)
| Metric | Value |
|---|---|
| Total Debt/Equity % (mrq) | 15.8 |
| Current Ratio (mrq) | 2.4 |
| Total Debt (mrq, USD Mil) | 5,532 |
| Operating Cash Flow (TTM, USD Mil) | 12,088 |
| Levered Free Cash Flow (TTM, USD Mil) | 9,804.9 |
| Net Debt/EBITDA (TTM) | -0.2 |
| FCF Margin % (TTM) | 39.3% |
Source: Yahoo Finance — Quarterly Financial Statements
Newmont’s leverage is modest for a miner: total debt/equity is 15.8%, current ratio is 2.4x, and total debt is $5.5B. Liquidity is supported by $8.8B of cash, so net debt is negative and refinancing pressure is limited in the near term. TTM operating cash flow is $12.1B and levered free cash flow is $9.8B, which means cash generation comfortably covers debt service and leaves room for dividends, capex, and buybacks. Net debt/EBITDA is -0.2x and FCF margin is 39.3%, a combination that shows EBITDA is converting into cash efficiently rather than being absorbed by working capital or heavy interest costs. The leverage profile matters because it gives management room to absorb commodity volatility without forcing a cut to the capital return framework.
Insider Activity
The insider transaction record I see here is one-sided: 29 open-market sales and 0 open-market purchases over 2025-01-10 to 2026-06-01, so insiders are net sellers. The activity is also broad rather than isolated, with the CEO, CFO, and multiple operating leaders selling, which points to weak alignment with outside shareholders at the margin.
Comparable Analysis
Growth
| Company | Revenue TTM (USD Mil) | Revenue Growth YoY % | Diluted EPS TTM |
|---|---|---|---|
| NEM | 24,966 | 45.8% | 7.7 |
| AU | 11,166 | 64.9% | 6.8 |
| GFI | 8,751.3 | 71.4% | 3.9 |
| HMY | 81,155 | 19.5% | 1.6 |
| AEM | 13,539.2 | 66.1% | 10.6 |
Source: Yahoo Finance
Growth is strongest at AU and GFI, not NEM: AU revenue grew 64.9% TTM and GFI 71.4% TTM, versus NEM at 45.8% TTM, while AEM was 66.1% TTM and HMY only 19.5% TTM. NEM’s growth is still well above HMY, but the discount to AU, GFI, and AEM is justified because NEM is not the fastest grower in the group.
Valuation
| Company | Trailing P/E | Forward P/E | EV/Revenue | EV/EBITDA | Price/Sales (TTM) | Price/Book (mrq) | Market Cap (USD Mil) | Enterprise Value (USD Mil) | FCF Yield % (TTM) | Forward EPS | Analyst Target Price – Low | Analyst Target Price – Mean | Analyst Target Price – High |
|---|---|---|---|---|---|---|---|---|---|---|---|---|---|
| NEM | 12.3 | 8.8 | 3.9 | 6 | 4.1 | 2.9 | 101,225 | 98,076 | 9.7% | 10.8 | 67 | 135.8 | 175 |
| AU | 11.5 | 7.4 | 3.7 | 6.3 | 3.6 | 4.7 | 39,702 | 41,596 | 9.0% | 10.6 | 75 | 118 | 155 |
| GFI | 8.3 | 5.9 | 7 | 11.9 | 3.3 | 6.9 | 29,167 | 61,304 | 8.7% | 5.6 | 40 | 54.2 | 75 |
| HMY | 9.7 | 4.5 | 0.2 | 0.5 | 0.1 | 3 | 9,506 | 15,788 | 159.2% | 3.3 | 16.7 | 21.9 | 27 |
| AEM | 13.4 | 10.6 | 5.1 | 7.3 | 5.2 | 2.7 | 71,040 | 69,407 | 6.0% | 13.4 | 87 | 233.9 | 310 |
Source: Yahoo Finance
NEM’s FCF yield is 9.7% TTM, ahead of AU at 9.0%, GFI at 8.7%, and AEM at 6.0%, while HMY’s 159.2% is an outlier driven by its tiny market cap and should not anchor the comparison. NEM also trades at 8.8x forward P/E and 3.9x EV/revenue, versus AU at 7.4x and 3.7x, GFI at 5.9x and 7.0x, and AEM at 10.6x and 5.1x; on forward EPS, NEM at $10.8 sits just above AU at $10.6 and below AEM at $13.4. That spread tells me the market is paying a mid-pack multiple for a mid-pack earnings base, and it is not charging a growth premium for NEM despite the stronger cash conversion. Using peer EV/revenue of 3.7x to 7.0x on NEM’s revenue implies enterprise value of roughly $93.2B to $174.8B, or about $82.8 to $163.0 per share after netting debt and cash, so the current price sits inside the peer-derived range rather than at a clear discount.
Profitability
| Company | Operating Margin (TTM) | Net Margin (TTM) | Return on Assets (TTM) | Return on Equity (TTM) | Gross Margin (TTM) | EBITDA Margin (TTM) |
|---|---|---|---|---|---|---|
| NEM | 61.4% | 33.9% | 14.9% | 25.8% | 67.4% | 65.5% |
| AU | 56.1% | 31.1% | 22.8% | 43.0% | 53.5% | 58.7% |
| GFI | 51.8% | 40.8% | 21.4% | 51.9% | 55.3% | 59.1% |
| HMY | 33.3% | 20.1% | 17.3% | 33.5% | 43.5% | 38.0% |
| AEM | 62.8% | 39.5% | 15.5% | 22.3% | 73.9% | 70.5% |
Source: Yahoo Finance
Profitability is one of NEM’s clearest strengths: its 67.4% gross margin, 65.5% EBITDA margin, 61.4% operating margin, and 33.9% net margin all beat AU’s 53.5%, 58.7%, 56.1%, and 31.1%, and also top GFI’s 55.3%, 59.1%, 51.8%, and 40.8% on gross and operating margin even though GFI’s net margin is higher at 40.8%. The pattern looks more like a scale and cost-of-revenue advantage than a pure overhead advantage, because NEM’s gross margin lead is as visible as its operating margin lead.
Leverage
| Company | Total Debt/Equity % (mrq) | Current Ratio (mrq) | Total Debt (mrq, USD Mil) | Net Debt/EBITDA (TTM) | FCF Margin % (TTM) |
|---|---|---|---|---|---|
| NEM | 15.8 | 2.4 | 5,532 | -0.2 | 39.3% |
| AU | 22 | 2.7 | 2,286 | -0.1 | 31.9% |
| GFI | 37.1 | 1.8 | 3,221.2 | 0.3 | 29.1% |
| HMY | 25.5 | 0.5 | 13,296 | 0.2 | 18.6% |
| AEM | 1.2 | 3.1 | 319.2 | -0.3 | 31.6% |
Source: Yahoo Finance
Leverage is conservative enough to support the equity case: NEM’s debt/equity is 15.8% and net debt/EBITDA is -0.2x, versus AU at 22.0% and -0.1x, GFI at 37.1% and 0.3x, and AEM at 1.2% and -0.3x. NEM’s 39.3% FCF margin is also ahead of AU at 31.9%, GFI at 29.1%, and AEM at 31.6%, so the balance sheet is not just low risk, it is actively funding cash returns rather than absorbing them.
Conclusion
I would put my rating as a Hold because the stock already reflects a very strong gold environment, while the current cash flow base still depends on a gold price of $3,432/oz in 2025 that is far above $2,386/oz in 2024 and $1,941/oz in 2023. The key tension is that Newmont’s reserve base, margins, and balance sheet are strong enough to support the equity, but the valuation already assumes those strengths persist without much interruption.
I would raise my rating more towards a Buy if gold stays near or above $3,432/oz, because that would keep the current earnings base intact and let Newmont keep converting revenue into cash at a 39.3% free cash flow margin. If that margin held and levered free cash flow stayed near $9.8B, the company would have room for more buybacks and a higher multiple, especially as the market continues to reward the cleaner portfolio after the Newcrest acquisition and the 2024 to 2025 divestitures.
I would move from Hold to Sell if gold falls back toward $2,386/oz, because that would be a drop of about 30.5%, or $1,046/oz, from the 2025 level and would flow straight into revenue and EBITDA for an unhedged producer. At that price, the current margin structure would be much harder to defend, and the market would likely start discounting lower net income, weaker free cash flow, and a slower pace of capital returns.
Weighing both sides, I think the bear case has the cleaner near-term path because the stock has already had a 62.1% 52-week gain and insiders have been net sellers. I am not bearish enough to sell because the balance sheet and cash generation are still strong, but I do think the market is already giving Newmont credit for a lot of good news, which leaves less room for disappointment.
What’s your take? I rated Newmont Corporation (NEM) HOLD above — but the goal here is to get this right, not just to publish an opinion. What would you add to this analysis, or which risk or catalyst do you think I’m under- or over-weighting? Tell me in the comments.
Sources
- SEC 10-K Annual Report — filed 2026-02-19
- SEC 8-K Filing (2026-05-13)
- SEC 8-K Filing (2026-04-28)
- SEC 8-K Filing (2026-04-23)
- SEC 8-K Filing (2026-02-19)
- SEC Form 4 Insider Transaction (2026-06-03)
- SEC Form 4 Insider Transaction (2026-06-03)
- SEC Form 4 Insider Transaction (2026-05-15)
- SEC 10-K Annual Report — FY2026
- SEC 10-K Annual Report — FY2025
- SEC 10-K Annual Report — FY2024
- SEC 10-K Annual Report — FY2023
- SEC 10-K Annual Report — FY2022
Data sourced from Yahoo Finance and SEC EDGAR. Not investment advice.
Leave a Comment