Executive Summary
Rating: HOLD | KGC
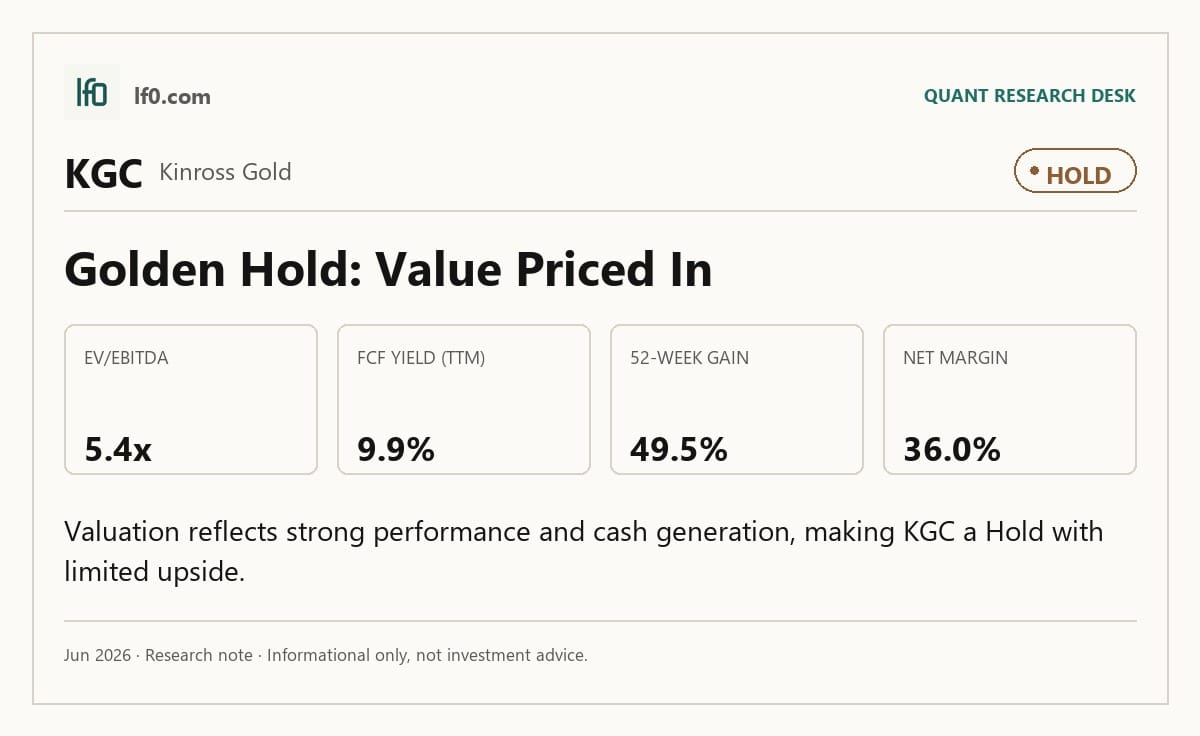
I would put my rating as a Hold because KGC already prices in much of the cash generation and margin strength shown in the latest numbers, so I do not see enough discount to call it a clear Buy. The stock is supported by a 9.9% TTM FCF yield and net cash of about $1.4B after debt, but that support is balanced by a 49.5% 52-week gain and a valuation that already reflects strong execution. I would become more constructive if quarterly EBITDA stays above $1.6B, meaning the current earnings base is holding, and if FCF margin remains near 35.8%, which would show the cash conversion is durable rather than a one-off.
Company Profile
KGC is a gold producer with revenue tied to metal output and realized prices, so its earnings profile is driven by both production scale and commodity pricing. The company’s latest TTM revenue was $8B, with EBITDA of $5B and net income of $2.9B, which tells me this is a large, cash-generative mining platform rather than a small cyclical operator. Its balance sheet and cash flow profile matter because a capital-intensive miner needs enough liquidity to absorb price swings while still funding operations and shareholder returns.
Economic Moat
Business Model
KGC’s edge comes from scale, high margins, and strong cash conversion. TTM gross margin was 68.7%, EBITDA margin was 62.3%, and operating margin was 55.1%, which suggests the company keeps a large share of revenue after direct costs and still converts a lot of that into operating profit. That is consistent with a business that has meaningful operating leverage when gold prices are favorable.
Business & Operating Risks
The main risk is commodity exposure. Because revenue and earnings depend on gold prices, a weaker price environment can hit margins quickly even when the operating base is efficient. I also note that the company’s leverage is low, so the bigger risk is not financial distress but earnings volatility if realized prices or production costs move against it.
Management Discussion & Analysis
Management’s recent results signal that the business is still converting favorable pricing into cash rather than spending aggressively to chase growth. TTM operating cash flow was $4.3B and levered free cash flow was $2.8B, which tells me capital allocation is still disciplined. In my view, that supports the moat because a miner with this level of cash generation can protect the balance sheet and still return capital when conditions are favorable.
Recent Earnings
Revenue rose to $2.4B in Q1 2026 from $1.5B in Q1 2025, while EBITDA increased to $1.6B from $837.2M and net income to $843M from $368M. I read that as more than simple top-line growth: margins are expanding with revenue, which means the company is getting operating leverage from the current price environment. The sequential move from $2B in Q4 2025 to $2.4B in Q1 2026 also shows the business is still building momentum, not just lapping an easy comparison.
Financial Analysis
Growth
KGC — Financial Growth (Quarterly, USD Mil)
| Metric | 2024-09-30 | 2025-03-31 | 2025-06-30 | 2025-09-30 | 2025-12-31 | 2026-03-31 |
|---|---|---|---|---|---|---|
| REVENUE (USD Mil) | — | 1,497.5 | 1,728.5 | 1,802.1 | 2,023 | 2,407.7 |
| EBIT (USD Mil) | — | 548.8 | 749.7 | 859.5 | 1,118.5 | 1,328.4 |
| EBITDA (USD Mil) | — | 837.2 | 1,012.6 | 1,144.9 | 1,386.8 | 1,604.1 |
| NET INCOME (USD Mil) | — | 368 | 530.7 | 584.9 | 906.5 | 843 |
| DILUTED EPS | 0.3 | 0.3 | 0.4 | 0.5 | — | 0.7 |
Source: Yahoo Finance — Quarterly Financial Statements
Revenue grew 60.8% year over year to $2.4B in Q1 2026, and EBITDA rose even faster to $1.6B. That spread matters because it shows the growth is translating into better unit economics, not just more volume. Net income of $843M was below Q4 2025’s $906.5M, so I would not call the quarter perfectly linear, but the broader trend still points to strong operating leverage.
Profitability
KGC — Profitability (TTM)
| Metric | TTM |
|---|---|
| Operating Margin (TTM) | 55.1% |
| Net Margin (TTM) | 36.0% |
| Return on Assets (TTM) | 20.3% |
| Return on Equity (TTM) | 35.5% |
| Gross Margin (TTM) | 68.7% |
| EBITDA Margin (TTM) | 62.3% |
Source: Yahoo Finance — Trailing Twelve Months (TTM)
TTM operating margin of 55.1%, gross margin of 68.7%, and EBITDA margin of 62.3% put KGC near the top of the peer set. ROA of 20.3% and ROE of 35.5% confirm that the company is turning those margins into attractive returns on capital, which is exactly what I want to see from a miner with a strong cash profile. The margin structure also supports the moat view above: this is a business with enough spread between gross profit and operating profit to absorb normal cost pressure.
Valuation
KGC — Valuation Multiples
| Metric | Value |
|---|---|
| Market Cap (USD Mil) | 28,808 |
| Enterprise Value (USD Mil) | 26,994 |
| Trailing P/E | 10.3 |
| Forward P/E | 7 |
| Price/Sales (TTM) | 3.6 |
| Price/Book (mrq) | 3.2 |
| EV/Revenue | 3.4 |
| EV/EBITDA | 5.4 |
| Beta (5Y Monthly) | 1.35 |
| FCF Yield % (TTM) | 9.9% |
| Forward EPS (USD) | 3.4 |
| Analyst Target Price – Low (USD) | 10 |
| Analyst Target Price – Mean (USD) | 40.9 |
| Analyst Target Price – High (USD) | 56 |
| # Analyst Opinions | 11 |
Source: Yahoo Finance
KGC trades at 10.3x trailing earnings, 7x forward earnings, 3.4x EV/revenue, and 5.4x EV/EBITDA, with a 9.9% FCF yield. On my read, fair value sits in a range of $30-$42 per share: that is above the implied current level, but still below the $40.9 analyst mean and well under the $56 high, so my range sits inside the consensus band rather than fighting it. The 11 analyst opinions give that consensus real weight, and I think the market is already giving credit for the company’s cash generation; what keeps me from a more aggressive call is that the stock is not cheap enough to ignore the fact that gold miners can re-rate quickly when margins peak. Forward EPS of 3.43 also looks solid versus peers, but KGC’s valuation is not pricing a meaningfully higher earnings trajectory than the stronger names in the group.
Leverage
KGC — Leverage & Coverage (Quarterly)
| Metric | Value |
|---|---|
| Total Debt/Equity % (mrq) | 8.2 |
| Current Ratio (mrq) | 2.8 |
| Total Debt (mrq, USD Mil) | 756.5 |
| Operating Cash Flow (TTM, USD Mil) | 4,292.9 |
| Levered Free Cash Flow (TTM, USD Mil) | 2,846.5 |
| Net Debt/EBITDA (TTM) | -0.3 |
| FCF Margin % (TTM) | 35.8% |
Source: Yahoo Finance — Quarterly Financial Statements
Debt is modest at $756.5M, debt/equity is 8.2%, and the current ratio is 2.8x. Net debt/EBITDA is -0.3x, which means cash exceeds debt, and that is the key point for me: the company is not relying on leverage to support the equity story. With $4.3B of operating cash flow and $2.8B of levered free cash flow over the past year, the balance sheet gives KGC room to absorb volatility and still return capital if the operating trend holds.
Comparable Analysis
Growth
| Company | Revenue TTM (USD Mil) | Revenue Growth YoY % | Diluted EPS TTM |
|---|---|---|---|
| KGC | 7,961.3 | 60.8% | 2.4 |
| NEM | 24,966 | 45.8% | 7.7 |
| AEM | 13,539.2 | 66.1% | 10.6 |
| GFI | 8,751.3 | 71.4% | 3.9 |
| CDE | 2,566.3 | 137.8% | 1.2 |
Source: Yahoo Finance
KGC’s 60.8% revenue growth trails CDE’s 137.8% and GFI’s 71.4%, but it is ahead of NEM’s 45.8%. On EBITDA, KGC’s $5B TTM sits below NEM’s $16.3B and AEM’s $9.5B, yet the company’s growth is still strong enough to support a premium to slower growers. I think that matters because KGC is not the fastest grower, but it is growing from a much stronger profitability base than CDE.
Valuation
| Company | Trailing P/E | Forward P/E | EV/Revenue | EV/EBITDA | Price/Sales (TTM) | Price/Book (mrq) | Market Cap (USD Mil) | Enterprise Value (USD Mil) | Beta (5Y Monthly) | FCF Yield % (TTM) | Forward EPS | Analyst Target Price – Low | Analyst Target Price – Mean | Analyst Target Price – High | # Analyst Opinions |
|---|---|---|---|---|---|---|---|---|---|---|---|---|---|---|---|
| KGC | 10.3 | 7 | 3.4 | 5.4 | 3.6 | 3.2 | 28,808 | 26,994 | 1.35 | 9.9% | 3.4 | 10 | 40.9 | 56 | 11 |
| NEM | 12.5 | 8.5 | 3.9 | 6 | 4.1 | 3 | 102,629 | 97,318 | 0.46 | 9.6% | 11.4 | 72 | 140.2 | 175 | 21 |
| AEM | 14.8 | 10.8 | 5.5 | 7.7 | 5.8 | 3 | 78,376 | 73,932 | 0.57 | 5.5% | 14.4 | 93 | 243.9 | 310 | 14 |
| GFI | 8.4 | 5.9 | 6.7 | 11.4 | 3.4 | 7.1 | 29,766 | 58,710 | 0.51 | 8.6% | 5.6 | 46 | 56.8 | 75 | 8 |
| CDE | 12.9 | 7.9 | 6.2 | 11.7 | 6.4 | 1.6 | 16,525 | 15,934 | 1.27 | 3.1% | 2 | 19 | 27.3 | 40 | 11 |
Source: Yahoo Finance
KGC’s 10.3x trailing P/E and 5.4x EV/EBITDA are below AEM’s 14.8x and 7.7x, and below NEM’s 12.5x and 6x, while GFI is cheaper on trailing P/E at 8.4x but much richer on EV/EBITDA at 11.4x. The stock’s 55.5% one-year total return sits below CDE’s 73.6% and NEM’s 63.6%, which tells me the market has rewarded the group broadly rather than giving KGC a unique rerating. Put differently, KGC’s valuation looks reasonable against its growth and cash yield, but it is not the cheapest name once leverage and earnings quality are considered together.
Profitability
| Company | Operating Margin (TTM) | Net Margin (TTM) | Return on Assets (TTM) | Return on Equity (TTM) | Gross Margin (TTM) | EBITDA Margin (TTM) |
|---|---|---|---|---|---|---|
| KGC | 55.1% | 36.0% | 20.3% | 35.5% | 68.7% | 62.3% |
| NEM | 61.4% | 33.9% | 14.9% | 25.8% | 67.4% | 65.5% |
| AEM | 62.8% | 39.5% | 15.5% | 22.3% | 73.9% | 70.5% |
| GFI | 51.8% | 40.8% | 21.4% | 51.9% | 55.3% | 59.1% |
| CDE | 43.0% | 31.1% | 6.7% | 12.1% | 58.6% | 53.2% |
Source: Yahoo Finance
KGC’s 55.1% operating margin and 62.3% EBITDA margin are below AEM’s 62.8% and 70.5%, but above CDE’s 43.0% and 53.2%. ROE of 35.5% is stronger than NEM’s 25.8% and AEM’s 22.3%, though still behind GFI’s 51.9%. That mix tells me KGC is not the highest-margin miner, but it is one of the better all-around operators, which helps explain why its valuation sits in the middle of the peer group.
Leverage
| Company | Total Debt/Equity % (mrq) | Current Ratio (mrq) | Total Debt (mrq, USD Mil) | Free Cash Flow TTM (USD Mil) | Net Debt/EBITDA (TTM) | FCF Margin % (TTM) |
|---|---|---|---|---|---|---|
| KGC | 8.2 | 2.8 | 756.5 | 2,846.5 | -0.3 | 35.8% |
| NEM | 15.8 | 2.4 | 5,532 | 9,804.9 | -0.2 | 39.3% |
| AEM | 1.2 | 3.1 | 319.2 | 4,282.9 | -0.3 | 31.6% |
| GFI | 37.1 | 1.8 | 3,221.2 | 2,546.1 | 0.3 | 29.1% |
| CDE | 7.4 | 3.7 | 773.2 | 511.8 | -0.1 | 20.0% |
Source: Yahoo Finance
KGC’s 8.2% debt/equity and -0.3x net debt/EBITDA compare favorably with GFI’s 37.1% and 0.3x, while AEM’s 1.2% debt/equity shows even more balance-sheet conservatism. Current ratio of 2.8x is solid, though not as high as CDE’s 3.7x. I view KGC’s leverage profile as a strength because it supports the equity multiple without forcing the market to pay for financial risk.
Conclusion
I would put my rating as a Hold because the company’s fundamentals are strong, but the stock already reflects a lot of that strength. The key support is the combination of 55.1% operating margin, 35.5% ROE, and 9.9% FCF yield, which tells me the business is producing real economic value. The reason I stop at Hold is that the current valuation leaves less room for disappointment if gold prices soften or if margins drift down from the current level.
I would move more toward a Buy if quarterly EBITDA stays above $1.6B and FCF margin remains near 35.8%, because that would show the current cash engine is durable and not just a peak-period result. I would move toward a Sell if operating margin fell back below 50%, meaning the company would no longer be converting revenue into profit at the same high rate, or if net debt/EBITDA moved back above 0x, which would mean cash no longer exceeds debt. Those are the thresholds that matter to me because they would tell me whether the current earnings quality is holding or fading.
Weighing both sides, I think the most likely path is continued solid execution with a valuation that stays fair rather than obviously cheap. That is enough for a Hold, but not enough for me to chase the stock at current levels.
What’s your take? I rated Kinross Gold (KGC) HOLD above — but the goal here is to get this right, not just to publish an opinion. What would you add to this analysis, or which risk or catalyst do you think I’m under- or over-weighting? Tell me in the comments.
Data sourced from Yahoo Finance. Not investment advice.
Leave a Reply