
| Company | Aug 25 | Sep 25 | Oct 25 | Nov 25 | Dec 25 | Jan 26 | Feb 26 | Mar 26 | Apr 26 | May 26 | Jun 26 | Jul 26 | 12-Mo |
|---|---|---|---|---|---|---|---|---|---|---|---|---|---|
| OWLT | +3% | +12% | +10% | +42% | +23% | -25% | -4% | -55% | -4% | +12% | +4% | -10% | -30% |
| KIDS | +3% | -13% | -9% | +10% | -4% | -2% | +10% | -17% | -5% | +14% | +11% | +6% | -3% |
| NNOX | -18% | -4% | -2% | +23% | -38% | -2% | -13% | -4% | -25% | +12% | -40% | -16% | -79% |
| BFLY | -6% | +20% | +39% | +15% | +23% | +4% | -4% | +7% | +19% | -5% | +85% | -16% | +316% |
| AMWL | -6% | -11% | -15% | -19% | +16% | -7% | +25% | -8% | +20% | +56% | -7% | +18% | +46% |
| TDOC | +7% | +0% | +12% | -12% | -8% | -22% | -3% | +4% | +11% | +26% | +11% | -21% | -7% |
Source: Yahoo Finance monthly adjusted close.
Quick Thesis
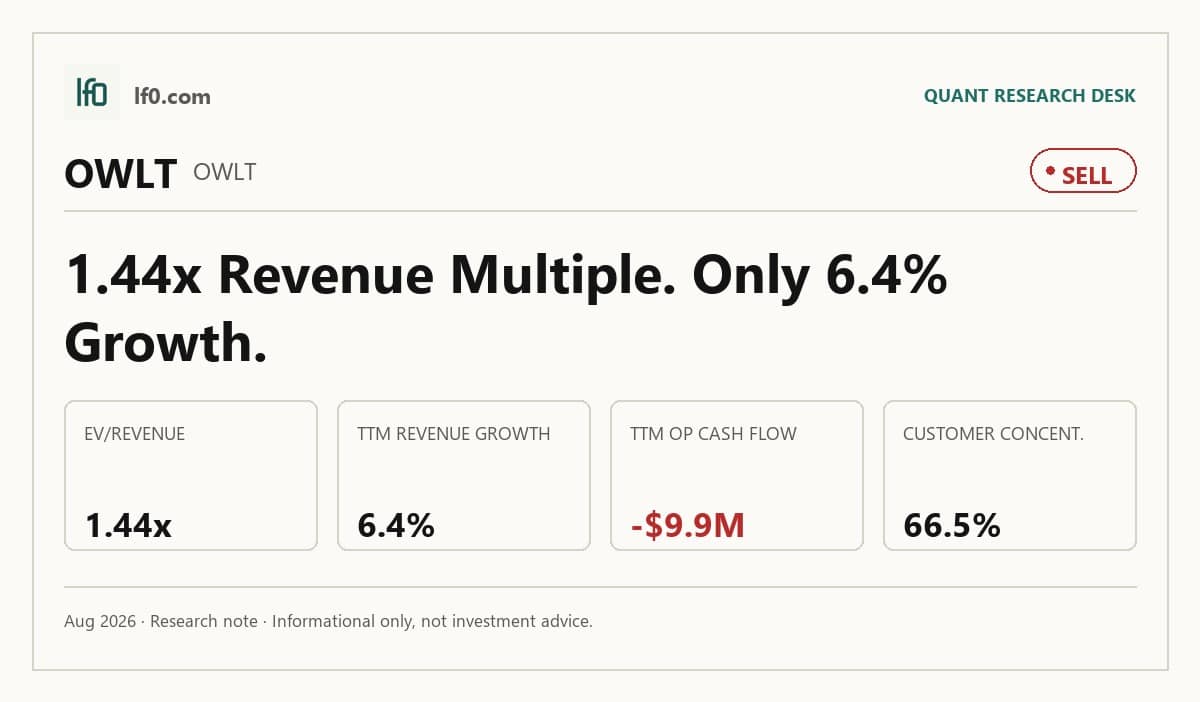
- Rated sell because valuation still outruns cash generation and operating leverage.
- Gross margin is the key strength: 50.9% TTM.
- Customer concentration is the key risk: three customers were 66.5% of FY2025 revenue.
- Valuation is rich versus peers at 1.4x EV/revenue.
- I would turn more constructive if EBITDA margin turns positive and quarterly revenue holds above $26.6M.
Executive Summary
Rating: SELL | OWLT
Measured from adjusted close on 2026-08-12 to 2026-09-25. Sell ratings are correct when the stock falls; Hold is tracked as a +/-10% range. Daily-close data, not intraday. Calls are tracked for 182 days from publication, then frozen as a final record.
I would put my rating as a Sell because Owlet’s regulatory moat is real, but the business is still not self-funding and the stock already prices in a cleaner earnings path than the latest quarter supports. Revenue was $22.5M in Q1 2026, TTM operating cash flow was -$9.916M, and levered free cash flow was -$10.62M, so the market is paying for optionality before the model has proven it can finance itself.
The most important strength is the 50.9% TTM gross margin, which tells me the product layer works and gives the company room to scale if demand and mix improve. The main risk is customer concentration: the three largest customers represented 66.5% of FY2025 revenue, so a single channel reset could hit sales quickly. I would turn more constructive if EBITDA margin becomes positive and quarterly revenue stays above $26.6M, because that would show the subscription layer and device mix are finally creating operating leverage.
Company Profile
Owlet develops pediatric health products that combine wearable monitoring, video, and app-based software. Dream Sock tracks pulse rate and oxygen saturation, BabySat is a prescription pulse oximeter sold through healthcare channels, Dream Sight is a Wi-Fi 2K HD video monitor, and Owlet360 is a $9.99-per-month subscription service that monetizes the company’s pediatric data.
The company was incorporated in Delaware in 2014 and began selling its first smart sock in 2015. It went public through a merger in July 2021, then broadened its product set with Dream Sock, BabySat, Dream Sight, and Owlet360. As of December 31, 2025, Owlet sold in more than 30 countries and expanded into India in early 2026.
Economic Moat
Business Model
The only defensible edge I see is regulatory authorization. In my view, Owlet’s FDA-cleared and internationally medically certified wearable pediatric monitors are hard for a well-funded competitor to replicate within 3 years because the barrier runs through testing, regulatory review, and post-market compliance rather than simple product design. Dream Sock has U.S. FDA marketing authorization and clearances in the European Union, the United Kingdom, Australia, South Africa, India, and Israel, while BabySat is FDA cleared and prescription only in the U.S.; that gives Owlet a higher regulatory bar than consumer baby-monitor rivals and a second channel into healthcare distribution.
I also see a secondary moat in the data asset. More than 25 million devices sold worldwide and one of the world’s largest datasets of pediatric health and sleep information give the company a feedback loop that can improve personalization and subscription value, although I view that edge as less durable because competitors can build data over time. The moat is therefore real, but it is narrower than the product list suggests.
Business & Operating Risks
Owlet’s biggest disclosed risk is customer concentration: sales through its three largest customers were 66.5% of revenue in FY2025 and 63.0% in FY2024, so a retailer order cut, shelf reset, or delisting would hit the top line quickly. That concentration is already visible in the numbers, because FY2025 revenue growth was tied to a narrow retail base rather than a broad demand footprint.
A second risk is app-store dependence. Dream Sight and Owlet Cam rely on the mobile apps for full functionality, and Owlet360 would be unavailable if the apps were removed from Apple’s App Store or Google Play Store. Apple has also told Owlet it will remove the apps in any country where a product requires marketing authorization or certification, which makes platform access a regulatory choke point rather than a normal software risk.
Manufacturing and component supply are another pressure point. Dream Sock and BabySat rely on Benchmark Electronics in Thailand, Dream Sight relies on Aoni in China and Vietnam, and the filing says the Thailand facility has reached maximum production capacity while Dream Sight and Dream Duo depend on NAND flash memory whose contract prices have increased significantly. That matters because the business is trying to scale a regulated hardware platform while its supply chain is already tight.
The disclosed risks do not break the moat, but they do test it: the regulatory edge still stands, while customer concentration and app-store dependence threaten the distribution and software layers that are supposed to make that edge monetizable.
Management Discussion & Analysis
Management is trying to address the operating risks through financing and product expansion, but the company is still leaning on external capital. Owlet completed an underwritten public offering on October 23, 2025 and raised net proceeds of $32,109, which helped support commercialization and research and development. That was a sensible bridge for a company with $35,461 of cash at December 31, 2025, yet it also tells me the business is not internally funded.
The June 11, 2025 first amendment to the credit agreement expanded eligible receivables and increased permitted capital expenditures, which is constructive, but it does not change the fact that the company still had $7.0M outstanding under the WTI Loan Facility and $6.9M drawn on the ABL Line of Credit at year-end. Management also pointed to the January 2025 launch of Owlet360 and higher Dream Sock and Dream Duo sales as growth drivers, and the 2025 revenue increase to $105.7 million from $78.1 million in 2024 does support that narrative. Even so, the 2025 gross margin of 50.6% was helped by mix and fixed-cost absorption rather than a step change in pricing power, so the operating improvement is real but not yet durable.
In my view, management is responding to the risks, but the response is still financial rather than operational: it is buying time for the platform to scale, not proving that the platform already funds itself. That is why the tone in the MD&A reads more optimistic than the cash generation warrants.
Recent Events
The most important recent event was the leadership change on April 3, 2026, when Kurt Workman was appointed President and Chief Executive Officer effective April 6, replacing Jonathan Harris. I think that change matters only if it improves execution discipline, because the board paired it with a separation package that included 12 months of salary continuation and accelerated equity vesting, which suggests a decisive reset rather than a cosmetic one.
The May 7, 2026 first-quarter earnings release did not bring a strategic transaction or financing event, so it left the operating thesis largely unchanged. The June 2, 2026 postponement of the annual meeting to August 12 was administrative, but it does extend the governance timeline and resets the stockholder proposal deadline to June 15. Taken together, the recent events do not alter the moat thesis; they mainly tell me the company is still in execution mode rather than transformation mode.
Financial Analysis
Growth
OWLT — Financial Growth (Quarterly, USD Mil)
| Metric | 2025-03-31 | 2025-06-30 | 2025-09-30 | 2025-12-31 | 2026-03-31 |
|---|---|---|---|---|---|
| REVENUE (USD Mil) | 21.1 | 26.1 | 32 | 26.6 | 22.5 |
| EBITDA (USD Mil) | 4.1 | -1.8 | 5.2 | -8.5 | -2.5 |
| DILUTED EPS | 0.1 | -2.4 | -0.1 | -0.4 | -0.2 |
Source: Yahoo Finance — Quarterly Financial Statements
Revenue moved from $21.1M in Q1 2025 to $26.1M in Q2 2025 and $32M in Q3 2025, then slipped to $26.6M in Q4 2025 and $22.5M in Q1 2026. That pattern looks choppy rather than compounding, which is consistent with a retailer-led hardware business where shipment timing can swing quarter to quarter.
EBITDA followed the same uneven path, rising to $5.16M in Q3 2025 before falling to -$8.46M in Q4 2025 and -$2.46M in Q1 2026. The drop from Q4 2025 to Q1 2026 is not fully explained in the MD&A, so I would not read the latest quarter as proof of a broken model, but I would treat it as a warning that growth is not yet translating into stable earnings.
Profitability
OWLT — Profitability (TTM)
| Metric | TTM |
|---|---|
| Operating Margin (TTM) | -24.5% |
| Net Margin (TTM) | -43.0% |
| Return on Equity (TTM) | -526.2% |
| Gross Margin (TTM) | 50.9% |
| EBITDA Margin (TTM) | -10.2% |
Source: Yahoo Finance — Trailing Twelve Months (TTM)
TTM gross margin was 50.9%, which is the clearest sign that the product layer works. The problem is below gross profit: TTM EBITDA margin was -10.2%, operating margin was -24.5%, and net margin was -43%, so overhead, marketing, and non-cash charges are still absorbing the economics.
Return on assets was -10% and return on equity was -526%, and that gap tells me returns are not yet durable. The key threshold to watch is EBITDA margin turning positive, because that would show operating leverage is finally catching up with the gross profit base. This is where the moat and the financials meet: the regulatory edge can support premium economics, but the current margin structure still looks too thin to convert that edge into equity returns.
Valuation
OWLT — Valuation Multiples
| Metric | Value |
|---|---|
| Market Cap (USD Mil) | 158 |
| Enterprise Value (USD Mil) | 154 |
| Forward P/E | 49.5 |
| Price/Sales (TTM) | 1.5 |
| Price/Book (mrq) | 7.3 |
| EV/Revenue | 1.4 |
| EV/EBITDA | -14.2 |
| Beta (5Y Monthly) | 1.91 |
| FCF Yield % (TTM) | -6.7% |
| Forward EPS (USD) | 0.1 |
| Analyst Target Price – Low (USD) | 10 |
| Analyst Target Price – Mean (USD) | 12.7 |
| Analyst Target Price – High (USD) | 15 |
| # Analyst Opinions | 3 |
Source: Yahoo Finance
I would put fair value in a range of roughly $5-$8 per share based on the current revenue base, the peer multiple spread, and the company’s negative free cash flow. That range sits below the $10–$15 analyst target band from 3 opinions, and I think the gap reflects my heavier weight on leverage and cash burn than the consensus appears to assign.
Forward EPS is 0.11, which is enough to justify a forward multiple, but not enough yet to make the stock look cheap on earnings power alone. On that basis, the current 49.5x forward P/E and 1.48x EV/revenue still look ahead of the company’s cash conversion, especially because the business is not yet producing positive free cash flow. I would need to see positive EBITDA and sustained revenue above $26.6M before I would argue for a meaningfully higher fair-value band.
Leverage
OWLT — Leverage & Coverage (Quarterly)
| Metric | Value |
|---|---|
| Total Debt/Equity % (mrq) | 55.4 |
| Current Ratio (mrq) | 1.7 |
| Total Debt (mrq, USD Mil) | 18.8 |
| Net Debt/EBITDA (TTM) | 1.5 |
| FCF Margin % (TTM) | -9.9% |
Source: Yahoo Finance — Quarterly Financial Statements
Leverage is manageable on paper, but cash generation is still weak. Total debt/equity was 55.44%, the current ratio was 1.713x, and total debt was $18.77M, so the balance sheet is not stretched today.
The issue is cash conversion: operating cash flow was -$9.916M, levered free cash flow was -$10.62M, net debt/EBITDA was 1.535x, and FCF margin was -9.92%. That means liquidity is being consumed rather than rebuilt, so the company still needs operating improvement before the balance sheet becomes a real source of support.
Insider Activity
The insider tape is one-sided selling. There were 25 open-market sales and no open-market purchases across 14 filings from 2024-10-17 to 2026-04-28, with activity concentrated in Jonathan Harris and Amanda Crawford. I do not read that as a decisive thesis signal by itself, but it does tell me insiders are not stepping in to buy at current levels.
Comparable Analysis
Growth
| Company | Revenue TTM (USD Mil) | Revenue Growth YoY % | Diluted EPS TTM |
|---|---|---|---|
| OWLT | 107.1 | 6.4% | -0.3 |
| KIDS | 252.7 | 15.4% | -1.8 |
| NNOX | 14.5 | 53.1% | -1.2 |
| BFLY | 112.1 | 39.5% | -0.3 |
| AMWL | 218.5 | -26.6% | -4.8 |
| TDOC | 2,489.5 | -4.0% | -1 |
Source: Yahoo Finance
OWLT’s revenue growth of 6.4% TTM trails KIDS at 15.4% and BFLY at 39.5%, while TDOC declined 4.0% and AMWL fell 26.6%. NNOX grew 53.1%, but it did so off a much smaller $14.5M revenue base, so OWLT’s slower growth looks more like a modest scaling profile than a missed acceleration.
Valuation
| Company | Forward P/E | EV/Revenue | EV/EBITDA | Price/Sales (TTM) | Price/Book (mrq) | Market Cap (USD Mil) | Enterprise Value (USD Mil) | Beta (5Y Monthly) | FCF Yield % (TTM) | Forward EPS | Analyst Target Price – Low | Analyst Target Price – Mean | Analyst Target Price – High | # Analyst Opinions |
|---|---|---|---|---|---|---|---|---|---|---|---|---|---|---|
| OWLT | 49.5 | 1.4 | -14.2 | 1.5 | 7.3 | 158 | 154 | 1.91 | -6.7% | 0.1 | 10 | 12.7 | 15 | 3 |
| KIDS | -34.1 | 2.8 | -1,569 | 2.5 | 1.8 | 633 | 698 | 0.96 | 0.5% | -0.7 | 22 | 26.7 | 35 | 9 |
| NNOX | -3.7 | 2.8 | -0.8 | 5.3 | 0.6 | 77 | 41 | 1.27 | -37.4% | -0.3 | 3 | 5.1 | 7.4 | 3 |
| BFLY | -156.2 | 21.3 | -51 | 22.2 | 13.1 | 2,495 | 2,390 | 2.08 | 0.0% | -0.1 | 5.2 | 9.3 | 11 | 4 |
| AMWL | -8.2 | 0.2 | -1.1 | 1 | 1 | 217 | 41 | — | 6.6% | -1.6 | 7.5 | 11.9 | 16 | 5 |
| TDOC | -8.7 | 0.6 | 23.2 | 0.5 | 0.9 | 1,237 | 1,499 | 2.13 | 15.4% | -0.8 | 5.5 | 7.8 | 10.5 | 19 |
Source: Yahoo Finance
OWLT trades at 1.4x EV/revenue and 1.5x price/sales, which is above TDOC at 0.6x and AMWL at 0.2x, but below KIDS and NNOX at 2.8x and far below BFLY at 21.3x. That spread makes sense to me because OWLT’s -6.72% FCF yield and 55.44% debt/equity do not support a premium multiple, even though the company has a better gross margin base than most peers.
Using peer EV/revenue as a rough frame, OWLT’s current revenue base implies a wide valuation band, but the leverage and cash burn profile keep me closer to the lower half of that range. The market is paying for optionality, not for proven cash generation, and that is why I think the stock screens as fair to slightly expensive rather than cheap.
Profitability
| Company | Operating Margin (TTM) | Net Margin (TTM) | Return on Equity (TTM) | Gross Margin (TTM) | EBITDA Margin (TTM) |
|---|---|---|---|---|---|
| OWLT | -24.5% | -43.0% | -526.2% | 50.9% | -10.2% |
| KIDS | -5.8% | -15.7% | -11.4% | 73.7% | -0.2% |
| NNOX | -337.0% | 0.0% | -50.1% | -84.9% | -341.0% |
| BFLY | -30.9% | -66.7% | -35.5% | 68.2% | -41.8% |
| AMWL | -18.4% | -35.7% | -29.1% | 52.4% | -17.3% |
| TDOC | -5.7% | -7.1% | -13.0% | 69.0% | 2.6% |
Source: Yahoo Finance
OWLT’s 50.9% gross margin is below KIDS at 73.7%, BFLY at 68.2%, and TDOC at 69.0%, while its -24.5% operating margin and -43% net margin are materially weaker than KIDS at -5.8% and -15.7% and TDOC at -5.7% and -7.1%. The gap looks more like an opex and scale problem than a pure cost-of-revenue issue, because gross margin is not the main outlier.
EBITDA margin at -10.2% also trails TDOC’s 2.6%, which tells me OWLT still lacks operating leverage. On a like-for-like basis, the company is not yet earning the kind of margin profile that would justify a premium to the better-scaled names.
Leverage
| Company | Total Debt/Equity % (mrq) | Current Ratio (mrq) | Total Debt (mrq, USD Mil) | Operating Cash Flow TTM (USD Mil) | Free Cash Flow TTM (USD Mil) | Net Debt/EBITDA (TTM) | FCF Margin % (TTM) |
|---|---|---|---|---|---|---|---|
| OWLT | 55.4 | 1.7 | 18.8 | -9.9 | -10.6 | 1.5 | -9.9% |
| KIDS | 32.4 | 4.8 | 111.2 | 7.4 | 3.2 | -146.8 | 1.3% |
| NNOX | 6 | 3.6 | 7.6 | -44.4 | -28.9 | 0.7 | -199.2% |
| BFLY | 10.1 | 4.1 | 19.1 | -24 | 0.9 | 2.3 | 0.8% |
| AMWL | 1.3 | 2.9 | 3 | -26.4 | 14.2 | 5.1 | 6.5% |
| TDOC | 79.1 | 0.8 | 1,036.2 | 261.2 | 191 | 4.1 | 7.7% |
Source: Yahoo Finance
OWLT’s 55.44% debt/equity is higher than KIDS at 32.4% and NNOX at 6.0%, but below TDOC at 79.1%. Net debt/EBITDA of 1.5x looks moderate, yet that is less comforting when EBITDA is negative and FCF margin is -9.9%.
KIDS has a 4.8x current ratio and positive free cash flow, while TDOC has 7.7% FCF margin and 4.1x net debt/EBITDA, so OWLT’s balance sheet is serviceable but not a competitive advantage. The leverage profile matters because it limits how long the company can wait for the operating model to catch up.
Conclusion
I would put my rating as a Sell because the regulatory moat is real, but the numbers still show a business that is not yet self-funding. The key tension is simple: gross margin is healthy at 50.9%, yet TTM operating cash flow is still -$9.9M and levered free cash flow is -$10.6M, so the company has not converted its product advantage into durable cash generation.
The bull case is that the platform keeps scaling. If EBITDA margin turns positive and quarterly revenue stays above $26.6M, meaning the business is holding a higher run rate rather than relying on one shipment-heavy quarter, I would move more toward a Buy because that would show the subscription layer and device mix are finally creating operating leverage. A cleaner confirmation would be free cash flow turning positive, since that would prove the company can fund growth internally instead of leaning on equity or debt amendments.
The bear case is that growth normalizes before cash burn does. If revenue growth falls below 5% for two consecutive quarters, I would move from Sell toward a more negative view because that would suggest the 2025 expansion was channel driven rather than durable. I would also turn more cautious if operating cash flow stays negative and levered free cash flow remains below zero while the stock still trades above 1.4x EV/revenue, because that would mean investors are still paying for optionality without evidence that the model can finance itself.
Weighing both sides, I stay with Sell. The moat is better than the cash flow, and until the company shows a quarter of positive free cash flow, I think the market is still ahead of the fundamentals.
What to Watch Next
- EBITDA margin turns positive — would support a move toward Buy.
- Quarterly revenue stays above $26.6M — would confirm the higher run rate.
- Free cash flow turns positive — would show the model can fund itself.
- Revenue growth falls below 5% for two quarters — would strengthen the bear case.
- Operating cash flow and levered free cash flow stay negative — would keep financing risk elevated.
What’s your take? I rated Owlet (OWLT) SELL above — but the goal here is to get this right, not just to publish an opinion. What would you add to this analysis, or which risk or catalyst do you think I’m under- or over-weighting? Tell me in the comments.
Sources
- SEC 10-K Annual Report — filed 2026-03-09
- SEC 8-K Filing (2026-06-05)
- SEC 8-K Filing (2026-05-07)
- SEC 8-K Filing (2026-04-06)
- SEC 8-K Filing (2026-03-05)
- SEC 8-K Filing (2026-02-05)
- SEC Form 4 Insider Transaction (2026-05-01)
- SEC Form 4 Insider Transaction (2026-04-30)
- SEC Form 4 Insider Transaction (2026-04-30)
- SEC 10-K Annual Report — FY2026
- SEC 10-K Annual Report — FY2025
- SEC 10-K Annual Report — FY2024
- SEC 10-K Annual Report — FY2023
- SEC 10-K Annual Report — FY2022
Data sourced from Yahoo Finance and SEC EDGAR. Not investment advice.
Leave a Comment