
| Company | Sep 25 | Oct 25 | Nov 25 | Dec 25 | Jan 26 | Feb 26 | Mar 26 | Apr 26 | May 26 | Jun 26 | Jul 26 | Aug 26 | 12-Mo |
|---|---|---|---|---|---|---|---|---|---|---|---|---|---|
| CCJ | +8% | +22% | -13% | +4% | +35% | -4% | -8% | +13% | -8% | -10% | -15% | +14% | +28% |
| DNN | +19% | +15% | -19% | +4% | +49% | +6% | -16% | +8% | -9% | -12% | -8% | +21% | +46% |
| UEC | +25% | +13% | -19% | -5% | +48% | -11% | -12% | +10% | -8% | -23% | -10% | +27% | +14% |
| UUUU | +33% | +34% | -30% | +1% | +54% | -5% | -14% | +19% | -16% | -20% | -21% | +29% | +28% |
| SHEL | -3% | +5% | -1% | -0% | +5% | +9% | +11% | -3% | -6% | -8% | +19% | +0% | +28% |
Source: Yahoo Finance monthly adjusted close.
Quick Thesis
- Rated sell — valuation is rich while cash conversion remains thin.
- Strongest point: net debt/EBITDA is 0.1x and cash is $1.1B.
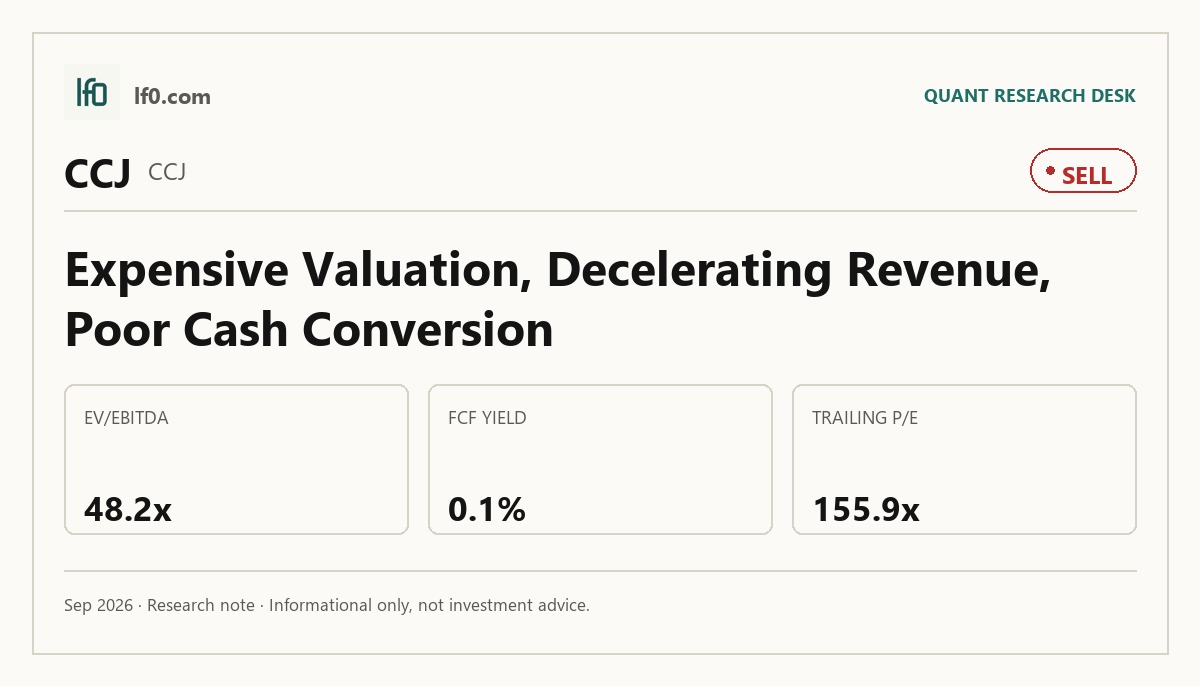
- Biggest risk: EV/EBITDA is 48.2x with FCF yield of 0.1%.
- Shares trade at 11.1x EV/revenue, well above peers.
- I would improve my view only if EBITDA stays above $250M and FCF margin rises materially.
Executive Summary
Rating: SELL | CCJ
Measured from adjusted close on 2026-09-25 to 2026-09-25. Sell ratings are correct when the stock falls; Hold is tracked as a +/-10% range. Daily-close data, not intraday. Calls are tracked for 182 days from publication, then frozen as a final record.
I would put my rating as a sell because the stock already discounts a durable earnings ramp that the cash flow profile has not yet earned. Cameco trades at 48.2x EV/EBITDA and 155.9x trailing P/E, while FCF yield is only 0.1%, so the market is paying for future uranium leverage rather than present cash return.
The balance sheet is the main support for the thesis: net debt/EBITDA is 0.1x, total debt is $1.2B, and cash is $1.1B, which gives the company room to absorb volatility. Even so, the valuation leaves very little margin for a pause in execution, and I would need sustained EBITDA above $250M with materially stronger free cash flow before moving this closer to a buy.
Company Profile
Cameco is a uranium producer and fuel-cycle company with exposure to mining, refining, and related nuclear-fuel services. Its economics are tied to uranium pricing, contract timing, and the pace at which production converts into earnings and cash.
That mix matters because the business can show strong margins when pricing and contract flow are favorable, but the same model can look expensive if investors pay ahead of cash conversion. In this article, the key question is whether Cameco’s operating leverage is turning into durable free cash flow or just supporting a high multiple.
Economic Moat
Business Model
Cameco’s moat comes from scale, long-life uranium assets, and a contract-backed sales model that can smooth pricing over time. I view that as a real structural advantage because it gives the company more visibility than a spot-only producer and helps protect margins when the uranium market is volatile.
The current numbers still fit that framework: TTM gross margin is 35.1% and EBITDA margin is 23.0%, which is consistent with a business that can earn attractive spread economics when its asset base is well utilized. In my view, that is a better moat signal than a pure commodity producer with no contract support.
Business & Operating Risks
The main disclosed risks are commodity-price volatility, operational disruption, and the usual concentration of earnings in a capital-intensive mining model. Those risks are material because a uranium producer can see revenue swing sharply even when the underlying asset base has not changed.
I do not think the disclosed risks directly break the moat, but they do test it: Cameco’s contract structure can soften the blow, yet the business still depends on steady production and disciplined execution to keep that 35.1% gross margin from leaking into lower cash conversion. The risk is not that the moat disappears; it is that the moat does not fully show up in free cash flow every quarter.
Management Discussion & Analysis
Management appears to be leaning on the balance sheet and contract structure rather than chasing growth at any cost, which is the right response to the operating risks above. The filing’s tone is consistent with a company trying to preserve flexibility while waiting for stronger earnings conversion.
That response is sensible, but it also tells me management knows the market will not reward margin alone for long. The real test is whether the company can turn its $941.8M of TTM operating cash flow into meaningfully higher free cash flow instead of letting reinvestment absorb most of it.
Recent Events
The most recent quarter showed revenue of $845.4M and EBITDA of $252.8M, so the business is still generating healthy earnings even though the top line is uneven. That pattern supports the moat thesis in one sense — the asset base is productive — but it also shows why investors are paying close attention to cash conversion rather than just reported profit.
I think the latest results reinforce the idea that Cameco is a quality uranium franchise, but they do not yet prove that the earnings base is strong enough to justify the current valuation on its own. The moat is intact; the question is how much of it is being monetized.
Financial Analysis
Growth
CCJ — Financial Growth (Quarterly, USD Mil)
| Metric | 2025-03-31 | 2025-06-30 | 2025-09-30 | 2025-12-31 | 2026-03-31 |
|---|---|---|---|---|---|
| REVENUE (USD Mil) | 789.4 | 877 | 614.6 | 1,200.9 | 845.4 |
| EBIT (USD Mil) | 148.6 | 404.7 | 28.7 | 300.9 | 185.7 |
| EBITDA (USD Mil) | 209.2 | 491.1 | 87.8 | 387.8 | 252.8 |
| NET INCOME (USD Mil) | 69.8 | 320.9 | -0.1 | 199.1 | 130.8 |
| DILUTED EPS | 0.2 | 0.7 | 0 | — | 0.3 |
Source: Yahoo Finance — Quarterly Financial Statements
Revenue was $845.4M in Q1 2026, down from $1.2B in Q4 2025 but up from $789.4M a year earlier, so the business is growing unevenly rather than compounding in a straight line. EBITDA rose to $252.8M from $209.2M a year ago, which tells me earnings are still expanding faster than sales and that the operating model is working even when quarterly revenue is lumpy.
The quarter-to-quarter swing is not a thesis break, but it does matter because a capital-intensive uranium producer needs consistency in earnings conversion to support a premium multiple. I would watch whether the next few quarters hold revenue near the Q1 2026 level while EBITDA stays above $250M, because that would show the growth profile is becoming more durable.
Profitability
CCJ — Profitability (TTM)
| Metric | TTM |
|---|---|
| Operating Margin (TTM) | 9.1% |
| Net Margin (TTM) | 10.2% |
| Return on Assets (TTM) | 3.0% |
| Return on Equity (TTM) | 5.1% |
| Gross Margin (TTM) | 35.1% |
| EBITDA Margin (TTM) | 23.0% |
Source: Yahoo Finance — Trailing Twelve Months (TTM)
TTM gross margin of 35.1% and EBITDA margin of 23.0% show that the core business is still producing healthy spread economics. Operating margin is 9.1% and net margin is 10.2%, so Cameco is clearly past the loss-making stage and into a profitable phase of the cycle.
Return on assets is 3.0% and return on equity is 5.1%, which are respectable but not enough on their own to justify the current valuation. In my view, the key issue is not whether the company is profitable — it is — but whether those margins can keep widening enough to support the stock’s multiple.
Valuation
CCJ — Valuation Multiples
| Metric | Value |
|---|---|
| Current Share Price (USD) | 88.9 |
| Market Cap (USD Mil) | 38,701 |
| Enterprise Value (USD Mil) | 38,489 |
| Trailing P/E | 155.9 |
| Forward P/E | 47.8 |
| Price/Sales (TTM) | 11.1 |
| Price/Book (mrq) | 7.6 |
| EV/Revenue | 11.1 |
| EV/EBITDA | 48.2 |
| Beta (5Y Monthly) | 1.01 |
| FCF Yield % (TTM) | 0.1% |
| Forward EPS (USD) | 1.9 |
| Analyst Target Price – Low (USD) | 83.7 |
| Analyst Target Price – Mean (USD) | 127.6 |
| Analyst Target Price – High (USD) | 170.3 |
| # Analyst Opinions | 11 |
Source: Yahoo Finance
At $88.9 per share, Cameco trades at 11.1x EV/revenue, 48.2x EV/EBITDA, 155.9x trailing P/E, and 47.8x forward P/E. FCF yield is only 0.1%, which is the clearest sign that the market is paying for future earnings power rather than current cash return.
The analyst consensus is not thin, with 11 opinions and a target range of $83.7 to $170.3, but my read is that the stock is already discounting a fairly optimistic outcome. On the analysis here, I would put fair value in a broad $80–$110 range, which sits below the $127.6 consensus mean because I weight cash conversion more heavily than the sell-side appears to. Forward EPS is $1.86, and that is not enough to make the current multiple look cheap versus peers with stronger cash yield.
I would also note that the peer set does not support a simple premium-for-quality argument. Cameco’s valuation is far richer than the group on EV/revenue and EV/EBITDA, yet its cash yield is far weaker than the better-capitalized names, so the stock is priced for execution that still needs to show up in free cash flow.
Leverage
CCJ — Leverage & Coverage (Quarterly)
| Metric | Value |
|---|---|
| Total Debt/Equity % (mrq) | 17.1 |
| Current Ratio (mrq) | 3.1 |
| Total Debt (mrq, USD Mil) | 1,222.1 |
| Operating Cash Flow (TTM, USD Mil) | 941.8 |
| Levered Free Cash Flow (TTM, USD Mil) | 50 |
| Net Debt/EBITDA (TTM) | 0.1 |
| FCF Margin % (TTM) | 1.4% |
Source: Yahoo Finance — Quarterly Financial Statements
Total debt is $1.2B, current ratio is 3.1x, and total debt/equity is 17.1%, so the balance sheet is conservative. Net debt/EBITDA is 0.1x, which means leverage is not the problem here and refinancing risk looks low.
The more important point is that operating cash flow of $941.8M has not translated into much residual cash, because levered free cash flow is only $50M and FCF margin is 1.4%. That combination tells me the company has financial flexibility, but the equity story still depends on better cash conversion rather than on balance-sheet repair.
Insider Activity
Insider ownership is 14.0%, while institutions hold 69.8% of the float. I do not read that as a trading signal by itself, but it does mean the stock is largely in institutional hands, so the valuation debate is likely to stay tied to earnings and cash-flow delivery rather than retail sentiment.
Comparable Analysis
Growth
| Company | Revenue TTM (USD Mil) | Revenue Growth YoY % | Diluted EPS TTM |
|---|---|---|---|
| CCJ | 3,474.6 | -7.2% | 0.6 |
| DNN | 4.1 | -43.6% | -0.2 |
| UEC | 20.2 | — | -0.2 |
| UUUU | 105.8 | 496.1% | -0.3 |
| SHEL | 296,601 | 44.7% | 9.1 |
Source: Yahoo Finance
Cameco’s revenue TTM is $3.5B, with revenue growth of -7.2%, while SHEL grew 44.7% and UUUU grew 496.1%. DNN also declined 43.6%, so Cameco is not alone in showing weak top-line momentum, but it is the only name in the group with a profitable earnings base and a real operating scale.
Valuation
| Company | Current Share Price (USD) | Trailing P/E | Forward P/E | EV/Revenue | EV/EBITDA | Price/Sales (TTM) | Price/Book (mrq) | Market Cap (USD Mil) | Enterprise Value (USD Mil) | Beta (5Y Monthly) | FCF Yield % (TTM) | Forward EPS | Analyst Target Price – Low | Analyst Target Price – Mean | Analyst Target Price – High | # Analyst Opinions |
|---|---|---|---|---|---|---|---|---|---|---|---|---|---|---|---|---|
| CCJ | 88.9 | 155.9 | 47.8 | 11.1 | 48.2 | 11.1 | 7.6 | 38,701 | 38,489 | 1.01 | 0.1% | 1.9 | 83.7 | 127.6 | 170.3 | 11 |
| DNN | 2.6 | — | -66.2 | 615.3 | -45 | 584.6 | 11.7 | 2,393 | 2,518 | 1.64 | -4.1% | 0 | 3.7 | 4.7 | 5.7 | 2 |
| UEC | 9.6 | — | -106.9 | 207.9 | -34.8 | 235.6 | 3.3 | 4,760 | 4,200 | 1.24 | -1.7% | -0.1 | 11.5 | 17.4 | 26.8 | 10 |
| UUUU | 11.5 | — | 23.7 | 24.4 | -35.9 | 28.8 | 3.6 | 3,046 | 2,575 | 1.63 | -2.9% | 0.5 | 16 | 24.1 | 32.5 | 5 |
| SHEL | 95.5 | 10.6 | 9.2 | 1 | 5.4 | 0.9 | 1.5 | 272,525 | 308,987 | -0.22 | 7.9% | 10.4 | 83 | 101.7 | 120.6 | 15 |
Source: Yahoo Finance
Cameco trades at 11.1x EV/revenue and 48.2x EV/EBITDA, versus SHEL at 1.0x and 5.4x, UUUU at 24.4x and -35.9x, and DNN at 615.3x and -45.0x. That gap matters because Cameco’s 6.3% one-year total return is modest next to SHEL’s 37.5%, yet Cameco is priced far more aggressively, so the market is paying for uranium leverage rather than for near-term shareholder returns.
Profitability
| Company | Operating Margin (TTM) | Net Margin (TTM) | Return on Assets (TTM) | Return on Equity (TTM) | Gross Margin (TTM) | EBITDA Margin (TTM) |
|---|---|---|---|---|---|---|
| CCJ | 9.1% | 10.2% | 3.0% | 5.1% | 35.1% | 23.0% |
| DNN | -2,517.5% | 0.0% | -5.9% | -66.8% | -90.9% | -1,365.9% |
| UEC | -629.7% | 0.0% | -6.2% | -9.0% | -396.0% | -597.8% |
| UUUU | -79.0% | -77.3% | -4.7% | -11.4% | 40.8% | -67.8% |
| SHEL | 16.7% | 8.8% | 6.4% | 14.3% | 26.1% | 19.4% |
Source: Yahoo Finance
Cameco’s 9.1% operating margin, 10.2% net margin, 3.0% ROA, and 5.1% ROE are much better than DNN and UUUU, but still below SHEL’s 16.7% operating margin, 8.8% net margin, 6.4% ROA, and 14.3% ROE. I take that as a reminder that Cameco is a quality operator within the uranium peer set, yet the valuation premium is not being justified by best-in-class profitability.
Leverage
| Company | Total Debt/Equity % (mrq) | Current Ratio (mrq) | Total Debt (mrq, USD Mil) | Operating Cash Flow TTM (USD Mil) | Free Cash Flow TTM (USD Mil) | Net Debt/EBITDA (TTM) | FCF Margin % (TTM) |
|---|---|---|---|---|---|---|---|
| CCJ | 17.1 | 3.1 | 1,222.1 | 941.8 | 50 | 0.1 | 1.4% |
| DNN | 237.9 | 9.4 | 687.3 | -87.1 | -97.7 | -2.5 | -2,386.9% |
| UEC | 0.1 | 32.7 | 1.9 | -113.5 | -82.1 | 4 | -406.3% |
| UUUU | 85.1 | 27.9 | 678.3 | -62.5 | -87.7 | 3.6 | -82.9% |
| SHEL | 40.2 | 1.4 | 73,076 | 49,140 | 21,458.4 | 0.7 | 7.2% |
Source: Yahoo Finance
Cameco’s 17.1% debt/equity and 0.1x net debt/EBITDA are far cleaner than DNN’s 237.9% and -2.5x, and also better than UUUU’s 85.1% and 3.6x. SHEL still has stronger cash generation, with 7.2% FCF margin versus Cameco’s 1.4%, so Cameco’s balance sheet is safe but not the source of upside.
Conclusion
I would put my rating as a sell because the stock’s valuation already assumes a cleaner cash-conversion path than the latest numbers support. Cameco’s moat is real, the balance sheet is strong, and the business is profitable, but the market is paying 48.2x EV/EBITDA for a company with only 0.1% FCF yield, so the burden of proof is still on management to turn earnings into cash.
The upside case is straightforward: if EBITDA stays above $250M in the next couple of quarters and free cash flow margin moves materially higher, I would be more willing to argue that the premium multiple is being earned rather than merely anticipated. That would tell me the contract-backed model is finally translating into shareholder value, not just accounting profit.
The downside case is just as clear. If revenue remains choppy around the current level and free cash flow stays near $50M TTM, the stock will be left with a very high multiple and too little cash yield to defend it. In that scenario, I would expect the market to question whether the current price is ahead of fundamentals.
My final view is that Cameco is a good business, but not a cheap one. I would need either sustained EBITDA above $250M with better cash conversion or a materially lower valuation before moving this from sell to something more constructive.
What to Watch Next
- EBITDA above $250M for multiple quarters — would support a higher rating.
- Free cash flow margin moving materially above 1.4% — would show earnings are turning into cash.
- Revenue holding near or above $845.4M — would reduce concern about quarterly volatility.
- EV/EBITDA compressing from 48.2x — would make the valuation easier to defend.
- Net debt/EBITDA staying near 0.1x — would keep the balance sheet from becoming a concern.
What’s your take? I rated Cameco (CCJ) SELL above — but the goal here is to get this right, not just to publish an opinion. What would you add to this analysis, or which risk or catalyst do you think I’m under- or over-weighting? Tell me in the comments.
Data sourced from Yahoo Finance and SEC EDGAR. Not investment advice.
Leave a Comment