
| Company | Sep 25 | Oct 25 | Nov 25 | Dec 25 | Jan 26 | Feb 26 | Mar 26 | Apr 26 | May 26 | Jun 26 | Jul 26 | Aug 26 | 12-Mo |
|---|---|---|---|---|---|---|---|---|---|---|---|---|---|
| TLN | +12% | -6% | -1% | -5% | -7% | +6% | -14% | +17% | +4% | -1% | -13% | -11% | -22% |
| NRG | +11% | +6% | -1% | -6% | -4% | +18% | -18% | +6% | -14% | +9% | -8% | -18% | -23% |
| VST | +4% | -4% | -5% | -10% | -2% | +10% | -13% | +5% | +2% | -1% | -7% | -7% | -27% |
| CEG | +7% | +15% | -3% | -3% | -21% | +18% | -15% | +12% | -8% | -14% | +6% | +5% | -10% |
| AES | -3% | +7% | +1% | +2% | +3% | +18% | -18% | +3% | +3% | -0% | +1% | +0% | +14% |
| CWEN | -4% | +13% | +15% | -8% | +9% | +6% | +4% | +3% | +2% | -16% | -7% | +0% | +12% |
Source: Yahoo Finance monthly adjusted close.
Quick Thesis
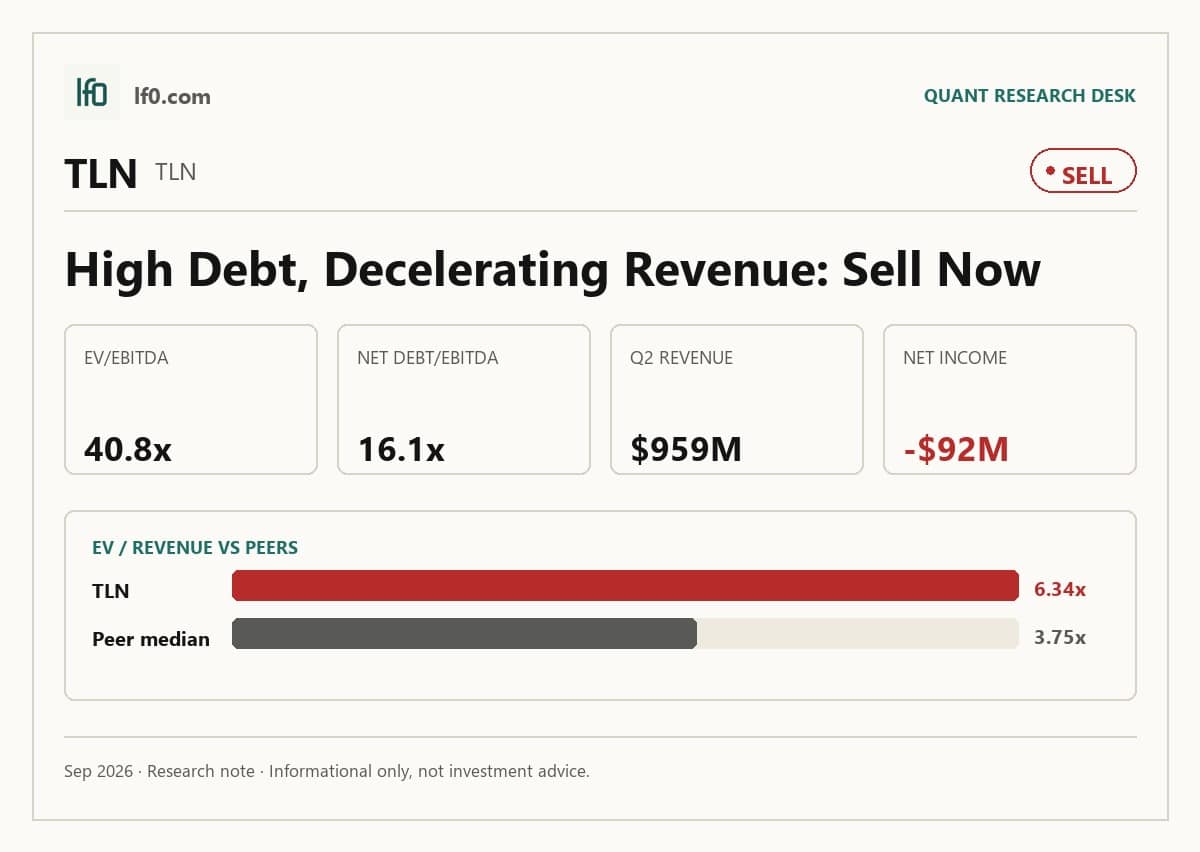
- Rated sell — leverage is too high for the earnings base.
- Strongest support is 8.8% FCF yield on $300 per share.
- Biggest risk is 16.1x net debt/EBITDA and 584.1% debt/equity.
- Valuation is rich at 40.8x EV/EBITDA versus peers.
- I would turn more constructive only if net debt/EBITDA falls below 10.0x, meaning debt becomes materially more manageable.
Executive Summary
Rating: SELL | TLN
We’ll begin tracking this call’s performance since publication once sufficient adjusted-close data is available.
I would put my rating as a sell because the stock already prices in a strong earnings ramp while the balance sheet still leaves little room for error. Talen has real contracted support from the AWS Susquehanna PPA and PJM capacity awards, but at $300 per share I think the market is paying ahead of the cleaner equity cash flow that would justify a higher rating.
The key strength is cash generation. The company’s 8.8% FCF yield shows that the fleet is producing solid cash, and that gives management some flexibility to fund growth and term out debt.
The key risk is leverage. Net debt/EBITDA is 16.1x and total debt/equity is 584.1%, so any slip in power spreads, financing costs, or acquisition timing can quickly pressure equity value. I would move higher only if net debt/EBITDA falls below 10.0x, meaning the debt load is moving toward a more manageable level and the contract base is translating into cleaner equity cash flow.
Company Profile
Talen Energy is an independent power producer and energy infrastructure company with a 13.1 GW U.S. generation fleet. It sells electricity, capacity, and ancillary services mainly into PJM wholesale markets, while the AWS contract on Susquehanna provides long-dated fixed-price demand for up to 1,920 MW through 2042.
The business is concentrated in the Mid-Atlantic, Ohio, Montana, and Indiana, and it includes 2.2 GW of nuclear capacity. The pending Cornerstone acquisition would add another 2.5 GW of natural gas generation through Waterford, Darby, and Lawrenceburg, which would deepen the company’s western PJM footprint and widen its merchant base.
Economic Moat
Business Model
The AWS contract on Susquehanna is the clearest structural advantage in the model because it turns 1,920 MW of carbon-free nuclear output into long-dated, fixed-price demand through 2042. In my view, that is hard for a competitor to replicate quickly because it combines a scarce nuclear asset, transmission access, and a large counterparty commitment.
That contract is not the only support. The 8,745 MW cleared in the 2027/2028 PJM Base Residual Auction at $333.44/MWd and the 2.0 GW reliability resource agreements at Brandon Shores and H.A. Wagner through May 31, 2029 both add contracted cash flow and reduce pure merchant exposure. The moat is therefore not a classic regulated utility moat, but I do think it is a real contracting and asset-positioning advantage.
Business & Operating Risks
The main disclosed risk is exposure to wholesale power prices and fuel spreads, because Talen’s energy margin moves with the relationship between electricity and natural gas prices. The filing also flags weather, PJM capacity-performance penalties, and nuclear regulatory oversight, all of which can interrupt output or force the company to buy power at unfavorable prices.
Those risks do not break the moat, but they do test it. The AWS contract and PJM awards protect part of the fleet, yet the remaining merchant generation still leaves Talen exposed to spread compression and operating volatility, so the structural advantage is real but not fully insulated.
Management Discussion & Analysis
Management is responding to those risks by extending maturities, adding contracted capacity, and leaning into larger-scale acquisitions rather than shrinking the business. The May 2026 credit amendment and the April 2026 notes issuance both pushed funding risk farther out, while the Cornerstone deal would add more contracted and dispatchable generation.
I read that as an active attempt to convert operating volatility into a more durable cash-flow base, but it also raises leverage. The strategy is coherent, yet it only helps if the new assets and contracts produce enough cash to offset the heavier capital stack.
Recent Events
The most important recent event is the May 20, 2026 credit agreement amendment, which repriced the term loan B tranches and the revolver while pushing the 846M term loan maturity from May 2030 to November 2032. That is constructive for the moat because it lowers near-term refinancing pressure and gives the company more time to monetize its contracted assets.
The April 17, 2026 senior notes issuance also matters. Talen locked in 1.5B of 2031 notes at 6.125% and 2.5B of 2033 notes at 6.375%, which tells me management is actively terming out the capital structure instead of relying on short-dated funding. I do not see any governance disruption in the annual meeting filing, so the recent events point to financing execution rather than strategic instability.
Financial Analysis
Growth
TLN — Financial Growth (Quarterly, USD Mil)
| Metric | 2025-03-31 | 2025-06-30 | 2025-09-30 | 2025-12-31 | 2026-03-31 | 2026-06-30 |
|---|---|---|---|---|---|---|
| REVENUE (USD Mil) | — | 454 | 770 | 771 | 1,241 | 959 |
| EBIT (USD Mil) | — | 159 | 371 | -281 | 200 | 85 |
| EBITDA (USD Mil) | — | 246 | 465 | -184 | 290 | 199 |
| NET INCOME (USD Mil) | — | 72 | 207 | -363 | 63 | -92 |
| DILUTED EPS | -2.9 | 1.5 | 4.2 | — | 1.3 | -2 |
Source: Yahoo Finance — Quarterly Financial Statements
Revenue was $1.2B in Q1 2026 and $959M in Q2 2026, so the top line is still volatile rather than steadily compounding. That pattern fits a merchant-heavy power business with contract support layered on top, and it means investors should focus more on spread capture and contract mix than on a smooth quarter-to-quarter revenue line.
EBITDA was $290M in Q1 2026 and $199M in Q2 2026, while net income swung from $63M to a $92M loss. I do not read that as a broken business; I read it as a reminder that earnings are still sensitive to power pricing and timing, which is exactly why the balance sheet matters so much.
Profitability
TLN — Profitability (TTM)
| Metric | TTM |
|---|---|
| Return on Assets (TTM) | 0.9% |
| Gross Margin (TTM) | 42.1% |
| EBITDA Margin (TTM) | 15.6% |
Source: Yahoo Finance — Trailing Twelve Months (TTM)
TTM operating margin was -4.8% and net margin was -4.9%, so the company is still below GAAP profitability. Gross margin of 42.1% shows the fleet can earn a healthy spread before overhead, but EBITDA margin of 15.6% tells me a large part of that spread is consumed below the gross line.
ROA was 0.9% and ROE was -12.8%, which is the clearest sign that equity holders are not yet seeing the benefit of the asset base. The gap between gross margin and net margin also ties back to the moat: the contracted assets help, but the business still needs more stable earnings conversion before the structural advantage shows up cleanly in returns.
Valuation
TLN — Valuation Multiples
| Metric | Value |
|---|---|
| Current Share Price (USD) | 300 |
| Market Cap (USD Mil) | 14,373 |
| Enterprise Value (USD Mil) | 23,738 |
| Forward P/E | 9.8 |
| Price/Sales (TTM) | 3.8 |
| Price/Book (mrq) | 8.9 |
| EV/Revenue | 6.3 |
| EV/EBITDA | 40.8 |
| Beta (5Y Monthly) | 1.63 |
| FCF Yield % (TTM) | 8.8% |
| Forward EPS (USD) | 30.8 |
| Analyst Target Price – Low (USD) | 307 |
| Analyst Target Price – Mean (USD) | 460.6 |
| # Analyst Opinions | 17 |
Source: Yahoo Finance
At $300 per share, Talen trades at 40.8x EV/EBITDA, 6.3x EV/revenue, 3.8x price/sales, and 8.9x price/book. That is not a cheap setup for a business with negative trailing net margin, even though the 8.8% FCF yield gives the stock some cash support.
Using the peer EV/revenue range in the comparable set, I would put fair value roughly in the low-to-mid $300s on the current earnings base, with upside only if the contract ramp converts into cleaner margins and lower leverage. That sits below the $460.6 analyst mean target and well above the $307 low, so my view is more cautious than consensus because I weight the debt load more heavily than the sell-side appears to. Forward EPS is 30.8, which is rich versus most peers on an absolute basis, but I think that earnings power is already being discounted by the market through the high EV/EBITDA multiple and the leverage profile.
Leverage
TLN — Leverage & Coverage (Quarterly)
| Metric | Value |
|---|---|
| Total Debt/Equity % (mrq) | 584.1 |
| Current Ratio (mrq) | 0.8 |
| Net Debt/EBITDA (TTM) | 16.1 |
| FCF Margin % (TTM) | 33.7% |
Source: Yahoo Finance — Quarterly Financial Statements
Leverage is the central issue. Total debt/equity was 584.1%, total debt was $9.6B, and net debt/EBITDA was 16.1x, which leaves very little room for execution error if power spreads soften or acquisition funding slips.
The current ratio was 0.8, so near-term liquidity is not generous even though operating cash flow was $796M and levered free cash flow was $1.3B TTM. I like the cash generation, but I do not think it offsets the capital structure risk yet; the company is still using cash to support a heavy debt stack rather than to create balance-sheet flexibility.
Insider Activity
The insider record is one-sided: Mark Allen McFarland bought shares three times on open market and did not sell. That is supportive, but the signal is narrow because it comes from one insider rather than broad-based buying across the leadership team.
I view that as a modest positive, not a thesis driver. It tells me management is willing to buy stock, but it does not change the fact that leverage and valuation remain the bigger issues for outside investors.
Comparable Analysis
Growth
| Company | Revenue TTM (USD Mil) | Revenue Growth YoY % | EBITDA TTM (USD Mil) | Diluted EPS TTM |
|---|---|---|---|---|
| TLN | 3,741 | 111.2% | 582 | -4 |
| NRG | 33,125 | 11.0% | 3,253 | 3.8 |
| VST | 19,212 | -5.5% | 6,646 | 5.9 |
| CEG | 31,270 | 23.0% | 7,952 | 10.2 |
| AES | 13,054 | 19.9% | 4,070 | 2.7 |
| CWEN | 1,574 | 22.7% | 1,168 | 0.9 |
Source: Yahoo Finance
TLN’s revenue growth was 111.2% TTM, far above NRG at 11.0%, VST at -5.5%, CEG at 23.0%, AES at 19.9%, and CWEN at 22.7%. That is a strong headline number, but I do not think it deserves a premium on its own because much of the growth reflects portfolio reshaping and acquisitions rather than a clean organic comp.
Valuation
| Company | Current Share Price (USD) | Trailing P/E | Forward P/E | EV/Revenue | EV/EBITDA | Price/Sales (TTM) | Price/Book (mrq) | Beta (5Y Monthly) | FCF Yield % (TTM) | Forward EPS | Analyst Target Price – Low | Analyst Target Price – Mean | Analyst Target Price – High | # Analyst Opinions |
|---|---|---|---|---|---|---|---|---|---|---|---|---|---|---|
| TLN | 300 | — | 9.8 | 6.3 | 40.8 | 3.8 | 8.9 | 1.63 | 8.8% | 30.8 | 307 | 460.6 | 560 | 17 |
| NRG | 103.3 | 26.9 | 9.2 | 1.4 | 14 | 0.7 | 5.2 | 1.17 | 3.6% | 11.2 | 104 | 188.6 | 270 | 16 |
| VST | 140.8 | 23.7 | 13.6 | 3.6 | 10.5 | 2.5 | 15.7 | 1.41 | 0.1% | 10.4 | 106 | 217.6 | 305 | 19 |
| CEG | 262.1 | 25.6 | 19.7 | 3.7 | 14.7 | 3 | 2.9 | 1.12 | -7.1% | 13.3 | 290 | 348.6 | 441 | 20 |
| AES | 14.8 | 5.6 | 6.3 | 3.8 | 12.2 | 0.8 | 2.1 | 0.95 | -29.2% | 2.4 | 15 | 15 | 15 | 8 |
| CWEN | 30.9 | 35.9 | 18.9 | 10.9 | 14.6 | 4.8 | 2 | 0.88 | 5.5% | 1.6 | 32 | 41.8 | 58 | 13 |
Source: Yahoo Finance
TLN trades at 6.34x EV/revenue and 40.79x EV/EBITDA, versus NRG at 1.4x and 14.0x, VST at 3.6x and 10.5x, CEG at 3.7x and 14.7x, AES at 3.8x and 12.2x, and CWEN at 10.9x and 14.6x. CWEN is richer on EV/revenue, but TLN’s 8.8% FCF yield is better than CWEN’s 5.5%, so the market is paying for TLN’s cash generation even as it discounts the balance sheet.
On a peer-multiple basis, the implied value range is wide enough that I would not anchor too hard to any single peer. What matters more to me is that TLN’s leverage is much heavier than the group, so I think the stock deserves a discount to the richer growth names until the debt load comes down.
Profitability
| Company | Operating Margin (TTM) | Net Margin (TTM) | Return on Assets (TTM) | Return on Equity (TTM) | Gross Margin (TTM) | EBITDA Margin (TTM) |
|---|---|---|---|---|---|---|
| TLN | -4.8% | -4.9% | 0.9% | -12.8% | 42.1% | 15.6% |
| NRG | 12.8% | 2.6% | 4.1% | 23.8% | 18.8% | 9.8% |
| VST | 13.8% | 11.6% | 5.9% | 43.0% | 38.3% | 34.6% |
| CEG | 8.7% | 11.1% | 3.9% | 15.1% | 22.1% | 25.4% |
| AES | 18.7% | 14.3% | 3.0% | 9.6% | 20.3% | 31.2% |
| CWEN | 25.2% | 6.4% | 1.0% | -3.2% | 64.4% | 74.2% |
Source: Yahoo Finance
TLN’s gross margin of 42.1% and EBITDA margin of 15.6% are respectable, but they trail VST’s 38.3% and 34.6% only on EBITDA and are well below CWEN’s 64.4% and 74.2%. The problem is that TLN’s operating margin is -4.8% and net margin is -4.9%, while NRG at 12.8% and 2.6% and VST at 13.8% and 11.6% remain positive.
That tells me the issue is not just generation economics; it is also financing and overhead. ROE at -12.8% reinforces that point, because the capital structure is not yet turning the asset base into shareholder returns.
Leverage
| Company | Total Debt/Equity % (mrq) | Current Ratio (mrq) | Operating Cash Flow TTM (USD Mil) | Net Debt/EBITDA (TTM) | FCF Margin % (TTM) |
|---|---|---|---|---|---|
| TLN | 584.1 | 0.8 | 796 | 16.1 | 33.7% |
| NRG | 483.4 | 1 | 1,555 | 7.2 | 2.3% |
| VST | 373.3 | 1 | 5,121 | 3 | 0.2% |
| CEG | 76.4 | 1.5 | 4,206 | 3 | -21.2% |
| AES | 256.9 | 0.7 | 5,032 | 7.6 | -23.7% |
| CWEN | 176.9 | 1.2 | 1,017 | 8.2 | 26.8% |
Source: Yahoo Finance
TLN’s debt/equity ratio of 584.1% and net debt/EBITDA of 16.1x are the highest-pressure figures in the peer set. NRG is at 7.2x net debt/EBITDA, VST at 3.0x, CEG at 3.0x, AES at 7.6x, and CWEN at 8.2x, so TLN is clearly the most levered name in the group.
That matters for valuation because the market is not just pricing the business; it is pricing the financing risk around it. In my view, TLN’s stronger FCF margin does not fully offset that gap yet, so the peer comparison still points to a stock that is expensive for the amount of balance-sheet risk it carries.
Conclusion
I would put my rating as a sell because the stock’s earnings visibility is real, but the leverage is still too high for me to underwrite the current valuation. The AWS contract, PJM awards, and recent financing actions all help, yet they have not yet translated into a balance sheet that gives equity holders enough margin of safety.
The bull case is straightforward: if the contracted cash flow keeps ramping and the company uses it to reduce net debt/EBITDA, I would become more constructive. The key threshold I am watching is net debt/EBITDA below 10.0x, because that would mean the debt burden is moving toward a level where the equity can compound without being dominated by refinancing risk. I would also want to see operating margin turn positive and stay there for two quarters, which would show that the contract base is finally converting into durable earnings rather than just supporting the capital structure.
The bear case is just as clear. If leverage stays above 15.0x after the next financing step, or if the current ratio remains below 1.0 while power spreads soften, I would expect the equity to keep trading like a financing-sensitive asset rather than a clean cash compounder. A $100M drop in EBITDA would also matter because it would push net debt/EBITDA higher and make the stock more exposed to any PJM or fuel shock.
I think the bear case is the more immediate one because the debt load is already high and the valuation is already asking investors to pay for a lot of improvement. Until the company proves that the contract ramp is reducing leverage rather than merely funding it, I would stay at sell.
What to Watch Next
- Net debt/EBITDA below 10.0x — would support a higher rating.
- Operating margin turning positive for two quarters — would show earnings are becoming durable.
- Current ratio back above 1.0 — would ease near-term liquidity pressure.
- EBITDA up by $100M or more — would materially improve leverage math.
- Contracted cash flow ramping without new debt — would strengthen the equity case.
What’s your take? I rated Talen Energy (TLN) SELL above — but the goal here is to get this right, not just to publish an opinion. What would you add to this analysis, or which risk or catalyst do you think I’m under- or over-weighting? Tell me in the comments.
Sources
- SEC 10-K Annual Report — filed 2026-02-26
- SEC 8-K Filing (2026-05-21)
- SEC 8-K Filing (2026-05-07)
- SEC 8-K Filing (2026-05-05)
- SEC 8-K Filing (2026-04-17)
- SEC 8-K Filing (2026-02-26)
- SEC 8-K Filing (2026-01-15)
- SEC Form 4 Insider Transaction (2026-06-08)
- SEC Form 4 Insider Transaction (2026-05-27)
- SEC Form 4 Insider Transaction (2026-05-27)
- SEC 10-K Annual Report — FY2026
- SEC 10-K Annual Report — FY2025
Data sourced from Yahoo Finance and SEC EDGAR. Not investment advice.
Leave a Comment