
| Company | Aug 25 | Sep 25 | Oct 25 | Nov 25 | Dec 25 | Jan 26 | Feb 26 | Mar 26 | Apr 26 | May 26 | Jun 26 | Jul 26 | 12-Mo |
|---|---|---|---|---|---|---|---|---|---|---|---|---|---|
| NUTX | -1% | +23% | +19% | -6% | +43% | -10% | -26% | -14% | +25% | +8% | +32% | -14% | +74% |
| TEM | +34% | +6% | +11% | -13% | -24% | +1% | -11% | -15% | +23% | -9% | +15% | -24% | -22% |
| TDOC | +7% | +0% | +12% | -12% | -8% | -22% | -3% | +4% | +11% | +26% | +11% | -21% | -7% |
| AMWL | -6% | -11% | -15% | -19% | +16% | -7% | +25% | -8% | +20% | +56% | -7% | +18% | +46% |
| LFMD | -41% | +10% | -13% | -35% | -11% | -5% | -18% | +35% | +30% | -9% | -4% | -15% | -66% |
| HIMS | -36% | +34% | -20% | -13% | -18% | -17% | -46% | +43% | +31% | -4% | +33% | -20% | -58% |
Source: Yahoo Finance monthly adjusted close.
Executive Summary
Rating: BUY | NUTX
Measured from adjusted close on 2026-08-17 to 2026-10-01. Sell ratings are correct when the stock falls; Hold is tracked as a +/-10% range. Daily-close data, not intraday. Calls are tracked for 182 days from publication, then frozen as a final record.
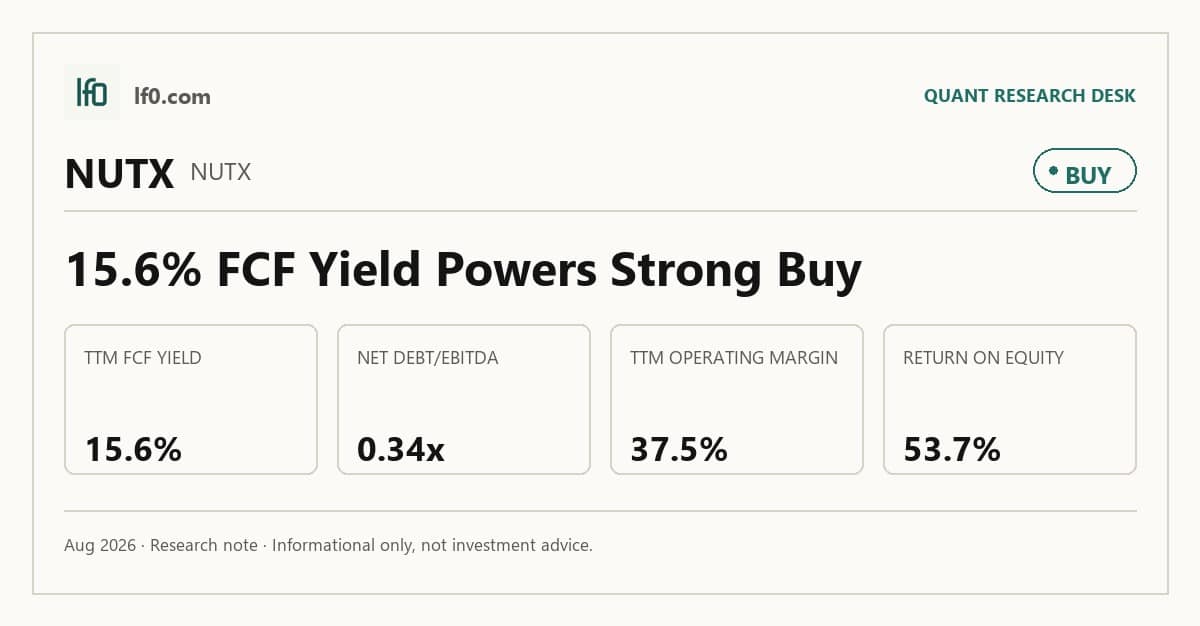
I would put my rating as a Buy because Nutex Health is already converting revenue into cash at a level the peer set has not matched, with a 15.6% free cash flow yield and 19.2% free cash flow margin on TTM figures. That cash generation is the clearest strength in this Nutex Health stock analysis, and it matters because the company is not relying on distant profitability to justify the share price. The main risk is the reimbursement engine: 49.7M of accrued arbitration expenses at December 31, 2025 and 50% to 60% of medical claims routed through Independent Dispute Resolution (IDR) in 2025 leave earnings exposed to a contested process. I would raise my rating more towards a Strong Buy if Q2 2026 cash conversion keeps FCF margin near 19% while arbitration costs stop rising.
Company Profile
Nutex Health Inc. is a physician-led healthcare services company with three operating pieces: a hospital business, a population health management platform, and a real estate segment. Its hospital division operated 26 facilities across 12 states as of December 31, 2025, while the population health management business ran independent physician associations and management services organizations that collect capitated and management fees under managed-care contracts. The company was incorporated in Delaware on April 13, 2000 and is listed on Nasdaq under NUTX.
The hospital platform centers on micro hospitals, specialty hospitals, and hospital outpatient departments, with 9 additional de novo micro hospitals under development as of December 31, 2025. Nutex also owns its Houston headquarters building, purchased in December 2025, and holds a 51% interest in one Indiana micro hospital facility.
Economic Moat
Business Model
The physician-partner ownership structure around each hospital is the hardest element to replicate within 3 years, in my view, because Nutex ties the facility, the physician entity, and the real estate entity together through local ownership and long-term leases. I feel that a competitor could copy a micro-hospital building, but not quickly rebuild the same in-market physician relationships, co-investment structure, and back-office integration across 26 hospital facilities in 12 states as of December 31, 2025. A secondary advantage is the No Surprises Act arbitration workflow, where Nutex uses HaloMD, a third-party expert in independent dispute resolution, to navigate federal and state claims submission; that is operationally useful, but it is more of a process edge than a durable moat.
In 2023, Nutex had 19 hospital facilities in 8 states and partnered with over 800 physicians, while prior filings showed a smaller and less integrated platform before the April 1, 2022 merger of Nutex Health Holdco LLC and Clinigence Holdings, Inc. The business then expanded through de novo openings and network buildout, reaching 24 hospital facilities in 11 states in 2025 and 26 facilities in 12 states by December 31, 2025, alongside four IPAs and about 38,000 members across the population health platform. That larger footprint is consistent with the fulfillment and physician-network advantage described above, but it also makes the model more dependent on reimbursement execution and local operating discipline.
Business & Operating Risks
The No Surprises Act arbitration process is the main risk because it directly hits cash collections. According to the risk factors in their SEC 10-K, regulatory and litigation uncertainty under the No Surprises Act may reduce cash collections and increase dispute costs, and any significant change to the federal arbitration process could reduce the claim amounts Nutex recovers in the future. That is not abstract: federal agencies extended enforcement relief for services furnished before February 1, 2026, with additional relief potentially running until August 1, 2026, while the Qualified Payment Amount can still be calculated using older 2021 and 2023 methods that can produce low reimbursement levels.
HaloMD is the second pressure point. Nutex says its third-party arbitration provider has been, and may in the future be, subject to lawsuits filed by health insurance providers, and that HaloMD handled approximately 50% to 60% of the company’s medical claims through the Independent Dispute Resolution process in 2025. That concentration means any adverse ruling, delay, or reputational hit at HaloMD can flow straight into Nutex’s revenue and valuation. The earn-out dilution is also specific: Nutex estimates that for seven hospitals the formula could produce about 1.4M shares, or 19.2% of shares outstanding as of December 31, 2025, with another 88,500 shares, or 1.2%, tied to three more hospitals by December 31, 2026. The broader legal stack includes August 2025 class action litigation, September 2025 derivative suits, and prior material weaknesses in internal control over financial reporting that were remediated as of December 31, 2025.
These risks do not break the moat itself, but they do threaten the cash-conversion advantage that the physician-partner model is supposed to create.
Management Discussion & Analysis
Management is still leaning into growth rather than balance-sheet repair, and that tells me the company believes the operating model can absorb the risk stack above. It plans to open three new hospital facilities by the end of 2026 and launch one to three additional IPAs per year, while also working to replace smaller lines of credit with larger financing commitments.
The 2025 operating update was tied to higher rates obtained through IDR and more observation and in-patient stays, which helped hospital revenue rise to $844.2M from $449.1M in 2024. That growth is real, but it came with $49.7M of accrued arbitration expenses at December 31, 2025, so the revenue lift was not free. Management also spent $2.3M on a 51% membership interest in the May 2025 Acquiree, $2.2M on land and an office building in December 2025, and $5M on stock repurchases and retirements in 2025. In my view, that is an aggressive capital-allocation posture, not a defensive one.
The key point is that management is responding to the risks with more scale, more financing access, and more reliance on the arbitration engine rather than with retrenchment. That makes sense if the model works, but it also means execution has to stay clean.
Recent Events
The most important recent development was the March 5, 2026 earnings release, followed by the April 30, 2026 first-quarter release. Those 8-Ks are routine Item 2.02 filings, so they do not add a new strategic catalyst, but they confirm that Nutex is still operating on the same earnings cadence and that the near-term thesis remains tied to execution rather than a structural change.
The only non-earnings event was the April 23, 2026 annual meeting, where all seven director nominees were elected and the named executive compensation package was approved on an advisory basis. That outcome preserves continuity in governance rather than changing the investment case, because there is no sign of a board reset, activist pressure, or leadership disruption that would alter the company’s operating direction.
Taken together, the recent 8-Ks leave the investment case materially unchanged.
Financial Analysis
Growth
NUTX — Financial Growth (Quarterly, USD Mil)
| Metric | 2024-12-31 | 2025-03-31 | 2025-06-30 | 2025-09-30 | 2025-12-31 | 2026-03-31 |
|---|---|---|---|---|---|---|
| REVENUE (USD Mil) | — | 211.8 | 244 | 267.8 | 151.7 | 216.5 |
| EBIT (USD Mil) | — | 77.3 | 29.4 | 129.4 | 30.9 | 81.2 |
| EBITDA (USD Mil) | — | 82.4 | 34.7 | 134.4 | 36.1 | 86.7 |
| NET INCOME (USD Mil) | — | 21.2 | -17.7 | 55.4 | 11.8 | 46.8 |
| DILUTED EPS | 11.1 | 3.3 | -3 | 7.8 | — | 6.5 |
Source: Yahoo Finance — Quarterly Financial Statements
Revenue stepped up from 211.8M in Q1 2025 to 244M in Q2 2025 and 267.8M in Q3 2025, before dropping to 151.7M in Q4 2025 and rebounding to 216.5M in Q1 2026. That is a 2.2% increase versus Q1 2025, but the path is choppy, so I would not extrapolate the Q3 run rate. The Q4 reset looks more like timing noise around arbitration and case mix than a demand collapse, which matters because this business is driven as much by reimbursement timing as by patient volume.
EBITDA moved faster than revenue in Q3 2025, reaching $134M on $267.8M of sales, while Q1 2026 EBITDA of $86.7M still supported a solid margin profile. That combination tells me the company can convert volume into earnings, but the quarter-to-quarter swing also shows why the valuation has to be anchored to cash generation rather than a single run-rate quarter. The revenue pattern is consistent with the moat discussion above: the network can scale, but the reimbursement engine remains the swing factor.
Profitability
NUTX — Profitability (TTM)
| Metric | TTM |
|---|---|
| Operating Margin (TTM) | 37.5% |
| Net Margin (TTM) | 11.0% |
| Return on Assets (TTM) | 28.6% |
| Return on Equity (TTM) | 53.6% |
| Gross Margin (TTM) | 50.6% |
| EBITDA Margin (TTM) | 47.1% |
Source: Yahoo Finance — Trailing Twelve Months (TTM)
TTM operating margin was 37.5%, gross margin was 50.6%, and EBITDA margin was 47.1%, so the business is still keeping more than half of revenue after direct costs and nearly half after operating cash earnings. The 13.1-point gap between gross and operating margin points to meaningful overhead and clinical infrastructure costs, which means investors should watch operating leverage rather than gross pricing power for the next step up. Net margin was 11%, far below EBITDA margin, so depreciation, amortisation, and other below-EBITDA charges are still taking a large slice of profit.
ROA was 28.6% and ROE was 53.6%, and that wide gap suggests returns are being amplified by leverage rather than pure asset productivity. I view that as a strength only because the company is still producing strong cash flow; if cash conversion weakened, the same leverage would work against equity holders. The profile is profitable and still moving toward stronger earnings quality, but the key test is whether operating margin can stay above 35% and net margin can keep closing the gap to EBITDA margin.
Valuation
NUTX — Valuation Multiples
| Metric | Value |
|---|---|
| Market Cap (USD Mil) | 1,082 |
| Enterprise Value (USD Mil) | 1,290 |
| Trailing P/E | 11.5 |
| Forward P/E | 7.7 |
| Price/Sales (TTM) | 1.2 |
| Price/Book (mrq) | 3.2 |
| EV/Revenue | 1.5 |
| EV/EBITDA | 3.1 |
| Beta (5Y Monthly) | 1.99 |
| FCF Yield % (TTM) | 15.6% |
| Forward EPS (USD) | 20.3 |
| Analyst Target Price – Low (USD) | 175 |
| Analyst Target Price – Mean (USD) | 246.4 |
| Analyst Target Price – High (USD) | 300 |
| # Analyst Opinions | 5 |
Source: Yahoo Finance
Nutex trades at 1.5x EV/revenue and 1.2x price to sales on TTM figures, with 3.1x EV/EBITDA and 11.5x trailing P/E. On my read, that is a modest multiple for a business with 19.2% FCF margin and 15.6% FCF yield, but it is not a deep discount once you factor in the arbitration and dilution overhangs. The market is paying for cash conversion, not for a clean risk profile.
I would put fair value in a range of $175–$300 per share, which is broadly in line with the analyst target range of $175 to $300 and a $246 mean across 5 opinions. That tells me the Street is already giving credit for the current earnings base, so upside now depends on whether the company can keep converting revenue into cash without a step-up in dispute costs. Forward EPS is 20.3, and that is rich relative to peers on a cash-flow-adjusted basis because NUTX is already profitable while several comparables still post negative earnings.
The rating justification is the same basic point: 15.6% FCF yield and 0.342x net debt/EBITDA support upside, and 37.5% operating margin plus 53.6% ROE show the earnings base is already working. I do not need a lower multiple to make the case; I need the current cash conversion to hold.
Leverage
NUTX — Leverage & Coverage (Quarterly)
| Metric | Value |
|---|---|
| Total Debt/Equity % (mrq) | 79 |
| Current Ratio (mrq) | 3.1 |
| Total Debt (mrq, USD Mil) | 349.1 |
| Operating Cash Flow (TTM, USD Mil) | 272.7 |
| Levered Free Cash Flow (TTM, USD Mil) | 168.8 |
| Net Debt/EBITDA (TTM) | 0.3 |
| FCF Margin % (TTM) | 19.2% |
Source: Yahoo Finance — Quarterly Financial Statements
Nutex has 349.1M of total debt against a current ratio of 3.143x and total debt/equity of 78.97%, so the balance sheet is levered but not stretched. TTM operating cash flow was 272.7M and levered free cash flow was 168.8M, which shows solid cash conversion even after interest and capital spending. Net debt/EBITDA of 0.342x is low, and FCF margin of 19.18% is healthy, so EBITDA is turning into cash rather than being absorbed by the balance sheet.
Total cash was 207.3M, which gives near-term liquidity cushion and reduces refinancing pressure. I would still watch the company’s credit headroom closely, because the operating model depends on arbitration timing and the cash balance is not large enough to absorb a prolonged disruption without consequences. In my view, leverage is manageable and cash generation is strong, but the balance sheet only stays supportive if the reimbursement engine keeps working.
Insider Activity
The insider transaction record I see here is entirely open-market buying, with 5 purchases and 0 sales in the 2025-01-08 to 2026-06-04 window. The activity is broad rather than concentrated, since multiple insiders bought shares, although the sample is limited to 32 filings and the open-market buys total only $127,515. I read that as a modest positive signal, not a thesis driver.
Comparable Analysis
Growth
| Company | Revenue TTM (USD Mil) | Revenue Growth YoY % | EBITDA TTM (USD Mil) | Diluted EPS TTM |
|---|---|---|---|---|
| NUTX | 880 | 2.2% | 414.2 | 13.7 |
| TEM | 1,432 | 21.6% | -202.4 | -1.4 |
| TDOC | 2,489.5 | -4.0% | 64.6 | -1 |
| AMWL | 237.4 | -17.9% | -46.3 | -5.4 |
| LFMD | 193.3 | -1.4% | -14.3 | -0.4 |
| HIMS | 2,369.7 | 3.8% | 83.4 | -0.1 |
Source: Yahoo Finance
NUTX’s revenue growth of 2.2% TTM trails TEM at 21.6% and HIMS at 3.8%, but it beats TDOC at -4.0%, AMWL at -17.9%, and LFMD at -1.4%. That puts NUTX in the middle of the group on top line, so the market is not paying for category-leading growth, but it is also not pricing it like a shrinking name. TEM’s faster growth comes with negative EBITDA and negative EPS, which is why I do not think the raw growth gap should be read as a valuation advantage by itself.
Valuation
| Company | Trailing P/E | Forward P/E | EV/Revenue | EV/EBITDA | Price/Sales (TTM) | Price/Book (mrq) | Market Cap (USD Mil) | Enterprise Value (USD Mil) | Beta (5Y Monthly) | FCF Yield % (TTM) | Forward EPS | Analyst Target Price – Low | Analyst Target Price – Mean | Analyst Target Price – High | # Analyst Opinions |
|---|---|---|---|---|---|---|---|---|---|---|---|---|---|---|---|
| NUTX | 11.5 | 7.7 | 1.5 | 3.1 | 1.2 | 3.2 | 1,082 | 1,290 | 1.99 | 15.6% | 20.3 | 175 | 246.4 | 300 | 5 |
| TEM | — | -1,885.3 | 6.2 | -44.2 | 5.9 | 18.9 | 8,426 | 8,937 | 3.58 | -1.2% | 0 | 35 | 62.8 | 100 | 14 |
| TDOC | — | -8.8 | 0.6 | 22.9 | 0.5 | 1 | 1,259 | 1,476 | 2.13 | 15.2% | -0.8 | 5.5 | 7.8 | 10.5 | 19 |
| AMWL | — | -7.8 | 0.1 | -0.4 | 0.9 | 1 | 218 | 17 | 1.70 | -5.4% | -1.7 | 6.5 | 10.2 | 16 | 5 |
| LFMD | — | 7.1 | 0.8 | -10.6 | 0.9 | 11.6 | 178 | 152 | 2.06 | -2.3% | 0.5 | 8 | 9.9 | 15 | 8 |
| HIMS | — | 24.3 | 3.2 | 90.1 | 3.1 | 16.4 | 7,326 | 7,515 | 2.42 | 2.4% | 1.3 | 21 | 29.2 | 40 | 13 |
Source: Yahoo Finance
NUTX’s FCF yield is 15.6% TTM, ahead of TDOC at 15.2% and far above HIMS at 2.4% and TEM at -1.2%, which means the stock is backed by real cash generation rather than just a low headline multiple. On EV/revenue, NUTX trades at 1.5x versus TDOC at 0.6x, AMWL at 0.1x, LFMD at 0.8x, HIMS at 3.2x, and TEM at 6.2x; that places NUTX below the richer growth names but above the distressed ones. A $1 investment one year ago would be worth $1.78 in NUTX, versus $1.48 in AMWL, $0.96 in TDOC, $0.82 in TEM, $0.51 in HIMS, and $0.34 in LFMD, so the market has rewarded NUTX’s cash generation and profitability. I think that relative performance is justified because NUTX’s 63.4% 1-year return lines up with a 15.6% FCF yield and 53.6% ROE, but the stock still trades like a volatile cash compounder rather than a steady rerating story.
Profitability
| Company | Operating Margin (TTM) | Net Margin (TTM) | Return on Assets (TTM) | Return on Equity (TTM) | Gross Margin (TTM) | EBITDA Margin (TTM) |
|---|---|---|---|---|---|---|
| NUTX | 37.5% | 11.0% | 28.6% | 53.6% | 50.6% | 47.1% |
| TEM | -19.8% | -17.8% | -8.8% | -67.4% | 64.0% | -14.1% |
| TDOC | -5.7% | -7.1% | -3.2% | -13.0% | 69.0% | 2.6% |
| AMWL | -23.6% | -37.0% | -13.4% | -31.8% | 53.8% | -19.5% |
| LFMD | -17.8% | 2.9% | -13.4% | -238.5% | 86.8% | -7.4% |
| HIMS | -7.9% | -0.6% | 0.6% | -2.7% | 72.9% | 3.5% |
Source: Yahoo Finance
Operating margin of 37.5% and EBITDA margin of 47.1% are well ahead of HIMS at -7.9% and 3.5%, TDOC at -5.7% and 2.6%, AMWL at -23.6% and -19.5%, and LFMD at -17.8% and -7.4%. The gap is structural, not cyclical, because NUTX is already converting revenue into operating profit while the peers are still absorbing scale costs. Gross margin of 50.6% is lower than HIMS at 72.9% and TDOC at 69.0%, which points to a cost-of-revenue difference, but NUTX’s much wider operating-margin lead says the real advantage is better opex control and a more mature earnings base.
Leverage
| Company | Total Debt/Equity % (mrq) | Current Ratio (mrq) | Total Debt (mrq, USD Mil) | Operating Cash Flow TTM (USD Mil) | Free Cash Flow TTM (USD Mil) | Net Debt/EBITDA (TTM) | FCF Margin % (TTM) |
|---|---|---|---|---|---|---|---|
| NUTX | 79 | 3.1 | 349.1 | 272.7 | 168.8 | 0.3 | 19.2% |
| TEM | 324.6 | 3.3 | 1,444.2 | -237.4 | -99.1 | -3.1 | -6.9% |
| TDOC | 79.1 | 0.8 | 1,036.2 | 261.2 | 191 | 4.1 | 7.7% |
| AMWL | 1.6 | 3.1 | 4 | -41.8 | -11.8 | 3.8 | -5.0% |
| LFMD | 41.1 | 1 | 6.2 | 8.1 | -4.2 | 2 | -2.1% |
| HIMS | 253.7 | 1.7 | 1,132 | 280.3 | 174.3 | 4.6 | 7.4% |
Source: Yahoo Finance
NUTX’s net debt/EBITDA is 0.342x and FCF margin is 19.18%, versus TDOC at 4.1x and 7.7%, HIMS at 4.6x and 7.4%, AMWL at 3.8x and -5.0%, and LFMD at 2.0x and -2.1%; that means NUTX is funding growth from internally generated cash, while several peers are still relying on a more stretched capital structure. Raw debt/equity of 79.0% is not trivial, but the net debt figure shows the balance sheet is far cleaner than the headline ratio suggests. That lower leverage also helps explain why NUTX can trade at a better cash-flow multiple than the loss-making peers without needing a much higher revenue growth rate.
Conclusion
I would put my rating as a Buy because the core question is whether Nutex’s reimbursement risk is already overwhelming the cash engine, and the numbers say it is not. The company is still producing 15.6% FCF yield, 19.2% FCF margin, and 37.5% operating margin, so the earnings base is real rather than aspirational. At the same time, the risk stack is unusually specific: 50% to 60% of claims routed through IDR, $49.7M of accrued arbitration expenses, and a dilution overhang tied to earn-outs and stock-based compensation.
I would raise my rating more towards a Strong Buy if the company can keep operating margin above 35% for the next two quarters, because that would confirm the current earnings base is not just a one-quarter spike from arbitration timing. If revenue also stays above $200M in each of those quarters, roughly the latest run rate, then annualised cash generation should remain strong enough to keep net debt/EBITDA near 0.3x and support expansion without stressing liquidity. That would tell me the moat is still translating into cash, not just into reported revenue.
I would move from Buy to Hold if free cash flow margin slips below 10%, because that would show the cash conversion advantage is fading even if reported EBITDA still looks healthy. A second bear trigger would be a sharp drop in the 15.6% FCF yield toward the high single digits, which would imply the market is no longer paying for cash generation but for a much less certain earnings path.
Weighing both cases, I think the bull case is more likely to show up first because the current balance sheet and cash flow profile give Nutex room to absorb volatility while the operating margin remains well above the peer group. The stock is still volatile, but the business is already earning its way through that volatility, and I would watch for any break in cash conversion before changing that view.
What’s your take? I rated Nutex Health (NUTX) BUY above — but the goal here is to get this right, not just to publish an opinion. What would you add to this analysis, or which risk or catalyst do you think I’m under- or over-weighting? Tell me in the comments.
Sources
- SEC 10-K Annual Report — filed 2026-03-05
- SEC 8-K Filing (2026-04-30)
- SEC 8-K Filing (2026-04-23)
- SEC 8-K Filing (2026-03-05)
- SEC Form 4 Insider Transaction (2026-06-04)
- SEC Form 4 Insider Transaction (2026-05-29)
- SEC Form 4 Insider Transaction (2026-04-24)
- SEC 10-K Annual Report — FY2026
- SEC 10-K Annual Report — FY2025
- SEC 10-K Annual Report — FY2024
- SEC 10-K Annual Report — FY2023
Data sourced from Yahoo Finance and SEC EDGAR. Not investment advice.
Leave a Comment