
| Company | Sep 25 | Oct 25 | Nov 25 | Dec 25 | Jan 26 | Feb 26 | Mar 26 | Apr 26 | May 26 | Jun 26 | Jul 26 | Aug 26 | 12-Mo |
|---|---|---|---|---|---|---|---|---|---|---|---|---|---|
| CAR | +1% | -15% | -0% | -6% | -10% | -15% | +50% | +24% | -3% | -16% | -7% | +7% | -7% |
| UBER | +5% | -2% | -9% | -7% | -2% | -6% | -5% | +4% | -6% | +3% | -2% | +8% | -19% |
| LYFT | +36% | -7% | +3% | -8% | -13% | -18% | -4% | +6% | -0% | +4% | +9% | +7% | +4% |
| R | +1% | -10% | +3% | +10% | -0% | +16% | -8% | +24% | -1% | +5% | -3% | -4% | +33% |
| HTZ | +19% | -25% | +2% | -2% | -5% | -7% | +2% | +38% | -15% | -58% | -30% | +43% | -60% |
| UHAL | -1% | -7% | -1% | -4% | +12% | -10% | -6% | +7% | +13% | +13% | +8% | -5% | +17% |
Source: Yahoo Finance monthly adjusted close.
Quick Thesis
- Rated buy because cash flow and margins still support a higher equity value.
- Strongest point: 7.2B of TTM levered free cash flow.
- Biggest risk: 29.1B of debt and 18.6x net debt/EBITDA.
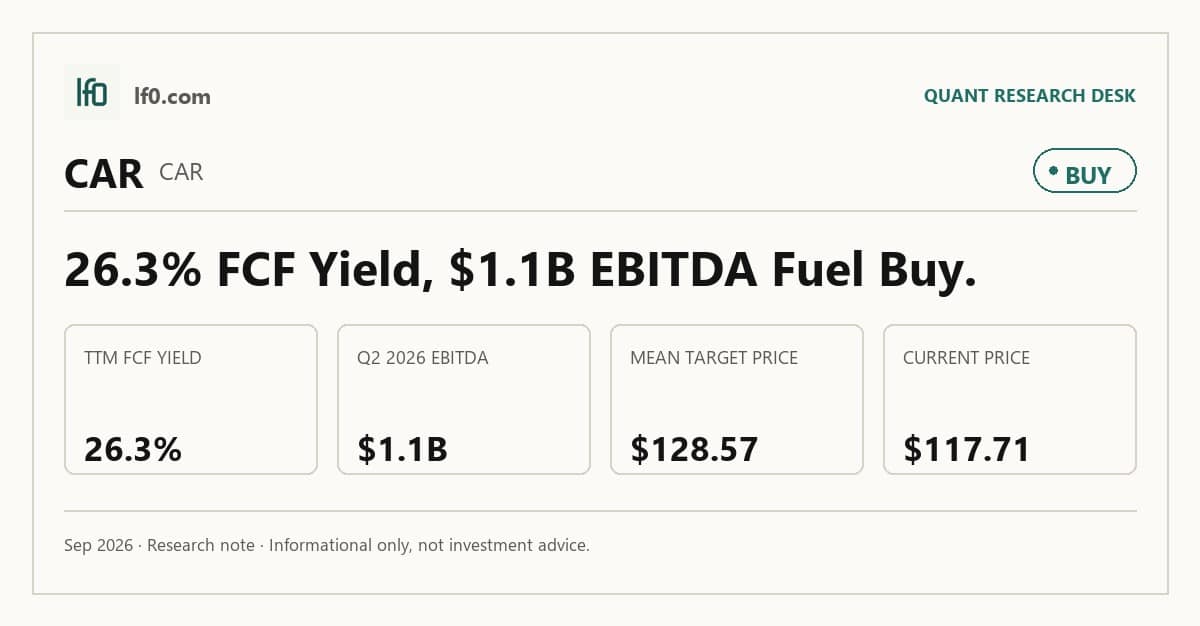
- Valuation is mixed: 21.4x EV/EBITDA, but 26.3% FCF yield.
- I would raise my rating if free cash flow stays above 7B for two quarters.
Performance Since Our Last Call
I last rated the stock sell on 2026-06-21, and the shares have fallen 36.8% since then, which is a correct call so far. The move is consistent with the fresh evidence in this article: cash generation remains strong, but leverage is still high enough that the market is not willing to pay up for the equity. That said, the latest quarter and financing actions show the business is not in distress, so the prior call looks right on price action but not because the operating picture has broken down. My updated view below reflects that tension.
Executive Summary
Rating: BUY | CAR
Measured from adjusted close on 2026-06-22 to 2026-09-18. Sell ratings are correct when the stock falls; Hold is tracked as a +/-10% range. Daily-close data, not intraday. Calls are tracked for 182 days from publication, then frozen as a final record.
I would put my rating as a buy because the company is still generating enough cash to support debt service, fleet funding, and equity value, even though leverage keeps the stock from looking cheap on a clean balance-sheet basis. TTM levered free cash flow was 1.1B, FCF margin was 9.3%, and net debt to EBITDA was 18.6x, so the core question is not whether the business can produce cash, but whether that cash can outpace the capital structure.
I would become more constructive if EBITDA holds above 786M for another quarter, because that would show the Q1 2026 trough was temporary and that the financing structure is still being supported by operating earnings. If EBITDA slips back below that level, meaning the business is no longer covering fixed costs with enough cushion, I would move back toward a more cautious stance.
Company Profile
Avis Budget Group is a global rental-car company that earns most of its revenue from vehicle rentals and related services. Its economics depend on fleet utilization, vehicle residual values, and access to secured financing, because the business must keep replacing cars while matching demand across airport and local markets. That makes the company more cyclical than a typical consumer services name, but it also means cash generation can be substantial when utilization and pricing hold.
Economic Moat
Business Model
The moat here is not brand alone; it is the combination of fleet scale, access to asset-backed funding, and the operating discipline needed to keep a large rental fleet turning. The April 30, 2026 extension of the Series 2010-6 and Series 2015-3 notes, which were upsized to $2.6B and $132M before stepping down on November 1, 2026, shows that the company can still place and roll secured financing for the fleet. That is a real structural advantage, because a smaller competitor would struggle to fund vehicles on the same terms.
Business & Operating Risks
According to the risk factors in the company’s SEC filings, the main threats are refinancing dependence, fleet-value exposure, and sensitivity to travel demand. Those risks are material because the model only works if the company can keep funding cars and reselling them without a sharp drop in residual values. The May 29, 2026 senior note issue at 8.0% due 2031 helps push maturities out, but it also shows the cost of capital is rising, which can pressure the moat if funding stays expensive.
The disclosed risks do threaten the moat, but they do not break it today; they mainly test whether the financing advantage can survive a higher-rate environment and a weaker used-car market.
Management Discussion & Analysis
Management is responding to the financing risk directly through maturity extension, note issuance, and continued fleet-funding management. The company is not solving leverage overnight, but it is actively keeping the capital structure open, which is the right response for a business that depends on rolling secured debt. The appointment of Tina Goldenberg as vice president and chief accounting officer, with Cathleen DeGenova staying through April 1, 2027, also suggests reporting continuity rather than disruption.
Recent Events
The recent 8-Ks point to a company that is defending its funding base rather than changing strategy. The April 30 financing amendment, the May 29 senior notes, and the May 26 accounting leadership transition all support operational continuity, while the May 20 shareholder meeting was routine and did not alter control or governance. In my view, these events reinforce the moat only insofar as they keep the fleet funded; they do not create a new competitive edge.
Financial Analysis
Growth
CAR — Financial Growth (Quarterly, USD Mil)
| Metric | 2025-06-30 | 2025-09-30 | 2025-12-31 | 2026-03-31 | 2026-06-30 |
|---|---|---|---|---|---|
| REVENUE (USD Mil) | 3,093 | 3,550 | 2,675 | 2,540 | 3,066 |
| EBIT (USD Mil) | 125 | 582 | -634 | -231 | 181 |
| EBITDA (USD Mil) | 1,113 | 1,592 | 326 | 786 | 1,138 |
| NET INCOME (USD Mil) | 4 | 359 | -747 | -283 | 35 |
| DILUTED EPS | 0.1 | 10.1 | -21.2 | -8 | 1 |
Source: Yahoo Finance — Quarterly Financial Statements
Revenue was 3.1B in Q2 2025, rose to 3.6B in Q3 2025, then fell to 2.5B in Q1 2026 before recovering to 3.1B in Q2 2026. That pattern tells me the business is still cyclical rather than steadily compounding, but the rebound from 2.5B to 3.1B also shows demand did not collapse after the winter trough. EBIT improved from -231M in Q1 2026 to 181M in Q2 2026, which is the more important signal because it shows operating leverage is still working when volume returns.
Profitability
CAR — Profitability (TTM)
| Metric | TTM |
|---|---|
| Operating Margin (TTM) | 14.9% |
| Net Margin (TTM) | -5.4% |
| Return on Assets (TTM) | 2.7% |
| Return on Equity (TTM) | — |
| Gross Margin (TTM) | 27.4% |
| EBITDA Margin (TTM) | 13.1% |
Source: Yahoo Finance — Trailing Twelve Months (TTM)
TTM gross margin was 27.4%, operating margin was 14.9%, EBITDA margin was 13.1%, and net margin was -5.43%. I read that spread as a business that still earns healthy gross profit but gives back too much below the line to produce consistent GAAP earnings. Return on assets was 2.7% TTM, which is modest, and the latest quarter’s 35M of net income is encouraging, but I would want to see that profitability hold before calling the bottom in earnings quality.
Valuation
CAR — Valuation Multiples
| Metric | Value |
|---|---|
| Current Share Price (USD) | 117.7 |
| Market Cap (USD Mil) | 4,158 |
| Enterprise Value (USD Mil) | 32,886 |
| Trailing P/E | — |
| Forward P/E | 19.5 |
| Price/Sales (TTM) | 0.4 |
| Price/Book (mrq) | -1.2 |
| EV/Revenue | 2.8 |
| EV/EBITDA | 21.4 |
| Beta (5Y Monthly) | 1.90 |
| FCF Yield % (TTM) | 26.3% |
| Forward EPS (USD) | 6 |
| Analyst Target Price – Low (USD) | 94 |
| Analyst Target Price – Mean (USD) | 128.6 |
| Analyst Target Price – High (USD) | 160 |
| # Analyst Opinions | 7 |
Source: Yahoo Finance
The stock trades at 21.4x EV/EBITDA, 2.8x EV/revenue, 19.5x forward P/E, and a 26.3% FCF yield, with a current share price of 117.7 and a market cap of 4.2B. On my read, that is not a cheap multiple for a highly levered rental-car business, but the free cash flow yield is strong enough to keep the equity from looking expensive in absolute terms. The analyst set is real, with 7 opinions and a 94 to 160 target range around a 128.6 mean, so my fair-value view sits inside consensus rather than fighting it.
On the analysis here, I would put fair value roughly in the 110 to 135 range. That range is slightly below the consensus mean because I weight the 18.6x net debt/EBITDA burden more heavily than the target-price crowd appears to, even though the cash yield is attractive. Forward EPS is 6.05, which implies a forward P/E just under 20x; that is not cheap versus peers with cleaner balance sheets, but it is reasonable if the company keeps converting earnings into cash at the current pace.
Leverage
CAR — Leverage & Coverage (Quarterly)
| Metric | Value |
|---|---|
| Total Debt/Equity % (mrq) | — |
| Current Ratio (mrq) | 0.8 |
| Total Debt (mrq, USD Mil) | 29,125 |
| Operating Cash Flow (TTM, USD Mil) | 2,906 |
| Levered Free Cash Flow (TTM, USD Mil) | 1,093.1 |
| Net Debt/EBITDA (TTM) | 18.6 |
| FCF Margin % (TTM) | 9.3% |
Source: Yahoo Finance — Quarterly Financial Statements
Total debt was 29.1B, net debt to EBITDA was 18.6x, current ratio was 0.8, operating cash flow was 2.9B TTM, and levered free cash flow was 1.1B TTM. That is a heavy capital structure, but the cash generation is real, and the company is still producing enough free cash flow to service debt and refinance fleet funding. The current ratio below 1.0 means short-term liquidity is tight, so the equity case depends on continued access to financing markets and stable fleet economics.
Insider Activity
I do not see a meaningful insider-buying signal in the material provided here, so I would not lean on ownership activity as a support for the thesis. For this name, the operating and financing data matter far more than insider trading.
Comparable Analysis
Growth
| Company | Revenue TTM (USD Mil) | Revenue Growth YoY % | Diluted EPS TTM |
|---|---|---|---|
| CAR | 11,711 | -1.3% | -18.4 |
| UBER | 55,227 | 12.2% | 4.6 |
| LYFT | 6,771.9 | 16.1% | 6.7 |
| R | 12,819 | 5.0% | 12.3 |
| HTZ | 8,906 | 9.7% | -0.9 |
| UHAL | 6,089.4 | 3.2% | 0.1 |
Source: Yahoo Finance
CAR’s revenue growth was -1.3% TTM, below UBER’s 12.2%, LYFT’s 16.1%, R’s 5.0%, HTZ’s 9.7%, and UHAL’s 3.2%. That puts CAR at the weak end of the group on top-line momentum, which is why the market is not rewarding it with a growth multiple despite the cash generation.
Valuation
| Company | Current Share Price (USD) | Trailing P/E | Forward P/E | EV/Revenue | EV/EBITDA | Price/Sales (TTM) | Price/Book (mrq) | Market Cap (USD Mil) | Enterprise Value (USD Mil) | Beta (5Y Monthly) | FCF Yield % (TTM) | Forward EPS | Analyst Target Price – Low | Analyst Target Price – Mean | Analyst Target Price – High | # Analyst Opinions |
|---|---|---|---|---|---|---|---|---|---|---|---|---|---|---|---|---|
| CAR | 117.7 | — | 19.5 | 2.8 | 21.4 | 0.4 | -1.2 | 4,158 | 32,886 | 1.90 | 26.3% | 6 | 94 | 128.6 | 160 | 7 |
| UBER | 70.5 | 15.5 | 16 | 2.8 | 20.7 | 2.6 | 5.3 | 144,000 | 154,423 | 1.16 | 5.0% | 4.4 | 70 | 101.2 | 150 | 46 |
| LYFT | 15.1 | 2.3 | 7 | 0.8 | 111.9 | 0.8 | 1.9 | 5,716 | 5,214 | 1.84 | 20.2% | 2.2 | 14 | 19.6 | 30 | 37 |
| R | 238.5 | 19.4 | 13.5 | 1.4 | 6.2 | 0.7 | 3.2 | 9,147 | 17,381 | 1 | 10.4% | 17.7 | 283 | 299.6 | 320 | 9 |
| HTZ | 1.8 | — | -20.4 | 2.4 | 56.9 | 0.1 | -1 | 649 | 21,101 | 2.31 | 227.5% | -0.1 | 1 | 2.2 | 3 | 6 |
| UHAL | 64.3 | 459.1 | 30.9 | 3.2 | 25.5 | 2.1 | 1.6 | 12,564 | 19,389 | 1.08 | -12.8% | 2.1 | 74 | 87.7 | 99 | 3 |
Source: Yahoo Finance
CAR trades at 2.8x EV/revenue and 21.4x EV/EBITDA, versus UBER at 2.8x and 20.7x, LYFT at 0.8x and 111.9x, R at 1.4x and 6.2x, HTZ at 2.4x and 56.9x, and UHAL at 3.2x and 25.5x. On a one-year basis, a $1 investment would be worth $0.8 in CAR, $0.7 in LYFT, $1.3 in R, $0.4 in HTZ, and $1.1 in UHAL, so CAR has lagged the stronger balance-sheet names even though its cash yield is better than most of the group. I think that gap reflects leverage more than business quality: the market is not paying for growth here because it is still focused on refinancing risk.
Profitability
| Company | Operating Margin (TTM) | Net Margin (TTM) | Return on Assets (TTM) | Return on Equity (TTM) | Gross Margin (TTM) | EBITDA Margin (TTM) |
|---|---|---|---|---|---|---|
| CAR | 14.9% | -5.4% | 2.7% | — | 27.4% | 13.1% |
| UBER | 13.3% | 17.3% | 6.9% | 37.2% | 40.8% | 13.5% |
| LYFT | 2.6% | 42.3% | -0.9% | 152.6% | 38.0% | 0.7% |
| R | 8.5% | 3.9% | 3.9% | 16.7% | 19.8% | 21.7% |
| HTZ | 7.1% | -3.1% | 0.7% | — | 16.3% | 4.2% |
| UHAL | 15.1% | 1.0% | 1.3% | 0.8% | 28.5% | 12.5% |
Source: Yahoo Finance
CAR’s 14.9% operating margin is ahead of UBER’s 13.3%, LYFT’s 2.6%, R’s 8.5%, HTZ’s 7.1%, and UHAL’s 15.1%, while its 13.1% EBITDA margin is above LYFT’s 0.7% and HTZ’s 4.2% but below R’s 21.7%. The margin profile is respectable, yet the -5.43% net margin shows that leverage and below-the-line costs still matter more than operating strength alone. In that sense, CAR’s profitability is better than the market price suggests, but not strong enough to ignore the balance sheet.
Leverage
| Company | Current Ratio (mrq) | Free Cash Flow TTM (USD Mil) | Net Debt/EBITDA (TTM) | FCF Margin % (TTM) |
|---|---|---|---|---|
| CAR | 0.8 | 1,093.1 | 18.6 | 9.3% |
| UBER | 0.8 | 7,244.8 | 1.2 | 13.1% |
| LYFT | 0.6 | 1,153.1 | -10.8 | 17.0% |
| R | 0.6 | 949.2 | 3 | 7.4% |
| HTZ | 0.6 | 1,476 | 55.1 | 16.6% |
| UHAL | 1 | -1,604.8 | 9.3 | -26.4% |
Source: Yahoo Finance
CAR’s 18.6x net debt/EBITDA is far above UBER’s 1.2x, R’s 3.0x, and UHAL’s 9.3x, and only HTZ is more stretched at 55.1x. CAR’s 0.8 current ratio is also weaker than UBER’s 0.8, LYFT’s 0.6, R’s 0.6, HTZ’s 0.6, and UHAL’s 1.0, so the company sits in the more vulnerable part of the peer set on liquidity. That leverage gap explains why CAR can post a solid FCF yield and still trade at a discount to cleaner names like UBER on a risk-adjusted basis.
Conclusion
The tension in this name is straightforward: the business is still generating real cash, but the 18.6x net debt/EBITDA load keeps that cash from translating into a cleaner equity story. I would put my rating as a buy because the latest quarter and the financing actions show the company can still fund itself, and the current 26.3% FCF yield gives me enough margin of safety to stay constructive.
The bull case is that EBITDA stays above 786M and free cash flow remains above 1B, which would confirm that the fleet and financing model are still working even with higher funding costs. If that happens, the market should start to look through the leverage and focus more on cash conversion, especially if the company can keep operating margin near 15.0% and avoid another earnings dip.
The bear case is that EBITDA falls back below 786M or current liquidity tightens further, because then the company would be relying on refinancing rather than operating strength to hold the equity together. I would move toward Hold if the cash generation weakens materially, and I would turn more negative if the company starts to lose access to reasonably priced fleet funding.
For now, I think the cash flow is holding up better than the market is giving it credit for, but the balance sheet still sets the ceiling on the rating. That is why I stay constructive, but only with clear eyes about the refinancing risk.
What to Watch Next
- EBITDA above 786M — would confirm the operating rebound is holding.
- Levered free cash flow above 1B — would support the current buy rating.
- Net debt/EBITDA below 18.6x — would show leverage is easing rather than staying stuck.
- Current ratio staying near 0.8 — would indicate liquidity is not deteriorating further.
- Fleet financing access at acceptable coupons — would keep the capital structure open.
What’s your take? I rated Avis Budget (CAR) BUY above — but the goal here is to get this right, not just to publish an opinion. What would you add to this analysis, or which risk or catalyst do you think I’m under- or over-weighting? Tell me in the comments.
Sources
- SEC 8-K Filing (2026-06-01)
- SEC 8-K Filing (2026-05-29)
- SEC 8-K Filing (2026-05-21)
- SEC 8-K Filing (2026-05-05)
- SEC 8-K Filing (2026-04-29)
- SEC 8-K Filing (2026-03-27)
- SEC Form 4 Insider Transaction (2026-04-30)
- SEC Form 4 Insider Transaction (2026-04-30)
- SEC Form 4 Insider Transaction (2026-04-28)
- SEC 10-K Annual Report — FY2026
- SEC 10-K Annual Report — FY2025
- SEC 10-K Annual Report — FY2024
- SEC 10-K Annual Report — FY2023
- SEC 10-K Annual Report — FY2022
Data sourced from Yahoo Finance and SEC EDGAR. Not investment advice.
Leave a Comment