
| Company | Aug 25 | Sep 25 | Oct 25 | Nov 25 | Dec 25 | Jan 26 | Feb 26 | Mar 26 | Apr 26 | May 26 | Jun 26 | Jul 26 | 12-Mo |
|---|---|---|---|---|---|---|---|---|---|---|---|---|---|
| PAGP | -2% | -5% | -3% | +7% | +3% | +9% | +10% | +8% | +1% | +1% | -0% | +10% | +45% |
| PAA | -1% | -5% | -1% | +6% | +3% | +9% | +9% | +7% | +3% | -1% | -1% | +12% | +46% |
| WES | -2% | +0% | -2% | +5% | +0% | +5% | +3% | -1% | +6% | +1% | +2% | +9% | +28% |
| KMI | -4% | +5% | -7% | +5% | +1% | +11% | +10% | +1% | -2% | -5% | +3% | +1% | +18% |
| OKE | -6% | -4% | -8% | +10% | +1% | +8% | +6% | +9% | +2% | -8% | +4% | +4% | +17% |
| MPLX | -1% | -2% | +2% | +9% | -2% | +5% | +8% | -3% | -1% | -1% | +3% | +4% | +20% |
Source: Yahoo Finance monthly adjusted close.
Executive Summary
Rating: HOLD | PAGP
Measured from adjusted close on 2026-08-04 to 2026-09-18. Sell ratings are correct when the stock falls; Hold is tracked as a +/-10% range. Daily-close data, not intraday. Calls are tracked for 182 days from publication, then frozen as a final record.
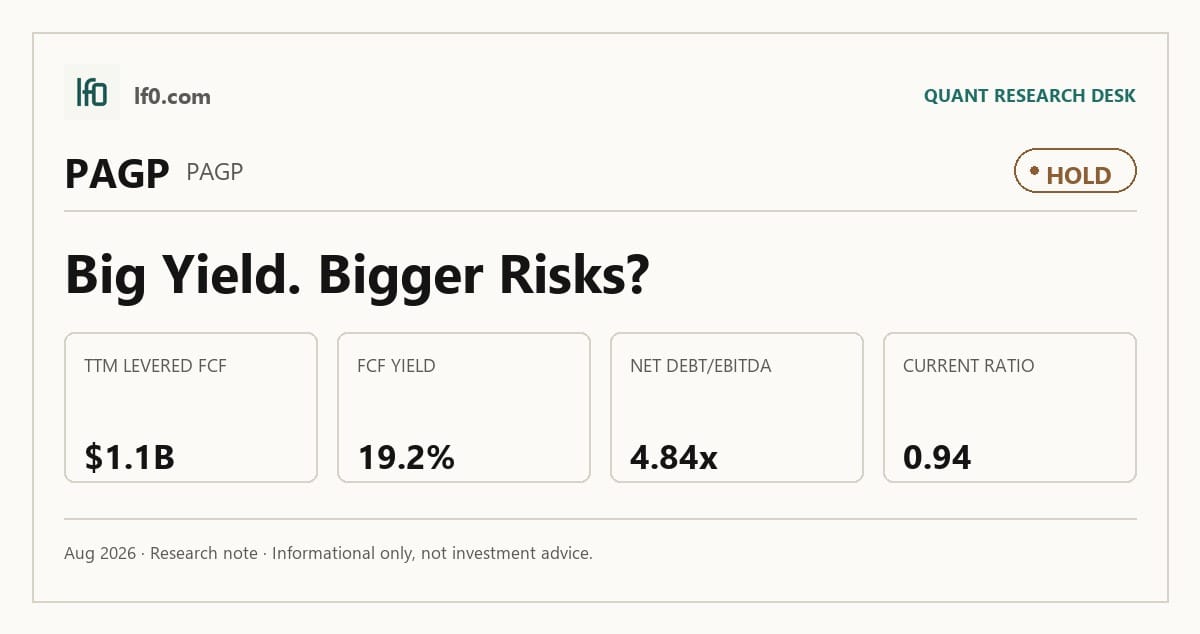
I would put my rating as a Hold because PAGP offers a 19.2% free cash flow yield, but that cash stream sits behind 4.8x net debt/EBITDA and a 0.94 current ratio, so the equity is attractive on cash generation yet still exposed to a payout shock. In my view, the key question is not whether the business can generate cash — it can — but whether the upstream distribution chain stays intact long enough for the Canadian NGL sale and debt reduction to de-risk the structure. I would turn more constructive if net debt/EBITDA falls below 4.0x, meaning leverage is clearly moving away from a level that can pressure distributions.
Company Profile
Plains GP Holdings, L.P. is a Delaware limited partnership that elected corporate tax treatment for U.S. federal income tax purposes and trades on Nasdaq under PAGP. It does not own operating assets directly; instead, it holds an indirect limited partner interest in Plains All American Pipeline, L.P. (PAA) through Plains AAP, L.P. (AAP), plus a 100% managing member interest in Plains All American GP LLC, which holds the non-economic general partner interest in AAP. That structure makes PAGP a pass-through claim on PAA’s cash generation rather than a standalone operating company, so the investment case depends on the quality of the underlying midstream network and the stability of distributions upstream.
PAA was founded in 1998 and has completed more than 100 acquisitions and over $18.7B of investment capital projects. Its footprint spans the United States and Canada, with about 3,900 employees, and the current structure is built around 1-for-1 economic parity between PAGP’s Class A shares and the underlying PAA common units. In June 2025, PAA signed a Share Purchase Agreement to sell Plains Midstream Canada ULC to Keyera Corp. for about C$5.2B, a transaction that is central to the simplification story discussed below.
Economic Moat
Business Model
The most defensible element is PAA’s interconnected crude oil system. As of December 31, 2025, it controlled 20,405 miles of active crude oil transportation pipelines and gathering systems, 76 million barrels of commercial crude oil storage capacity, and 42 million barrels of active above-ground tank capacity. I feel that a competitor would struggle to replicate that footprint within 3 years because the system is already tied into major producing regions, market hubs, and export terminals, and it is supported by long-term acreage dedications, shipper commitments, and minimum volume commitment contracts.
The Permian Basin is the clearest proof point. PAA controls 9,490 miles of system length and 7,333 average barrels per day of 2025 volumes through gathering, intra-basin, and long-haul assets, while the Cactus III Pipeline, acquired from EPIC Crude Holdings, LP in the fourth quarter of 2025, added more than 600,000 barrels per day of capacity and improved access to Corpus Christi. The Cushing terminal is another structural asset because it is a designated NYMEX delivery location with 27 million barrels of commercial storage capacity, which gives PAA a role in price discovery and inventory management that is harder to copy than a simple point-to-point pipe.
The moat is narrower than a pure monopoly, but it is real. PAA’s merchant model can capture basis dislocations, and the network’s scale gives it optionality across gathering, storage, and transportation. That said, the advantage comes from physical connectivity and contract coverage, not from pricing power, so it is durable only as long as the system remains full and relevant to producers and refiners.
Business & Operating Risks
The most material risk is that PAGP’s cash flow depends on distributions from PAA through AAP, and those distributions can be reduced for reasons outside PAGP’s control. According to the risk factors in the 10-K, PAGP’s cash flow is entirely dependent on PAA’s ability to make cash distributions to AAP and on AAP’s ability to make cash distributions to PAGP. Because PAGP has no direct operating asset base of its own, any squeeze at PAA flows straight into PAGP’s payout capacity and valuation.
PAA’s leverage and credit access are the next pressure point. The filing discloses approximately $11.3B of consolidated debt at December 31, 2025 and over $2.0B of liquidity, but that liquidity is subject to continued covenant compliance. If lower adjusted EBITDA pushes leverage higher, the credit agreements can restrict distributions and tighten financial flexibility before the issue becomes a solvency problem.
Competition and overbuilt midstream capacity are a third risk. The filing specifically calls out recontracting risk and capacity overbuild in the Eagle Ford, Permian Basin, and Rockies/Bakken, which matters because PAA’s transportation and merchant margins depend on keeping pipes full and renewing contracts at acceptable rates. If shippers can move volumes to underutilized rivals, cash available for distribution falls.
Taken together, these risks do not break the moat, but they do test it at the point that matters most: the network’s value only translates into equity value if the upstream distribution chain stays intact.
Management Discussion & Analysis
Management is actively responding to the risks above by simplifying the portfolio and reducing leverage. The Canadian NGL Business sale is expected to close in 2026, and the expected net proceeds are earmarked to reduce borrowings, which directly addresses the balance-sheet and distribution risk discussed above. That is the right response in my view, because the company’s structural advantage is strongest in crude oil logistics, not in a more seasonal NGL platform.
The capital plan also looks disciplined. Management expects about $440M of 2026 investment capital, with roughly half directed to the Permian JV assets, and about $185M of maintenance capital. That tells me the company is still funding the core network while avoiding a large expansionary spend that would compete with deleveraging.
The financing actions in 2025 reinforce that message. PAGP issued $3B of senior notes, repaid $1B of senior notes in October 2025, and used proceeds from the EPIC acquisition term loan to retire the $1.1B EPIC credit agreement. In my view, that is disciplined capital allocation, but it is not yet a clean deleveraging story because the company still carries a working capital deficit and remains dependent on covenant compliance.
Recent Events
The most important recent event is the May 12, 2026 sale of Plains Midstream Canada ULC, the Canadian natural gas liquids business, to Keyera for about C$5.2B, or roughly $3.8B, with net proceeds of about $3.3B after taxes and expenses. That is a clear portfolio simplification and a direct balance-sheet positive because the cash is intended to reduce borrowings, including commercial paper, the term loan, and the 4.5% senior notes due December 2026.
The same filing shows management is using the transaction to clean up the financing structure. The $1.1B senior unsecured term loan funded in December 2025 becomes subject to mandatory prepayment within seven business days of closing and is intended to be terminated on May 14, 2026. I read that as a sign that management is not just selling an asset, but actively de-risking the capital structure.
Governance changes were more incremental. On May 11, 2026, the board appointed Cynthia B. Taylor as an independent director, and on June 1, 2026, Russ Montgomery was named Vice President, Accounting and Chief Accounting Officer effective September 1, 2026, replacing retiring finance chief Chris Herbold. Those moves look like continuity events rather than a strategic reset, so the recent filings strengthen the thesis mainly through simplification and deleveraging.
Financial Analysis
Growth
PAGP — Financial Growth (Quarterly, USD Mil)
| Metric | 2025-03-31 | 2025-06-30 | 2025-09-30 | 2025-12-31 | 2026-03-31 |
|---|---|---|---|---|---|
| REVENUE (USD Mil) | 11,477 | 10,642 | 11,578 | 10,564 | 12,470 |
| EBIT (USD Mil) | 495 | 339 | 570 | 458 | 477 |
| EBITDA (USD Mil) | 727 | 573 | 800 | 715 | 720 |
| NET INCOME (USD Mil) | 84 | 30 | 83 | 62 | 20 |
| DILUTED EPS | 0.4 | 0.1 | 0.4 | 0.4 | 0.1 |
Source: Yahoo Finance — Quarterly Financial Statements
PAGP’s revenue moved from 11.5B in Q1 2025 to 10.6B in Q2, recovered to 11.6B in Q3, slipped to 10.6B in Q4, and then rose to 12.5B in Q1 2026. That is choppy, but the latest quarter was still up 8.6% year over year, which tells me the top line is holding up even as the portfolio is being reshaped. EBITDA was 720M in Q1 2026 versus 727M a year earlier, so revenue growth is not yet translating into operating leverage.
That gap matters because it ties the growth profile back to the moat: the network is still generating volume, but the cash conversion is not accelerating fast enough to suggest a step-change in pricing power. I would want to see revenue growth paired with a clearer EBITDA inflection before calling this a durable acceleration.
Profitability
PAGP — Profitability (TTM)
| Metric | TTM |
|---|---|
| Operating Margin (TTM) | 2.8% |
| Net Margin (TTM) | 0.4% |
| Return on Assets (TTM) | 2.8% |
| Return on Equity (TTM) | 9.1% |
| Gross Margin (TTM) | 5.9% |
| EBITDA Margin (TTM) | 5.2% |
Source: Yahoo Finance — Trailing Twelve Months (TTM)
TTM operating margin was 2.81%, net margin was 0.433%, gross margin was 6.0%, and EBITDA margin was 5.2%. Those are thin spreads, which tells me PAGP is still a low-margin infrastructure owner where value creation depends more on scale and asset utilization than on pricing power. The gap between gross margin and operating margin is only 3.2 percentage points, so the business is not losing much at the operating line after direct costs, but the absolute level leaves little room for error if volumes soften.
ROA was 2.85% TTM and ROE was 9.08% TTM. The spread between the two shows returns are being amplified by leverage rather than by exceptional asset productivity, so I would watch for ROA to move closer to ROE as a sign of more durable capital efficiency. The profitability profile is positive, but it is still too thin to absorb much execution slippage.
Valuation
PAGP — Valuation Multiples
| Metric | Value |
|---|---|
| Market Cap (USD Mil) | 5,930 |
| Enterprise Value (USD Mil) | 29,230 |
| Trailing P/E | 33.1 |
| Forward P/E | 11.6 |
| Price/Sales (TTM) | 0.1 |
| Price/Book (mrq) | 4 |
| EV/Revenue | 0.6 |
| EV/EBITDA | 12.4 |
| Beta (5Y Monthly) | 0.45 |
| FCF Yield % (TTM) | 19.2% |
| Forward EPS (USD) | 2.2 |
| Analyst Target Price – Low (USD) | 20 |
| Analyst Target Price – Mean (USD) | 24.6 |
| Analyst Target Price – High (USD) | 29 |
| # Analyst Opinions | 14 |
Source: Yahoo Finance
FCF yield was 19.2% TTM, which is the cleanest anchor here because PAGP’s earnings-based multiples are distorted by a capital structure that leaves only a 2.5% FCF margin on 11.6B of revenue. At a 5.9B market cap and 29.2B enterprise value, the market is paying 0.646x EV/revenue and 12.4x EV/EBITDA for a business that must keep converting midstream cash flow into distributable cash to justify the multiple. Trailing P/E is 33.1x, but forward P/E falls to 11.6x on 2.19 of forward EPS, so the market is clearly assuming earnings normalize rather than compound at a high rate.
On my read, fair value sits in a roughly $20-$29 range, which is close to the analyst target band of $20 to $29 from 14 opinions. I do not see a strong reason to argue for a premium to consensus because the leverage profile still caps upside, but I also do not think the market is pricing in a severe downside case while the cash yield remains this high. The forward EPS of $2.2 also looks reasonable relative to peers, but PAGP’s lower margin structure means that earnings quality is more dependent on stable throughput than on operating efficiency.
The stock performance framing supports that view. A $1 investment a year ago would be worth $1.46 in PAGP, which is in line with PAA and ahead of WES, KMI, OKE, and MPLX. That tells me the market already gives credit for the cash stream, so the valuation case is less about rerating and more about whether the current yield can be sustained through the simplification process.
Leverage
PAGP — Leverage & Coverage (Quarterly)
| Metric | Value |
|---|---|
| Total Debt/Equity % (mrq) | 83 |
| Current Ratio (mrq) | 0.9 |
| Total Debt (mrq, USD Mil) | 11,578 |
| Operating Cash Flow (TTM, USD Mil) | 2,711 |
| Levered Free Cash Flow (TTM, USD Mil) | 1,136.4 |
| Net Debt/EBITDA (TTM) | 4.8 |
| FCF Margin % (TTM) | 2.5% |
Source: Yahoo Finance — Quarterly Financial Statements
PAGP’s leverage is elevated but still serviceable. Total debt/equity was 83.0%, current ratio was 0.9, and total debt was 11.6B. Cash generation is solid: operating cash flow was 2.7B TTM, levered free cash flow was 1.1B, net debt/EBITDA was 4.8x, and FCF margin was 2.5%.
In my opinion, this is manageable but not comfortable. The company generates enough cash to cover debt service, yet the 0.9 current ratio leaves little near-term liquidity cushion and the 4.8x net debt load limits flexibility if cash flow weakens. The balance sheet gives PAGP room to absorb a normal downturn, but a covenant test, higher rates, or a refinancing date would become a near-term concern if cash flow slips further.
Insider Activity
Insider ownership was 2.8%, while institutional ownership was 84.9%. That ownership mix is typical for a large-cap midstream name and tells me the stock is mainly owned by institutions rather than insiders. Short interest is not trivial either, with short ratio at 13.6 and short interest at 8.5% of float, which suggests the market is still debating how durable the cash stream will be after the asset sale and debt reduction.
Comparable Analysis
Growth
| Company | Revenue TTM (USD Mil) | Revenue Growth YoY % | EBITDA TTM (USD Mil) | Diluted EPS TTM |
|---|---|---|---|---|
| PAGP | 45,255 | 8.7% | 2,355 | 0.8 |
| PAA | 45,255 | 8.7% | 2,362 | 1.1 |
| WES | 4,049.9 | 22.5% | 2,371.6 | 3 |
| KMI | 17,959 | 10.8% | 7,635 | 1.6 |
| OKE | 35,204 | 19.6% | 7,507 | 5.5 |
| MPLX | 11,735 | -2.8% | 5,997 | 4.7 |
Source: Yahoo Finance
PAGP’s revenue growth was 8.7% TTM, the same as PAA’s 8.7%, below WES at 22.5% and OKE at 19.6%, and above MPLX at -2.8%. That puts PAGP in the middle of the group, so I do not see a growth premium or discount that is obviously mispriced on its own. The market is paying for a steady midstream cash stream, not for faster top-line expansion.
Valuation
| Company | Trailing P/E | Forward P/E | EV/Revenue | EV/EBITDA | Price/Sales (TTM) | Price/Book (mrq) | Market Cap (USD Mil) | Enterprise Value (USD Mil) | Beta (5Y Monthly) | FCF Yield % (TTM) | Forward EPS | Analyst Target Price – Low | Analyst Target Price – Mean | Analyst Target Price – High | # Analyst Opinions |
|---|---|---|---|---|---|---|---|---|---|---|---|---|---|---|---|
| PAGP | 33.1 | 11.6 | 0.6 | 12.4 | 0.1 | 4 | 5,930 | 29,230 | 0.45 | 19.2% | 2.2 | 20 | 24.6 | 29 | 14 |
| PAA | 21.2 | 12.2 | 0.7 | 14.3 | 0.4 | 2.2 | 16,615 | 33,736 | 0.49 | 6.7% | 1.9 | 20 | 24.5 | 27 | 17 |
| WES | 15.4 | 12.5 | 6.6 | 11.2 | 4.8 | 5.5 | 19,299 | 26,611 | 0.66 | 4.6% | 3.7 | 38 | 46 | 55 | 12 |
| KMI | 20.2 | 20.4 | 5.8 | 13.6 | 3.9 | 2.2 | 69,815 | 103,504 | 0.55 | 1.5% | 1.5 | 31 | 35.6 | 43 | 21 |
| OKE | 16.1 | 14 | 2.5 | 11.9 | 1.6 | 2.5 | 55,210 | 89,205 | 0.71 | 0.8% | 6.2 | 88 | 96 | 108 | 21 |
| MPLX | 13 | 12.4 | 7.2 | 14.1 | 5.2 | 4.4 | 61,310 | 84,632 | 0.46 | 3.1% | 4.9 | 54 | 60.9 | 73 | 13 |
Source: Yahoo Finance
PAGP trades at 12.4x EV/EBITDA and 0.6x EV/revenue, versus PAA at 14.3x and 0.7x, WES at 11.2x and 6.6x, KMI at 13.6x and 5.8x, OKE at 11.9x and 2.5x, and MPLX at 14.1x and 7.2x. On a cash basis, PAGP’s 19.2% FCF yield is far above PAA’s 6.7%, WES’s 4.6%, KMI’s 1.5%, OKE’s 0.8%, and MPLX’s 3.1%, which tells me the market is paying much less for each dollar of cash flow here.
That spread is easier to understand when you connect it to leverage and quality. PAGP’s balance sheet is not the weakest in the group, but its margins are also far lower than the better peers, so the discount is not just about debt — it is also about the lower-return structure of the business. In that sense, the valuation is fair rather than obviously cheap.
Profitability
| Company | Operating Margin (TTM) | Net Margin (TTM) | Return on Assets (TTM) | Return on Equity (TTM) | Gross Margin (TTM) | EBITDA Margin (TTM) |
|---|---|---|---|---|---|---|
| PAGP | 2.8% | 0.4% | 2.8% | 9.1% | 5.9% | 5.2% |
| PAA | 2.8% | 2.5% | 3.0% | 10.4% | 5.9% | 5.2% |
| WES | 41.1% | 29.5% | 7.3% | 36.7% | 69.8% | 58.6% |
| KMI | 30.1% | 19.3% | 4.5% | 11.0% | 49.4% | 42.5% |
| OKE | 14.9% | 10.0% | 5.7% | 15.9% | 29.6% | 21.3% |
| MPLX | 36.1% | 40.0% | 7.0% | 33.4% | 56.1% | 51.1% |
Source: Yahoo Finance
PAGP’s operating margin is 2.8%, net margin is 0.4%, gross margin is 5.9%, and EBITDA margin is 5.2%. By comparison, PAA is at 2.8%, 2.5%, 5.9%, and 5.2%, while WES, KMI, OKE, and MPLX all post materially higher margins across the board. The gap is structural rather than cyclical, because PAGP’s margins are compressed across both gross and operating lines, which points to a lower-return pipeline and logistics mix rather than a temporary cost issue.
ROE is 9.1% and ROA is 2.8%, versus PAA at 10.4% and 3.0%, WES at 36.7% and 7.3%, KMI at 11.0% and 4.5%, OKE at 15.9% and 5.7%, and MPLX at 33.4% and 7.0%. The return profile is respectable, but it is not leading, and that is consistent with a business that is cash generative without being especially efficient.
Leverage
| Company | Total Debt/Equity % (mrq) | Current Ratio (mrq) | Total Debt (mrq, USD Mil) | Operating Cash Flow TTM (USD Mil) | Free Cash Flow TTM (USD Mil) | Net Debt/EBITDA (TTM) | FCF Margin % (TTM) |
|---|---|---|---|---|---|---|---|
| PAGP | 83 | 0.9 | 11,578 | 2,711 | 1,136.4 | 4.8 | 2.5% |
| PAA | 90.3 | 0.9 | 11,578 | 2,715 | 1,107.5 | 4.8 | 2.5% |
| WES | 248.3 | 1.1 | 8,707.5 | 2,161.7 | 887.2 | 3.4 | 21.9% |
| KMI | 98.6 | 0.5 | 32,425 | 6,557 | 1,075 | 4.2 | 6.0% |
| OKE | 149.6 | 0.7 | 33,652 | 5,629 | 454.4 | 4.5 | 1.3% |
| MPLX | 182.8 | 1.1 | 26,134 | 6,010 | 1,930.1 | 4.1 | 16.4% |
Source: Yahoo Finance
PAGP’s total debt/equity is 83.0%, current ratio is 0.9, total debt is $11.6B, net debt/EBITDA is 4.8x, and FCF margin is 2.5%. That is less levered than WES on a debt/equity basis and below KMI, OKE, and MPLX on the same measure, but the cash conversion is also weaker than the better peers, so the balance sheet is not a clean advantage.
The peer comparison matters because leverage and valuation are linked here. PAGP’s lower EV/revenue multiple does not look like a simple bargain when the company also posts a thinner FCF margin than WES or MPLX; the market is discounting the stock for a reason, and that reason is the combination of modest cash conversion and a still-material debt load.
Conclusion
I would put my rating as a Hold because the cash yield is strong, but the balance sheet and upstream structure still limit how much of that cash can safely reach equity holders. The Canadian NGL sale is the right strategic move, yet the investment case is still being asked to prove that simplification will translate into lower leverage and a more durable distribution stream rather than just a one-time balance-sheet reset.
The bull case is that the sale closes, the expected proceeds go to debt reduction, and net debt/EBITDA moves below 4.0x, which would show the capital structure is becoming less fragile. If operating cash flow stays near $2.7B and levered free cash flow remains above $1B, the current distribution should remain covered and the stock would deserve a higher multiple than a plain cash-yield name.
The bear case is that upstream distributions weaken before the simplification benefits show up. If PAA cuts distributions or if leverage stays near 4.8x instead of moving lower, PAGP’s payout capacity would remain vulnerable because it has no direct operating asset base of its own. I would also watch the 0.9 current ratio closely, since that leaves little room for a funding mismatch if markets tighten.
My final view is that the numbers do not yet show enough improvement to move off Hold. The cash generation is real, but the thesis still depends on execution at the upstream level and on the debt reduction plan working as intended.
What’s your take? I rated Plains GP Holdings (PAGP) HOLD above — but the goal here is to get this right, not just to publish an opinion. What would you add to this analysis, or which risk or catalyst do you think I’m under- or over-weighting? Tell me in the comments.
Sources
- SEC 10-K Annual Report — filed 2026-02-27
- SEC 8-K Filing (2026-06-02)
- SEC 8-K Filing (2026-05-22)
- SEC 8-K Filing (2026-05-13)
- SEC 8-K Filing (2026-05-12)
- SEC 8-K Filing (2026-05-08)
- SEC 8-K Filing (2026-03-03)
Data sourced from Yahoo Finance and SEC EDGAR. Not investment advice.
Leave a Comment