
| Company | Sep 25 | Oct 25 | Nov 25 | Dec 25 | Jan 26 | Feb 26 | Mar 26 | Apr 26 | May 26 | Jun 26 | Jul 26 | Aug 26 | 12-Mo |
|---|---|---|---|---|---|---|---|---|---|---|---|---|---|
| NEE | +5% | +8% | +7% | -7% | +9% | +7% | -1% | +5% | -11% | +2% | -1% | -5% | +18% |
| XEL | +12% | +1% | +1% | -9% | +3% | +10% | -4% | +4% | -4% | +2% | -3% | -3% | +8% |
| PCG | -1% | +6% | +1% | +0% | -4% | +23% | -7% | -5% | -2% | +3% | +3% | -24% | -12% |
| SO | +3% | -1% | -2% | -4% | +2% | +10% | -1% | +0% | -4% | +4% | -1% | -6% | -2% |
| DUK | +1% | +0% | +1% | -5% | +4% | +9% | +0% | -1% | -4% | +3% | -1% | -4% | +1% |
Source: Yahoo Finance monthly adjusted close.
Quick Thesis
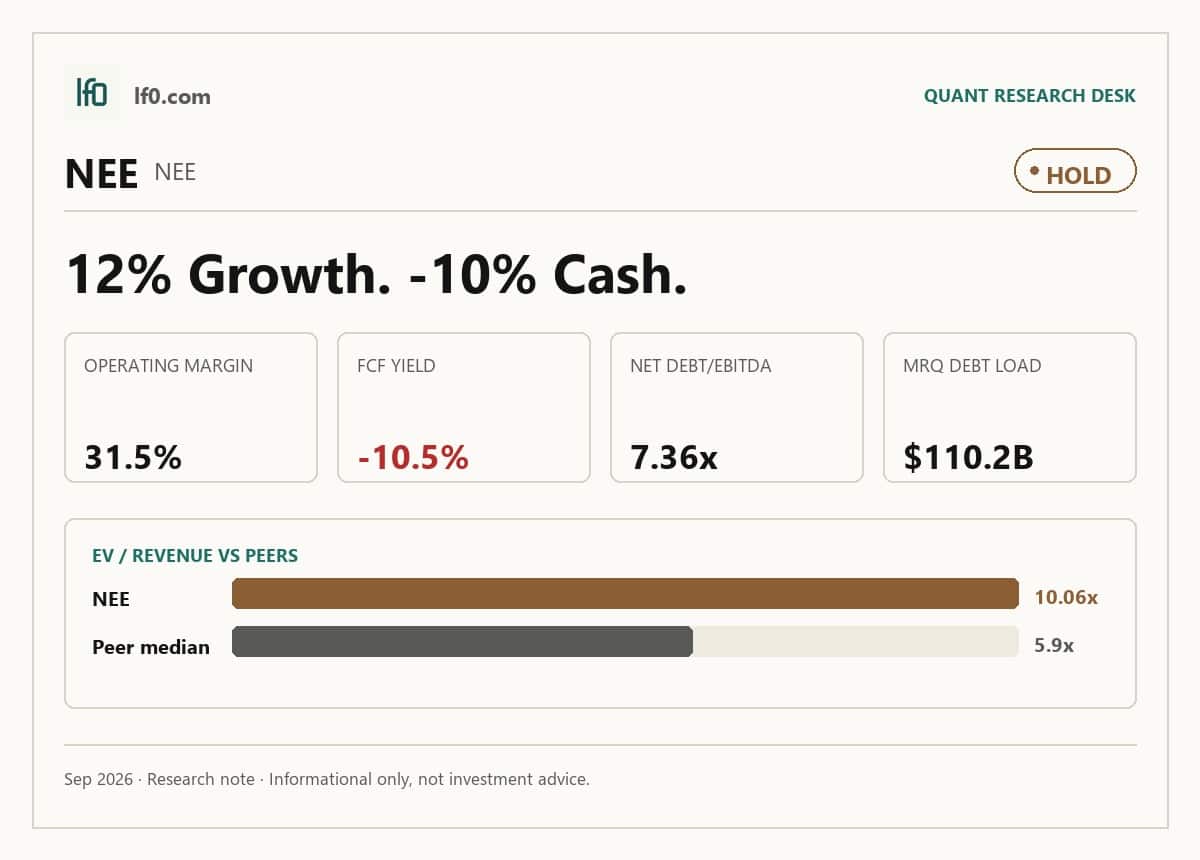
- Rated hold because growth is strong, but cash conversion and leverage still lag.
- TTM operating margin is 31.5%, showing the core franchise still earns well.
- Net debt/EBITDA is 7.4x and levered free cash flow is -$17.8B</span>, the main risk.
- NEE trades at 19.8x EV/EBITDA, rich versus a utility with weak free cash flow.
- I would turn more constructive if free cash flow turns positive and leverage falls below 6.0x.
Executive Summary
Rating: HOLD | NEE
Measured from adjusted close on 2026-09-15 to 2026-09-15. Sell ratings are correct when the stock falls; Hold is tracked as a +/-10% range. Daily-close data, not intraday. Calls are tracked for 182 days from publication, then frozen as a final record.
I would put my rating as a Hold because NextEra Energy combines a clear growth premium with a balance sheet and cash conversion profile that still ask for proof. The company’s 12.4% TTM revenue growth and 53.1% Q2 2026 earnings growth support the premium, but the 7.4x net debt to EBITDA ratio and negative 10.4% FCF yield show that the growth is not yet self-funding, so I cannot call the valuation cheap. I would raise my rating more towards a Buy if free cash flow turns positive and the company shows that the current capital program can be funded without stretching leverage further; in practical terms, that would mean cash generation is finally covering the buildout rather than being absorbed by it.
Company Profile
NextEra Energy Inc. is an electric power and energy infrastructure company with two reporting businesses: Florida Power & Light (FPL), a rate-regulated utility, and NextEra Energy Resources (NEER), a competitive generation and transmission platform. As of December 31, 2025, it had about 80 gigawatts of net generation and storage capacity and served more than 6 million customer accounts through FPL. FPL operates 35,963 megawatts of net capacity, 93,000 circuit miles of lines and 932 substations across most of Florida, while NEER operates about 45,680 megawatts of generation assets and 4,175 circuit miles of transmission lines, with projects in 44 U.S. states and 4 Canadian provinces. The company is financed through NEE and NEECH, a wholly owned funding subsidiary, and it employs about 17,400 people across the enterprise.
Economic Moat
Business Model
The long-duration contracted portfolio is the part of the model I feel a well-funded competitor cannot replicate within 3 years, because as of December 31, 2025 NEER had approximately 35,627 MW of contracted generation with a weighted-average remaining contract term of about 14 years, and roughly 95% of NEER’s net generating capacity was committed under long-term contracts. That contract book gives NEE visibility on cash flows and customer relationships that a new entrant cannot quickly assemble, especially when those assets are spread across 44 states and 4 Canadian provinces and supported by battery storage leadership with about 5,177 MW of net ownership interests. FPL adds a second layer of defense through regulation and franchise rights: it held 226 franchise agreements as of December 31, 2025, served more than 6 million customer accounts and operates under Florida Public Service Commission approved base rates through December 2029, which makes direct retail displacement difficult in my view. I also see the 80 gigawatts of net generation and storage capacity across natural gas, wind, solar, nuclear and batteries as a scale advantage, because it lowers procurement and operating costs in a way smaller rivals cannot match quickly. That scale is reflected in the financials: NEE’s 31.5% operating margin is well above peers, which is consistent with the franchise strength described above.
Business & Operating Risks
The most material risk is regulatory recovery risk: according to the risk factors in their SEC 10-K, NEE and FPL may be unable to recover “any significant amount of costs, a return on certain assets or a reasonable return on invested capital” through base rates or other mechanisms, and the FPSC can disallow costs it views as “excessive or imprudently incurred.” That directly threatens earnings because the company is still committing capital into generation, storage, transmission and distribution projects, so any disallowance would turn planned investment into lower regulated returns rather than a pass-through. The filing also says political or regulatory action could force FPL or NEER to “cancel or delay planned development activities” or “reduce or delay other planned capital expenditures,” which would slow the growth pipeline. Clean energy policy risk is the next major issue: reductions in tax incentives, renewable portfolio standards, feed-in tariffs or the imposition of “additional taxes, tariffs, duties or other costs” on clean energy equipment could leave NEE “abandoning the development of clean energy projects” and taking “loss of investments” and “reduced project returns.” Project execution and permitting risk is also material, especially where equipment, labor and approvals can slip. The disclosed risks do not appear to threaten the moat itself so much as the pace and return on capital that the moat is supposed to produce.
Management Discussion & Analysis
Management is actively responding to the capital-intensity and recovery risks by leaning harder into rate base growth, liquidity and long-dated funding. FPL’s average rate base was up by about $5.5B in 2025, NEER added 1,604 MW of wind, 2,859 MW of solar and 1,799 MW of battery storage, and the company spent $24.6B on capital expenditures, independent power and other investments plus nuclear fuel purchases in 2025. That is a deliberate choice to keep the moat compounding, but it also explains why cash conversion remains weak: operating cash flow was $13.8B TTM while levered free cash flow was -$17.8B TTM, so the buildout is still outrunning cash generation. The financing mix matters too. Total net available liquidity was $18.7B at December 31, 2025, NEECH borrowed $850M in January 2026, and FPL and NEECH extended and expanded their syndicated revolving credit facilities in February 2026, so management is clearly protecting funding access while the capital program runs. I read the January 2026 Symmetry Energy Solutions acquisition, a commercial and industrial natural gas business purchase by a wholly owned NextEra Energy Resources subsidiary, as a small but clear signal that management still wants optionality in gas-related infrastructure, but it is not large enough to change the core thesis.
Recent Events
The most significant development I see here is the May 15, 2026 merger agreement with Dominion Energy, under which NextEra Energy would issue 0.8138 shares plus $360M of cash for each Dominion share. That is a large strategic expansion of the regulated utility footprint, and it strengthens the moat thesis by adding scale and a broader rate base, although the required shareholder and regulatory approvals mean execution risk remains real. I also view the May 15, 2026 leadership change at FPL as constructive: Armando Pimentel, Jr. resigned as chief executive officer effective May 18, 2026 and became vice chairman of NextEra Energy, while Scott Bores, then FPL president, took over as chief executive officer. In my view, that looks like an orderly succession rather than disruption, so it supports continuity in the core utility franchise. The financing actions are also material. On May 26, 2026, FPL sold $255.4M of floating rate notes due June 1, 2076, and on June 1, 2026 it sold $600M of 2036 bonds, $600M of 2056 bonds and $1.1B of 2066 bonds. I read that as reinforcing balance-sheet access and funding flexibility for a capital-intensive utility platform.
Financial Analysis
Growth
NEE — Financial Growth (Quarterly, USD Mil)
| Metric | 2025-06-30 | 2025-09-30 | 2025-12-31 | 2026-03-31 | 2026-06-30 |
|---|---|---|---|---|---|
| REVENUE (USD Mil) | 6,700 | 7,966 | 6,500 | 6,701 | 7,534 |
| EBIT (USD Mil) | 2,443 | 3,038 | 1,903 | 2,486 | 3,025 |
| EBITDA (USD Mil) | 4,300 | 5,231 | 3,618 | 3,948 | 4,901 |
| NET INCOME (USD Mil) | 2,028 | 2,438 | 1,535 | 2,182 | 3,144 |
| DILUTED EPS | 1 | 1.2 | 0.7 | 1 | 1.5 |
Source: Yahoo Finance — Quarterly Financial Statements
Revenue rose from $6.5B in Q4 2025 to $6.7B in Q1 2026 and then to $7.5B in Q2 2026, so the latest quarter was up 12.5% year over year versus $6.7B in Q2 2025. EBITDA grew faster than revenue, from $3.6B in Q4 2025 to $3.9B in Q1 2026 and $4.9B in Q2 2026, which tells me the business is still getting operating leverage from the buildout rather than just adding volume. Net income also accelerated, from $1.5B in Q4 2025 to $2.2B in Q1 2026 and $3.1B in Q2 2026. The Q4 2025 dip looks like a normal utility reset rather than a structural break, so the growth trajectory remains a bull signal.
Profitability
NEE — Profitability (TTM)
| Metric | TTM |
|---|---|
| Operating Margin (TTM) | 31.5% |
| Net Margin (TTM) | 32.4% |
| Return on Assets (TTM) | 2.4% |
| Return on Equity (TTM) | 11.7% |
| Gross Margin (TTM) | 61.0% |
| EBITDA Margin (TTM) | 50.8% |
Source: Yahoo Finance — Trailing Twelve Months (TTM)
TTM operating margin of 31.5%, gross margin of 61.0% and EBITDA margin of 50.9% show a wide spread between the cost of revenue layer and reported operating profit, which means NEE still has substantial operating leverage left in its utility and infrastructure mix. Net margin of 32.4% sits close to operating margin, so the business is converting most of its operating profit into bottom-line earnings rather than leaking it away below the line. ROA of 2.4% versus ROE of 11.7% shows returns are being amplified by leverage, not just asset productivity, so investors should watch whether ROA can move higher as new projects mature. The key signal next is whether operating margin can hold above 30.0% while ROA improves, because that would show profitability is being driven by stronger underlying economics rather than financial leverage alone.
Valuation
NEE — Valuation Multiples
| Metric | Value |
|---|---|
| Market Cap (USD Mil) | 170,070 |
| Enterprise Value (USD Mil) | 288,628 |
| Trailing P/E | 18.3 |
| Forward P/E | 18.6 |
| Price/Sales (TTM) | 5.9 |
| Price/Book (mrq) | 3 |
| EV/Revenue | 10.1 |
| EV/EBITDA | 19.8 |
| Beta (5Y Monthly) | 0.64 |
| FCF Yield % (TTM) | -10.4% |
| Forward EPS (USD) | 4.4 |
| Analyst Target Price – Low (USD) | 55 |
| Analyst Target Price – Mean (USD) | 98.4 |
| Analyst Target Price – High (USD) | 114 |
| # Analyst Opinions | 18 |
Source: Yahoo Finance
NEE trades at 10.1x EV/Revenue and 5.9x price to sales on a trailing twelve-month basis, which is the right anchor here because the 18.3x trailing P/E and 18.6x forward P/E are only moderate for a utility with 32.4% net margin and 50.9% EBITDA margin. The market is effectively paying for durable regulated cash generation and a long runway of earnings power, not for rapid growth. The rest of the stack is consistent with that read: 19.8x is rich for a capital-intensive utility, while 3.0x price to book implies investors are paying nearly 3.0x stated equity for assets that are already heavily leveraged. FCF yield is -10.4%, so cash generation is not covering capital needs right now, and that makes the multiple harder to defend on a pure cash basis. Analyst target prices span $55.0 to $114.0, with a $98.4 mean across 18 opinions, so there is a real consensus to compare against. My fair value range on the analysis here is $79-$92 per share: that sits below the analyst mean because I weight the negative free cash flow and leverage more heavily than the consensus appears to. On earnings, I would frame fair value around $4.2-$4.6 of forward EPS, which is close to the reported 4.4 forward EPS but still looks rich relative to peers when paired with a 7.4x net debt to EBITDA load. That combination is why I think the stock is priced for cleaner cash conversion than the business has shown so far.
Leverage
NEE — Leverage & Coverage (Quarterly)
| Metric | Value |
|---|---|
| Total Debt/Equity % (mrq) | 161.7 |
| Current Ratio (mrq) | 0.5 |
| Total Debt (mrq, USD Mil) | 110,197 |
| Operating Cash Flow (TTM, USD Mil) | 13,803 |
| Levered Free Cash Flow (TTM, USD Mil) | -17,766.9 |
| Net Debt/EBITDA (TTM) | 7.4 |
| FCF Margin % (TTM) | -61.9% |
Source: Yahoo Finance — Quarterly Financial Statements
NEE’s leverage is elevated but still serviceable. Total debt/equity was 161.7% mrq, current ratio was 0.5 mrq and total debt was $110.2B mrq, so the balance sheet is debt-heavy and working capital is tight. Against that, operating cash flow was $13.8B TTM and levered free cash flow was -$17.8B TTM, while net debt/EBITDA was 7.4x and FCF margin was -61.9% TTM. EBITDA is converting poorly into cash because capital spending and other cash demands are absorbing more than the business generates, which leaves less room to absorb a downturn without pressure on funding needs. In my opinion, this is high refinancing risk because the company is carrying $110.2B of debt with a sub-1.0 current ratio and negative free cash flow, so any weaker operating period or a more expensive refinancing would tighten flexibility quickly. The leverage profile also explains why the equity return looks better than the asset return: ROE is 11.7% while ROA is only 2.4%, so the headline return is being lifted by debt rather than by unusually productive assets.
Insider Activity
The insider transaction record I see here is one-sided: 18 open-market sales and 0 open-market purchases in the 2025-02-13 to 2026-05-07 window. The selling is broad rather than isolated, with multiple executives transacting and no single buyer offsetting it, which points to weak insider alignment at the margin. That does not change the operating thesis by itself, but it does sit awkwardly beside the company’s heavy financing needs and makes me less inclined to read the stock as obviously cheap.
Comparable Analysis
Growth
| Company | Revenue TTM (USD Mil) | Revenue Growth YoY % | EBITDA TTM (USD Mil) | Diluted EPS TTM |
|---|---|---|---|---|
| NEE | 28,700 | 12.4% | 14,593 | 4.5 |
| XEL | 14,616 | -5.1% | 6,123 | 3.6 |
| PCG | 25,837 | 0.1% | 10,453 | 1.4 |
| SO | 30,179 | 0.1% | 14,258 | 4.2 |
| DUK | 32,803 | 1.1% | 16,617 | 6.6 |
Source: Yahoo Finance
NEE’s revenue grew 12.4% TTM, versus 1.1% for DUK, 0.1% for PCG and SO, and -5.1% for XEL. That is a clear growth premium, and I think it is partly justified because NEE also posted 53.1% quarterly earnings growth year over year, well above XEL’s 24.0%, PCG’s 39.8%, SO’s 30.4% and DUK’s 10.6%, so the market is paying for the faster earnings comp rather than just a larger utility footprint.
Valuation
| Company | Trailing P/E | Forward P/E | EV/Revenue | EV/EBITDA | Price/Sales (TTM) | Price/Book (mrq) | Market Cap (USD Mil) | Enterprise Value (USD Mil) | Beta (5Y Monthly) | FCF Yield % (TTM) | Forward EPS | Analyst Target Price – Low | Analyst Target Price – Mean | Analyst Target Price – High | # Analyst Opinions |
|---|---|---|---|---|---|---|---|---|---|---|---|---|---|---|---|
| NEE | 18.3 | 18.6 | 10.1 | 19.8 | 5.9 | 3 | 170,070 | 288,628 | 0.64 | -10.4% | 4.4 | 55 | 98.4 | 114 | 18 |
| XEL | 19.9 | 16 | 5.9 | 14 | 3.1 | 1.9 | 45,261 | 85,956 | 0.40 | -17.5% | 4.5 | 74 | 91.8 | 101 | 17 |
| PCG | 9.4 | 7.3 | 3.7 | 9.1 | 1.1 | 0.9 | 28,906 | 95,514 | 0.24 | -21.3% | 1.8 | 14 | 19.7 | 24 | 16 |
| SO | 20.7 | 17.5 | 5.9 | 12.4 | 3.3 | 2.5 | 98,990 | 176,957 | 0.32 | -4.0% | 4.9 | 79 | 100 | 114 | 19 |
| DUK | 17.7 | 16.4 | 5.7 | 11.3 | 2.8 | 1.7 | 91,829 | 187,418 | 0.36 | -4.9% | 7.2 | 129 | 137.3 | 147 | 18 |
Source: Yahoo Finance
NEE trades at 10.1x EV/Revenue, 18.3x trailing P/E, 18.6x forward P/E and a negative 10.4% FCF yield, versus DUK at 5.7x EV/Revenue and 16.4x forward P/E, SO at 5.9x and 17.5x, XEL at 5.9x and 16.0x, and PCG at 3.7x and 7.3x. On a cash basis, NEE looks expensive because its -61.9% FCF margin and -$17.8B TTM FCF imply the growth premium is not yet self-funding, so I feel the multiple is only partly justified by the 12.4% revenue growth. NEE’s 17.4% one-year total return also outpaced XEL, PCG, SO and DUK, which tells me the market has already rewarded the stronger growth profile; in my view, that makes the valuation look more demanding, not less. Using peer EV/Revenue of 3.7x to 5.9x on NEE’s $28.7B revenue gives an implied EV of $106.2B to $169.2B, or about $45.9 to $78.9 per share after netting debt and cash and dividing by 2.1B shares, which is below the current share price and suggests the stock already prices in a cleaner cash conversion than the data shows.
Profitability
| Company | Operating Margin (TTM) | Net Margin (TTM) | Return on Assets (TTM) | Return on Equity (TTM) | Gross Margin (TTM) | EBITDA Margin (TTM) |
|---|---|---|---|---|---|---|
| NEE | 31.5% | 32.4% | 2.4% | 11.7% | 61.0% | 50.8% |
| XEL | 22.7% | 15.3% | 2.4% | 9.9% | 46.8% | 41.9% |
| PCG | 24.8% | 11.8% | 2.6% | 9.3% | 39.8% | 40.5% |
| SO | 29.6% | 15.4% | 3.3% | 11.5% | 48.3% | 47.2% |
| DUK | 27.5% | 16.0% | 2.8% | 9.9% | 52.0% | 50.7% |
Source: Yahoo Finance
NEE’s 31.5% operating margin, 32.4% net margin, 61.0% gross margin and 50.9% EBITDA margin all lead XEL, PCG, SO and DUK, whose operating margins range from 22.7% to 29.6% and EBITDA margins from 40.5% to 50.7%. The gap looks structural rather than cyclical because NEE’s gross margin is also higher than every peer except SO’s 48.3%, which means the advantage is not just lower overhead but a better cost structure through the income statement. ROE of 11.7% is also above XEL, PCG and DUK, but the 2.4% ROA tells me that leverage is doing a lot of the work, so the quality of the return is not as strong as the headline number suggests.
Leverage
| Company | Total Debt/Equity % (mrq) | Current Ratio (mrq) | Total Debt (mrq, USD Mil) | Operating Cash Flow TTM (USD Mil) | Free Cash Flow TTM (USD Mil) | Net Debt/EBITDA (TTM) | FCF Margin % (TTM) |
|---|---|---|---|---|---|---|---|
| NEE | 161.7 | 0.5 | 110,197 | 13,803 | -17,766.9 | 7.4 | -61.9% |
| XEL | 173.1 | 0.7 | 41,651 | 4,771 | -7,908 | 6.5 | -54.1% |
| PCG | 189.4 | 1.2 | 64,703 | 8,147 | -6,150.1 | 6.1 | -23.8% |
| SO | 182.1 | 0.8 | 77,087 | 10,651 | -3,913.4 | 5.2 | -13.0% |
| DUK | 162.2 | 0.7 | 92,206 | 11,562 | -4,477.4 | 5.5 | -13.7% |
Source: Yahoo Finance
NEE’s 161.7% debt/equity and 7.4x net debt/EBITDA are the heaviest in the group, above XEL’s 173.1% and 6.5x, PCG’s 189.4% and 6.1x, SO’s 182.1% and 5.2x and DUK’s 162.2% and 5.5x. The more telling point is FCF margin: NEE’s -61.9% is far weaker than PCG’s -23.8%, SO’s -13.0% and DUK’s -13.7%, so the balance sheet is not just a financing choice, it is a real cash conversion risk that limits flexibility if growth slows. That also helps explain why NEE’s 11.7% ROE can coexist with only 2.4% ROA: the market is paying for equity returns that are partly leverage-driven, while peers with lower cash strain look less stretched.
Conclusion
I would put my rating as a Hold because the key tension is not whether NextEra can grow, but whether that growth can finally fund itself. The company’s 12.5% year-over-year revenue growth in Q2 2026 and 50.9% EBITDA margin in TTM show a premium utility platform, but that strength is offset by a 7.4x net debt to EBITDA ratio and negative 10.4% free cash flow yield, which means the buildout is still being financed rather than self-financing. The recent Dominion agreement, the FPL leadership transition and the long-dated bond issuance all support the moat, but they also underline how much capital the model still consumes. I do not see the leverage problem as a thesis breaker yet, but I do think it is the main reason the stock should stay in the middle of the scale.
I would raise my rating more towards a Buy if free cash flow turns positive and net debt to EBITDA falls below 6.0x, meaning cash generation is finally catching up with the buildout and the balance sheet is starting to de-risk. If that happened alongside another quarter of revenue growth above 10%, the premium multiple would look much easier to defend because the earnings base would be proving itself in cash, not just in reported profit. I would move from Hold to Sell if the cash burn persists and leverage stays above 7.0x net debt to EBITDA while revenue growth slows below 8%, because that would mean the market is paying for a growth profile that is no longer translating into balance-sheet improvement. In that case, the current 10.1x EV to revenue would look less like a quality premium and more like a cash-flow gap that investors are being asked to overlook.
Weighing both sides, I lean to the bull case on operating quality but not enough to ignore the financing strain. The next decisive move is not another quarter of good earnings, it is whether those earnings start to fund the buildout, and until that happens I think the stock deserves to stay in the middle of the scale rather than one rung higher.
What to Watch Next
- FCF margin turning positive — would show the buildout is finally self-funding.
- Net debt/EBITDA below 6.0x — would signal balance-sheet repair.
- Revenue growth above 10% — would support keeping the premium multiple.
- Current ratio staying near 0.5x — would keep refinancing risk elevated.
- Dominion merger approvals — would confirm whether the strategic expansion can close.
What’s your take? I rated NextEra Energy (NEE) HOLD above — but the goal here is to get this right, not just to publish an opinion. What would you add to this analysis, or which risk or catalyst do you think I’m under- or over-weighting? Tell me in the comments.
Sources
- SEC 10-K Annual Report — filed 2026-02-13
- SEC 8-K Filing (2026-06-01)
- SEC 8-K Filing (2026-05-27)
- SEC 8-K Filing (2026-05-26)
- SEC 8-K Filing (2026-05-18)
- SEC 8-K Filing (2026-05-18)
- SEC 8-K Filing (2026-04-23)
- SEC Form 4 Insider Transaction (2026-05-08)
- SEC Form 4 Insider Transaction (2026-04-07)
- SEC Form 4 Insider Transaction (2026-03-18)
- SEC 10-K Annual Report — FY2026
- SEC 10-K Annual Report — FY2025
- SEC 10-K Annual Report — FY2024
- SEC 10-K Annual Report — FY2023
- SEC 10-K Annual Report — FY2022
Data sourced from Yahoo Finance and SEC EDGAR. Not investment advice.
Leave a Comment