
Expected price range
Each range is set from the stock’s recent price history and our Hold rating, using its own 1-year realised volatility (25% annualised) as the width of a ~68% statistical band, and checked against that rating so the range leans the same way as our view. Starting price $74.53 (close 2026-10-30). The stock traded between $67.97 and $79.40 over the last 6 months and between $56.51 and $79.40 over the last year. This is an illustration of where our view and normal volatility point, not a forecast, price target or investment advice; the stock can move outside it.
| Company | Oct 25 | Nov 25 | Dec 25 | Jan 26 | Feb 26 | Mar 26 | Apr 26 | May 26 | Jun 26 | Jul 26 | Aug 26 | Sep 26 | 12-Mo |
|---|---|---|---|---|---|---|---|---|---|---|---|---|---|
| WMB | -9% | +5% | -1% | +12% | +11% | -2% | +5% | -6% | +5% | -4% | +5% | -9% | +11% |
| EXE | -3% | +19% | -9% | +2% | -4% | +2% | -7% | -8% | -2% | +3% | +5% | -14% | -19% |
| KMI | -7% | +5% | +1% | +11% | +10% | +1% | -2% | -5% | +3% | +1% | +1% | -6% | +11% |
| TRGP | -7% | +14% | +5% | +9% | +17% | +6% | +4% | -2% | +5% | +1% | +9% | -8% | +65% |
| DTM | -3% | +11% | -1% | +5% | +10% | -2% | +10% | -5% | +5% | -6% | -5% | -8% | +9% |
| WES | -2% | +5% | +0% | +5% | +3% | -1% | +6% | +1% | +2% | +9% | +3% | -8% | +23% |
Source: Yahoo Finance monthly adjusted close.
Quick Thesis
- Rated Hold — durable fee-based pipes, but valuation already prices in quality.
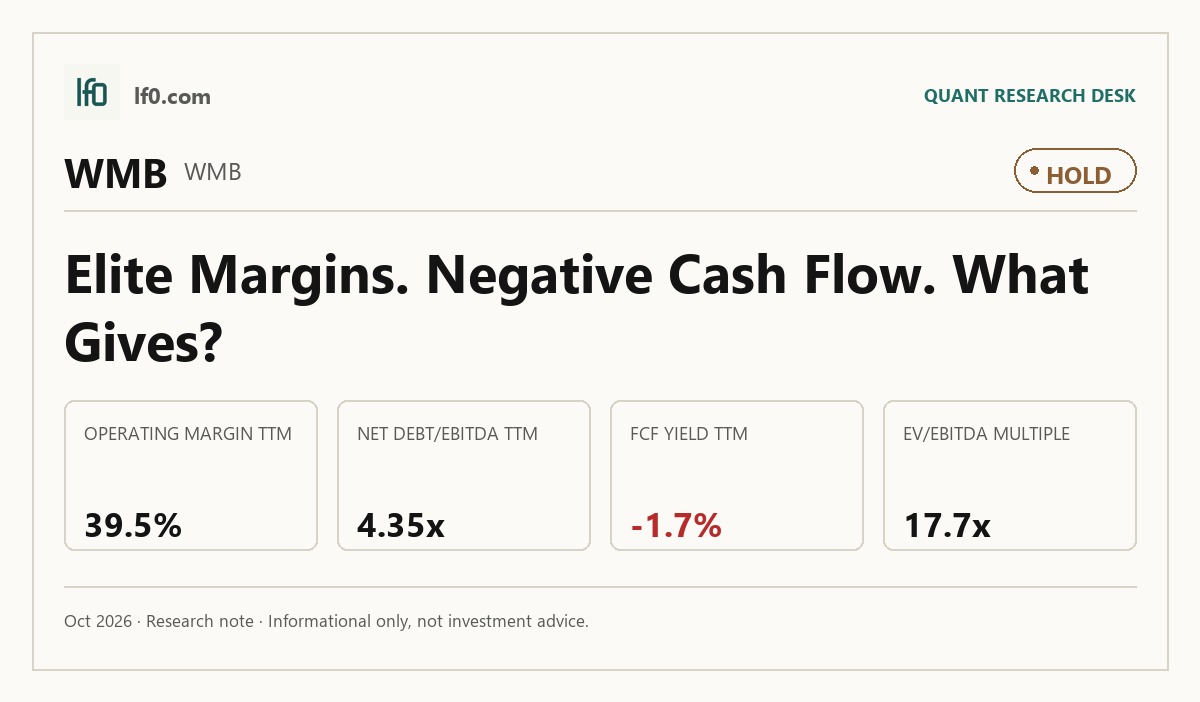
- Strongest strength: 39.5% operating margin TTM.
- Main risk: 4.35x net debt/EBITDA and -12.3% FCF margin TTM.
- Valuation is rich versus peers at 10.1x EV/revenue and 17.7x EV/EBITDA.
- I would turn more constructive if free cash flow turns positive and net debt/EBITDA falls below 4.0x.
Executive Summary
Rating: HOLD | WMB
Measured from adjusted close on 2026-10-30 to 2026-10-30. Sell ratings are correct when the stock falls; Hold is tracked as a +/-10% range. Daily-close data, not intraday. Calls are tracked for 182 days from publication, then frozen as a final record.
I would put my rating as a Hold because Williams has a durable, fee-based pipeline franchise, but the stock already prices in a lot of that quality at 10.1x EV/revenue and 17.7x EV/EBITDA while levered free cash flow remains negative $1.5B TTM. The core support is real: Transco’s 20.6 MMdth/d design capacity is fully contracted under long-term firm reservation contracts, which gives the business a steadier earnings base than a pure commodity midstream name.
I would raise my rating more towards a Buy if Williams converts the current capital program into cleaner cash generation, with levered free cash flow turning positive and net debt/EBITDA moving below 4.0x, meaning the balance sheet is no longer leaning so hard on future growth to fund itself. If the $6.1B-$6.7B growth spend starts translating into a higher cash conversion rate, the current premium multiple would look easier to defend.
I would move from Hold to Sell if the contract base starts to fray, especially if a major customer at Transco or NWP pushes for weaker terms or if FERC outcomes pressure tariff rates enough to pull cash flow below the level needed to support the dividend and debt load. The clearest downside marker would be net debt/EBITDA moving above 4.5x, because that would signal the company is losing the cushion that currently makes the leverage manageable.
Company Profile
Williams Companies gathers, processes, transports, stores, fractionates, and markets natural gas and natural gas liquids, while also operating crude oil transportation and power infrastructure projects. It earns most of its revenue from fee-based gathering and processing contracts, regulated interstate pipeline transportation and storage, market-based storage, and commodity marketing activities.
The company operates in 11 supply areas across the United States, with more than 32,000 miles of pipelines in 24 states and the Gulf of America, 35 gas processing plants, 9 NGL fractionation facilities, 23 million barrels of NGL storage, and 423 Bcf of gas storage. That footprint matters because the business is built around interconnected infrastructure, not a single asset or basin, so the revenue base depends on network scale as much as on commodity volumes.
Economic Moat
Business Model
The most defensible part of the model is the long-dated, fee-based contract base on Williams’ interstate pipeline and storage system. I feel that a well-funded competitor would struggle to replicate it within 3 years because the asset footprint, regulatory approvals, and customer relationships are already embedded in the system.
Transco’s system had a design capacity of approximately 20.6 MMdth/d at December 31, 2025, and Williams’ interstate pipelines are fully contracted under long-term firm reservation contracts with high credit quality customers. The straight fixed-variable rate design shifts most fixed costs into reservation charges and reduces volume sensitivity, so the cash flows are tied to reserved capacity rather than spot throughput.
The company’s integrated footprint across gathering, processing, fractionation, storage, and marketing adds another layer of protection. In my view, that breadth makes customer displacement harder because a rival would need to replace multiple linked services, not just one pipe.
Business & Operating Risks
The most material risk is contract and volume concentration at Transco and NWP, because the filing names Duke Energy Corporation at 9.0% of Transco operating revenue and Puget Sound Energy, Inc. at 31.0% of NWP operating revenue for the year ended December 31, 2025. If either customer loses contracted volumes or renegotiates on weaker terms, the hit would flow straight into cash available for dividends and debt service.
Regulatory and rate case exposure is the next issue. According to the risk factors in their SEC 10-K, Transco and NWP face FERC proceedings, challenges to tariff rates, and the possibility that negotiated rate contracts will not adjust for higher costs, while Transco’s offshore IT feeder charge can push producers toward alternative pipes because it lowers netback prices. That is not just boilerplate: successful complaints or protests can reduce tariff rates and revenues.
A third risk is execution on growth projects, including the new power innovation work tied to data center demand. The filing says Williams may not be able to grow or effectively manage growth, and it highlights risks around accurately predicting future power needs of data centers, underutilized or stranded assets, and the need to source turbines, batteries, and transmission capability on time.
The disclosed risks do not break the moat, but they do test it: the contract and rate risks strike directly at the managed, reservation-based cash flow advantage that the Transco system is supposed to provide.
Management Discussion & Analysis
Management is signaling a heavier capital program, not a pause, and that is the right response to the moat risks above because it keeps the contracted asset base growing even as rate and volume pressure remain a watch item. 2026 growth capital and investment expenditures are expected to range from $6.1 billion to $6.7 billion, excluding acquisitions and certain long-lead time equipment for power innovation projects that are backed by reimbursement if cancelled.
The mix of projects is telling. The 2026 plan is anchored by fully contracted Transco expansions, Haynesville growth, Northeast G&P projects, and the Socrates power innovation project, a 10-year, primarily fixed-price power purchase agreement for 400 megawatts of onsite power generation capacity. The fixed-price structure on Socrates and the fully subscribed Southeast Supply Enhancement, which is expected to add 1,597 Mdth/d as early as the third quarter of 2027, support visibility, but the company is also committing capital to Louisiana LNG and Driftwood Pipeline, both of which will require additional capital.
The credibility test is mixed but not weak. In 2025, management said growth would come from Transco expansions, Louisiana Energy Gateway, and higher Haynesville volumes, and the year-end results did show service revenues up 9.4% to $8.3B and Transco transportation service revenues up 9.7% to $2.9B. That is consistent with the moat thesis: the network is still monetizing contracted additions rather than relying on a one-quarter spike.
The weaker point is cash conversion. Gas & NGL Marketing Services Modified EBITDA swung from negative $124M in 2024 to $311M in 2025 on derivative marks and lower commodity margins, which tells me the earnings base is still more volatile than the headline contract story suggests. Management is clearly leaning into expansion, but the balance sheet is doing some of the heavy lifting while the new projects mature.
Recent Events
The most significant development was the May 19, 2026 credit agreement amendment, disclosed on May 20, 2026, which gives Williams Companies, Northwest Pipeline, and Transco up to $3.75B of borrowing capacity, expandable to $4.25B, with a five-year tenor and a leverage covenant of 5.0x debt to EBITDA. I read that as a liquidity backstop that supports the moat, because it preserves funding flexibility for working capital, acquisitions, and capital spending without forcing near-term equity issuance.
Governance changes were more modest. On May 4, 2026, stockholders approved a larger 2007 Incentive Plan, raising issuable shares from 50.0M to 85.0M and removing the plan expiration date, while also approving a larger employee stock purchase plan. That supports retention and alignment, but it also increases potential dilution, so I view it as a mild offset to the otherwise constructive liquidity update.
Alan S. Armstrong resigned from the board on March 23, 2026 after his Senate appointment, and the board size fell from 12 to 11. That is a leadership change, but not a strategic disruption, and the recent 8-K set leaves the moat intact while improving the company’s funding flexibility.
Financial Analysis
Growth
WMB — Financial Growth (Quarterly, USD Mil)
| Metric | 2025-03-31 | 2025-06-30 | 2025-09-30 | 2025-12-31 | 2026-03-31 | 2026-06-30 |
|---|---|---|---|---|---|---|
| REVENUE (USD Mil) | — | 2,781 | 2,923 | 3,198 | 3,030 | 3,053 |
| EBIT (USD Mil) | — | 1,107 | 1,301 | 1,388 | 1,532 | 1,507 |
| EBITDA (USD Mil) | — | 1,712 | 1,865 | 1,981 | 2,116 | 2,099 |
| NET INCOME (USD Mil) | — | 546 | 647 | 734 | 865 | 827 |
| DILUTED EPS | 0.6 | 0.5 | 0.5 | — | 0.7 | 0.7 |
Source: Yahoo Finance — Quarterly Financial Statements
Revenue rose from $2.8B in Q2 2025 to $3.2B in Q4 2025, then stayed near $3B in Q1 2026 and $3.1B in Q2 2026. The year-over-year pace was 9.5%, 10.4%, 10.1%, 8.9%, and 9.8% across those quarters, so growth is steady rather than accelerating.
EBITDA grew faster than revenue, from $1.7B in Q2 2025 to $2.1B in Q1 2026, while net income also outpaced sales. That is the right pattern for a fee-based midstream business: the network is still adding earnings leverage, which supports the moat thesis rather than just adding scale.
Profitability
WMB — Profitability (TTM)
| Metric | TTM |
|---|---|
| Operating Margin (TTM) | 39.5% |
| Net Margin (TTM) | 24.9% |
| Return on Assets (TTM) | 5.0% |
| Return on Equity (TTM) | 21.5% |
| Gross Margin (TTM) | 63.6% |
| EBITDA Margin (TTM) | 57.1% |
Source: Yahoo Finance — Trailing Twelve Months (TTM)
TTM operating margin was 39.5%, gross margin was 63.6%, and EBITDA margin was 57.1%, which points to a capital-intensive but highly profitable infrastructure model. The 24.1-point gap between gross and operating margin shows that operating expenses and regulatory costs still take a meaningful share of revenue, but the business is already converting most of its gross profit into operating earnings.
TTM net margin of 24.9% confirms that the model is well past the startup phase and is producing substantial bottom-line profit. TTM return on assets of 5.0% and return on equity of 21.5% show efficient asset use, although the much higher ROE than ROA suggests leverage is amplifying returns rather than pure asset productivity alone.
Valuation
WMB — Valuation Multiples
| Metric | Value |
|---|---|
| Current Share Price (USD) | 74.5 |
| Market Cap (USD Mil) | 91,181 |
| Enterprise Value (USD Mil) | 124,394 |
| Trailing P/E | 29.7 |
| Forward P/E | 28.4 |
| Price/Sales (TTM) | 7.4 |
| Price/Book (mrq) | 6.9 |
| EV/Revenue | 10.1 |
| EV/EBITDA | 17.7 |
| Beta (5Y Monthly) | 0.66 |
| FCF Yield % (TTM) | -1.7% |
| Forward EPS (USD) | 2.6 |
| Analyst Target Price – Low (USD) | 69 |
| Analyst Target Price – Mean (USD) | 85.4 |
| Analyst Target Price – High (USD) | 103 |
| # Analyst Opinions | 24 |
Source: Yahoo Finance
WMB trades at 10.1x EV/revenue and 17.7x EV/EBITDA on a current share price of $74.5, with a 29.7x trailing P/E and 28.4x forward P/E. Price/sales is 7.4x and price/book is 6.9x, so the stock trades at a large premium to accounting equity, which is consistent with a franchise whose value comes from contracted pipeline cash flows rather than replacement cost.
FCF yield is -1.7%, and levered free cash flow is -$1.5B TTM, so cash conversion is currently weak relative to the share price. Beta is 0.66, which fits a lower-volatility utility-like profile, but the valuation still looks full because the market is paying for durability before it is seeing free cash flow.
On the analysis here, I would put fair value in a range of roughly $70–$86 per share. That sits inside the $69–$103 analyst target range from 24 opinions, but closer to the lower half because I weight the negative free cash flow and 4.35x net debt/EBITDA more heavily than the consensus appears to. Forward EPS is 2.6, which implies about 28.4x forward earnings at the current price; that is rich versus peers on a like-for-like basis because the earnings base is solid, but not cheap enough to offset the leverage and cash conversion gap.
Leverage
WMB — Leverage & Coverage (Quarterly)
| Metric | Value |
|---|---|
| Total Debt/Equity % (mrq) | 200.4 |
| Current Ratio (mrq) | 0.5 |
| Total Debt (mrq, USD Mil) | 30,793 |
| Operating Cash Flow (TTM, USD Mil) | 5,994 |
| Levered Free Cash Flow (TTM, USD Mil) | -1,516.8 |
| Net Debt/EBITDA (TTM) | 4.3 |
| FCF Margin % (TTM) | -12.3% |
Source: Yahoo Finance — Quarterly Financial Statements
Total debt was $30.8B mrq, with total debt/equity of 200.4% mrq and a current ratio of 0.5 mrq, so the balance sheet is levered and near-term liquidity is tight. Operating cash flow was $6B TTM, while levered free cash flow was -$1.5B TTM and FCF margin was -12.3%, which means EBITDA is not converting cleanly into cash because capex and other cash uses are absorbing more than the business generates.
Net debt/EBITDA was 4.35x TTM, a level that still leaves refinancing risk manageable because the company has strong recurring pipeline cash flows, but it also means debt reduction will depend on sustained cash generation rather than balance-sheet flexibility alone. I would not call that a distress profile, but it is tight enough that the valuation premium needs to be justified by continued execution.
Insider Activity
The insider transaction record is one-sided selling, with 24 open-market sales and 0 open-market purchases across 107 filings from 2025-01-02 to 2026-06-01. The pattern is broad rather than isolated, led by the CFO’s 50,000-share sale on 2026-05-06 and additional sales by multiple senior officers, which suggests limited insider conviction at current prices.
That said, the signal is less decisive than it would be at a founder-led company because insider ownership is only 0.5%. I still read the activity as a bearish sentiment marker, but not as a standalone thesis breaker.
Comparable Analysis
Growth
| Company | Revenue TTM (USD Mil) | Revenue Growth YoY % | EBITDA TTM (USD Mil) | Diluted EPS TTM |
|---|---|---|---|---|
| WMB | 12,323 | 7.8% | 7,033 | 2.5 |
| EXE | 12,950 | 11.6% | 6,689 | 11.6 |
| KMI | 18,344 | 9.3% | 7,680 | 1.6 |
| TRGP | 16,741.5 | 4.2% | 5,497.7 | 10.5 |
| DTM | 1,310 | 11.0% | 920 | 4.6 |
| WES | 4,332.3 | 30.0% | 2,502.9 | 3.2 |
Source: Yahoo Finance
WMB’s revenue growth of 7.8% TTM sits below EXE at 11.6% and WES at 30.0%, but above KMI at 9.3%, DTM at 11.0%, and TRGP at 4.2%. The gap says WMB is not the fastest grower in the group, so its premium multiple is harder to justify on growth alone; investors are paying for quality and scale rather than superior top-line acceleration.
Valuation
| Company | Current Share Price (USD) | Trailing P/E | Forward P/E | EV/Revenue | EV/EBITDA | Price/Sales (TTM) | Price/Book (mrq) | Market Cap (USD Mil) | Enterprise Value (USD Mil) | Beta (5Y Monthly) | FCF Yield % (TTM) | Forward EPS | Analyst Target Price – Low | Analyst Target Price – Mean | Analyst Target Price – High | # Analyst Opinions |
|---|---|---|---|---|---|---|---|---|---|---|---|---|---|---|---|---|
| WMB | 74.5 | 29.7 | 28.4 | 10.1 | 17.7 | 7.4 | 6.9 | 91,181 | 124,394 | 0.66 | -1.7% | 2.6 | 69 | 85.4 | 103 | 24 |
| EXE | 90.6 | 7.8 | 10.3 | 2 | 3.8 | 1.6 | 1.1 | 20,913 | 25,440 | 0.40 | 6.5% | 8.8 | 92 | 123 | 156 | 27 |
| KMI | 33.8 | 20.9 | 21.9 | 6 | 14.2 | 4.1 | 2.4 | 75,397 | 109,384 | 0.58 | 1.4% | 1.5 | 32 | 37.5 | 43 | 22 |
| TRGP | 314.4 | 30.1 | 25.9 | 5.2 | 15.7 | 4 | 18.4 | 67,416 | 86,567 | 0.80 | 0.1% | 12.1 | 294 | 330.2 | 359 | 21 |
| DTM | 126 | 27.6 | 25.1 | 12.4 | 17.7 | 9.8 | 2.7 | 12,852 | 16,297 | 0.74 | 1.0% | 5 | 121 | 149.7 | 170 | 15 |
| WES | 46.1 | 14.6 | 12 | 6.5 | 11.2 | 4.4 | 4.5 | 19,041 | 28,104 | 0.71 | 4.5% | 3.9 | 41 | 49.5 | 59 | 13 |
Source: Yahoo Finance
WMB trades at 10.1x EV/revenue, 29.7x trailing P/E, 28.4x forward P/E, and a negative 1.7% FCF yield, versus EXE at 2.0x, 7.8x, 10.3x, and 6.5%, KMI at 6.0x, 20.9x, 21.9x, and 1.4%, TRGP at 5.2x, 30.1x, 25.9x, and 0.1%, DTM at 12.4x, 27.6x, 25.1x, and 1.0%, and WES at 6.5x, 14.6x, 12.0x, and 4.5%. WMB screens expensive, and the negative FCF yield is the clearest warning because it says the stock is not being backed by cash conversion.
On a peer-multiple basis, WMB looks rich relative to the group, but not absurdly so given its scale and contract quality. The more important point is that the market is paying for a premium profile before free cash flow has caught up, which is why the valuation case is more fragile than the headline multiple alone suggests.
Profitability
| Company | Operating Margin (TTM) | Net Margin (TTM) | Return on Assets (TTM) | Return on Equity (TTM) | Gross Margin (TTM) | EBITDA Margin (TTM) |
|---|---|---|---|---|---|---|
| WMB | 39.5% | 24.9% | 5.0% | 21.5% | 63.6% | 57.1% |
| EXE | 23.2% | 21.3% | 8.2% | 14.6% | 45.9% | 51.6% |
| KMI | 24.0% | 19.6% | 4.4% | 11.4% | 48.6% | 41.9% |
| TRGP | 27.8% | 13.5% | 9.2% | 70.8% | 43.2% | 32.8% |
| DTM | 50.4% | 35.7% | 4.0% | 9.9% | 75.3% | 70.2% |
| WES | 41.7% | 29.0% | 7.5% | 34.1% | 68.7% | 57.8% |
Source: Yahoo Finance
WMB’s 39.5% operating margin, 24.9% net margin, 63.6% gross margin, and 57.1% EBITDA margin all lead EXE at 23.2%, 21.3%, 45.9%, and 51.6%, KMI at 24.0%, 19.6%, 48.6%, and 41.9%, TRGP at 27.8%, 13.5%, 43.2%, and 32.8%, DTM at 50.4%, 35.7%, 75.3%, and 70.2%, and WES at 41.7%, 29.0%, 68.7%, and 57.8%. The spread is mostly structural, not cyclical: WMB’s margins are strong but not best in class, and DTM’s higher gross and operating margins point to a more fee-like, less commodity-exposed mix.
Leverage
| Company | Total Debt/Equity % (mrq) | Current Ratio (mrq) | Total Debt (mrq, USD Mil) | Operating Cash Flow TTM (USD Mil) | Free Cash Flow TTM (USD Mil) | Net Debt/EBITDA (TTM) | FCF Margin % (TTM) |
|---|---|---|---|---|---|---|---|
| WMB | 200.4 | 0.5 | 30,793 | 5,994 | -1,516.8 | 4.3 | -12.3% |
| EXE | 23.9 | 0.9 | 4,670 | 5,631 | 1,366.8 | 0.7 | 10.5% |
| KMI | 101.7 | 0.7 | 33,397 | 6,733 | 1,075.5 | 4.2 | 5.9% |
| TRGP | 515.8 | 0.8 | 19,578 | 4,285.5 | 65.8 | 3.5 | 0.4% |
| DTM | 68.5 | 1.4 | 3,373 | 937 | 128 | 3.5 | 9.8% |
| WES | 207.4 | 0.9 | 9,129 | 2,132.5 | 867 | 3.6 | 20.0% |
Source: Yahoo Finance
WMB’s 200.4% debt-to-equity and 4.35x net debt/EBITDA are heavier than EXE’s 23.9% and 0.7x, KMI’s 101.7% and 4.2x, TRGP’s 515.8% and 3.5x, DTM’s 68.5% and 3.5x, and WES’s 207.4% and 3.6x. The more telling read is the cash flow line: WMB’s free cash flow margin is -12.3%, while EXE is 10.5%, KMI 5.9%, TRGP 0.4%, DTM 9.8%, and WES 20.0%, which means WMB is funding growth and distributions with a tighter cash cushion than most peers.
Conclusion
The tension in this name is straightforward: Williams has a durable, contracted infrastructure franchise, but the market is already paying for that durability while free cash flow is still negative and leverage remains elevated. That is why I stay at Hold rather than moving to Buy.
The bull case is that the current capital program converts into cleaner cash generation. If levered free cash flow turns positive and net debt/EBITDA falls below 4.0x, meaning the balance sheet is no longer leaning so hard on future growth to fund itself, I would move more towards a Buy. I would also want to see operating margin stay near 40% while revenue holds above $3B per quarter, because that would show the new projects are adding earnings rather than just adding scale.
The bear case is a deterioration in the contract base or a rate setback. If a major customer at Transco or NWP pushes for weaker terms, or if FERC outcomes pressure tariff rates enough to pull cash flow below the level needed to support the dividend and debt load, I would move from Hold to Sell. Net debt/EBITDA above 4.5x would be the clearest warning sign, because it would show the cushion that currently makes the leverage manageable is slipping.
I lean to Hold because the bull case depends on execution that is already underway, while the bear case depends on a deterioration in contracted cash flow that has not shown up yet. The stock is not cheap enough for me to call it a Buy, but the contract structure and liquidity backstop keep me from turning more negative.
What to Watch Next
- Levered free cash flow turning positive — would support a move toward Buy.
- Net debt/EBITDA below 4.0x — would show the balance sheet is easing.
- Operating margin staying near 40% — would confirm earnings quality from new projects.
- Revenue holding above $3B per quarter — would support the growth case.
- Net debt/EBITDA above 4.5x — would raise the risk of a Sell call.
What’s your take? I rated Williams Companies (WMB) HOLD above — but the goal here is to get this right, not just to publish an opinion. What would you add to this analysis, or which risk or catalyst do you think I’m under- or over-weighting? Tell me in the comments.
Our track record: every directional call is tracked publicly on The Scorecard, and Stocks Covered lists every company we have rated and when.
Sources
- SEC 10-K Annual Report — filed 2026-02-24
- SEC 8-K Filing (2026-05-20)
- SEC 8-K Filing (2026-05-04)
- SEC 8-K Filing (2026-05-04)
- SEC 8-K Filing (2026-03-26)
- SEC 8-K Filing (2026-02-10)
- SEC 8-K Filing (2026-01-08)
- SEC Form 4 Insider Transaction (2026-06-02)
- SEC Form 4 Insider Transaction (2026-05-20)
- SEC Form 4 Insider Transaction (2026-05-18)
- SEC 10-K Annual Report — FY2026
- SEC 10-K Annual Report — FY2025
- SEC 10-K Annual Report — FY2024
- SEC 10-K Annual Report — FY2023
- SEC 10-K Annual Report — FY2022
Data sourced from Yahoo Finance and SEC EDGAR. Not investment advice.
Leave a Comment