Expected price range
Each range is set from the stock’s recent price history and our Hold rating, using its own 1-year realised volatility (48% annualised) as the width of a ~68% statistical band, and checked against that rating so the range leans the same way as our view. Starting price $266 (close 2026-10-29). The stock traded between $219 and $333 over the last 6 months and between $184 and $333 over the last year. This is an illustration of where our view and normal volatility point, not a forecast, price target or investment advice; the stock can move outside it.
| Company | Oct 25 | Nov 25 | Dec 25 | Jan 26 | Feb 26 | Mar 26 | Apr 26 | May 26 | Jun 26 | Jul 26 | Aug 26 | Sep 26 | 12-Mo |
|---|---|---|---|---|---|---|---|---|---|---|---|---|---|
| NXPI | -8% | -7% | +12% | +4% | +0% | -13% | +49% | +9% | -12% | -18% | -2% | +6% | +6% |
| STM | -13% | -6% | +13% | +8% | +21% | +3% | +60% | +26% | +8% | -30% | -4% | +7% | +91% |
| IFNNY | +1% | +7% | +4% | +11% | +11% | -16% | +48% | +43% | -2% | -24% | -8% | +3% | +74% |
| ASML | +10% | +0% | +1% | +33% | +2% | -9% | +9% | +12% | +23% | -18% | +4% | +7% | +88% |
| ON | +2% | +0% | +8% | +11% | +11% | -7% | +63% | +20% | -22% | -14% | -9% | +4% | +56% |
| TXN | -11% | +4% | +3% | +25% | -2% | -8% | +45% | +9% | -2% | -7% | -5% | +7% | +56% |
Source: Yahoo Finance monthly adjusted close.
Quick Thesis
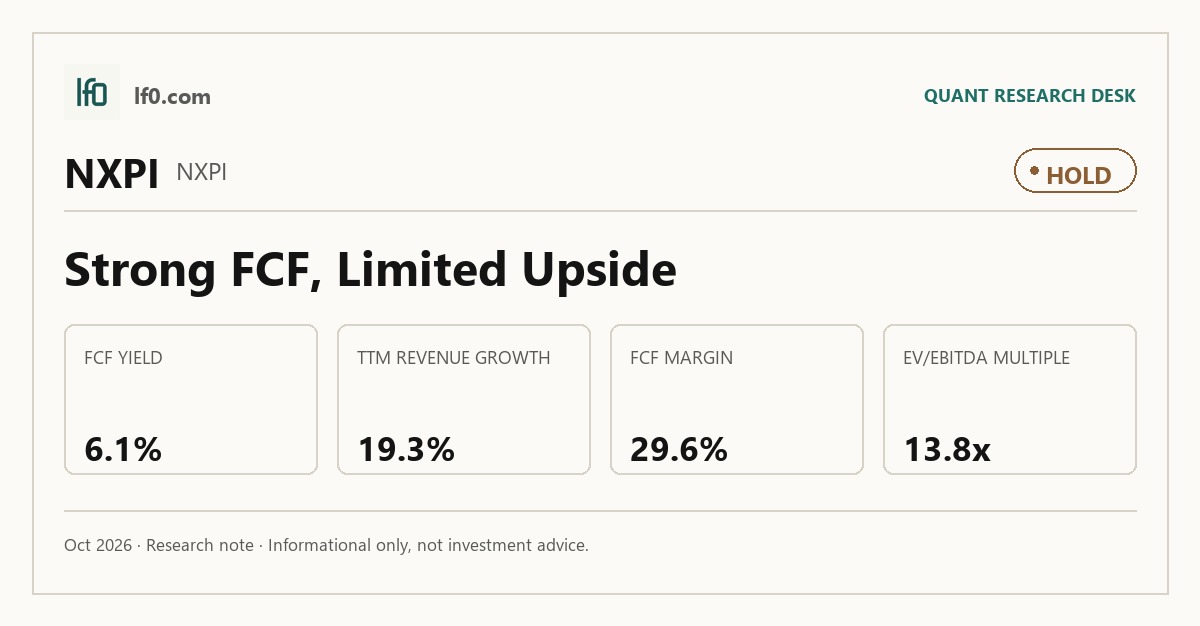
- Rated Hold — cash generation is solid, but the stock already prices in a recovery.
- Strongest support: 4.1B of levered free cash flow TTM and a 29.6% FCF margin.
- Main risk: 11B of debt and 1.3x net debt/EBITDA leave less room for a downturn.
- Valuation is fair, not cheap: 13.8x EV/EBITDA and 6.1% FCF yield.
- I would raise the rating if revenue holds above 3.5B for two quarters and operating margin stays above 30.0%.
Executive Summary
Rating: HOLD | NXPI
Measured from adjusted close on 2026-10-30 to 2026-10-30. Sell ratings are correct when the stock falls; Hold is tracked as a +/-10% range. Daily-close data, not intraday. Calls are tracked for 182 days from publication, then frozen as a final record.
I would put my rating as a Hold because NXP Semiconductors is already priced for a solid recovery, yet the latest numbers still show a business that needs cleaner proof of durable acceleration. FY2025 revenue was $12.3B and TTM free cash flow was $4.1B, so the company is still converting sales into cash at a healthy rate, but the 23.4% net margin and 29.6% FCF margin are not enough on their own to justify a more aggressive stance at 5.4x EV/Revenue and 13.8x EV/EBITDA. I would raise my rating more towards a Buy if revenue can hold above 3.5B for two consecutive quarters and operating margin stays above 30.0%, meaning the mix shift is still flowing through to profit.
Company Profile
NXP Semiconductors N.V. designs and sells semiconductors for automotive, industrial and Internet of Things, mobile, and communication infrastructure applications. It earns revenue through direct sales and distributors, and Avnet accounted for 23% of FY2025 revenue, which shows the business still relies on a concentrated channel partner even as it serves global end customers.
The company was incorporated in the Netherlands in 2006 and has more than 70 years of operating history through its predecessor businesses. Its corporate seat and principal executive office are in Eindhoven, the Netherlands, and it is listed on Nasdaq under NXPI.
NXP operates in more than 30 countries with about 32,169 employees worldwide as of December 31, 2025, including 1,439 at its SSMC joint venture. It runs a hybrid manufacturing network with owned fabs, joint ventures, and third-party foundries, and it is shifting capacity toward 300 mm factories through ESMC in Dresden, targeted for 2028, and VSMC in Singapore, targeted for 2027.
Economic Moat
Business Model
The most defensible advantage is the combination of automotive system knowledge, proprietary semiconductor content, and long qualification cycles that make switching costly. In NXP Semiconductors N.V.’s 2025 10-K, the automotive market is described as having stringent qualification processes, zero-defect quality requirements, functionally safe design architecture, high reliability, extensive design-in timeframes, and long product life cycles, and I feel that is the hardest element for a well-funded competitor to replicate within 3 years because it depends on years of design-in work, not just capital.
That advantage is reinforced by NXP’s broad portfolio of approximately 9,500 patent families and its broad Arm processor portfolio, which supports system-level selling rather than single-chip competition. The company also appears to be gaining ground in software-defined vehicles because the 2025 acquisitions of TTTech Auto, a provider of safety-critical systems and middleware for software-defined vehicles, Aviva Links, a provider of Automotive SerDes Alliance-compliant in-vehicle connectivity, and Kinara, a provider of programmable discrete neural processing units, extend the automotive and industrial platform rather than merely add scale. In my view, the secondary moat is the hybrid manufacturing model, including the 61.2% owned Singapore joint venture at SSMC and the planned 300 mm transition through ESMC in Dresden and VSMC in Singapore, because it supports differentiated process technology while preserving manufacturing flexibility.
Business & Operating Risks
The biggest disclosed risk is a demand and cycle shock across NXP Semiconductors N.V.’s end markets, because the risk factors in their SEC 10-K say the company derives the vast majority of revenue from Automotive, Industrial & IoT, Mobile, and Communication Infrastructure, and those markets can swing with consumer spending, consumer preferences, and macro conditions. The filing also says customers may vary order levels significantly from period to period, request postponements, or reduce lead times, which is exactly the kind of order volatility that can hit revenue visibility and working capital.
A second, closely related risk is price erosion and margin compression, since the filing warns that continued price erosion can force NXP to cut production and procurement costs just to preserve margins. The company also faces competitive and technology execution risk, especially around AI and machine learning, because it must keep introducing new products in a timely manner while meeting the increasing use of AI and machine learning technologies, and it warns that AI adoption may create unintended consequences, cybersecurity exposure, or products that may not meet market requirements or become obsolete earlier than planned.
These risks do touch the moat, but they do not break it outright. In my view, the real threat is not that the automotive design-in advantage disappears; it is that demand swings, pricing pressure, and execution missteps could delay the payoff from that advantage and keep the moat from showing up cleanly in earnings.
Management Discussion & Analysis
Management is trying to respond to those risks through portfolio reshaping and capital discipline, but the payoff is still ahead of the numbers. The 2025 acquisitions of TTTech Auto, Aviva Links, and Kinara deepen the automotive and edge-compute mix, while the MEMS sensors divestiture shows management is pruning non-core assets rather than simply adding scale. At the same time, capital expenditures are expected to stay at a similar percentage of revenue and R&D is also expected to remain similar as a percentage of revenue, so the message is disciplined reinvestment rather than a new spending cycle.
That said, the financial results have not yet fully validated the strategy. Revenue fell 2.7% to $12.3B in 2025, gross margin slipped to 54.7% from 56.4%, and net debt rose to $9B, so the acquisition narrative is not yet showing up in cleaner top-line or margin acceleration. I read that as management taking the right strategic steps while still needing the cycle to cooperate.
Recent Events
The most significant development I see here is the February 6, 2026 amendment and restatement of the revolving credit agreement, which gives NXP Semiconductors N.V. $3B of senior unsecured revolving commitments through February 6, 2031 and includes a $200M letter of credit sub-facility. In my view, that strengthens the balance-sheet backstop and gives the company more flexibility to fund buybacks, dividends, or working capital without near-term refinancing pressure, while the 3.00x consolidated interest coverage covenant still keeps the structure disciplined.
The second material event is the February 4, 2026 retirement notice from Jennifer Wuamett, NXP’s EVP, General Counsel, Secretary and Chief Sustainability Officer, with Michael Hoffmann set to become General Counsel on June 30, 2026. I read that as a manageable leadership transition rather than a thesis break, because the legal function is being handed to an internal successor and Wuamett remains as Chief Sustainability Officer and strategic adviser through December 31, 2026.
NXP also moved on capital returns and debt management in March and April 2026. On March 12, 2026, the board approved a $1.014 quarterly interim dividend, and on April 20, 2026, the company redeemed $750M of 3.875% senior notes due June 2026. Taken together, these actions reinforce a shareholder-friendly capital allocation profile and reduce refinancing risk, so the recent 8-Ks modestly strengthen the investment case.
Financial Analysis
Growth
NXPI — Financial Growth (Quarterly, USD Mil)
| Metric | 2025-09-30 | 2025-12-31 | 2026-03-31 | 2026-06-30 | 2026-09-30 |
|---|---|---|---|---|---|
| REVENUE (USD Mil) | 3,173 | 3,335 | 3,181 | 3,496 | 3,786 |
| EBIT (USD Mil) | 913 | 763 | 1,523 | 1,086 | 1,239 |
| EBITDA (USD Mil) | 1,114 | 978 | 1,702 | 1,270 | 1,431 |
| NET INCOME (USD Mil) | 631 | 455 | 1,122 | 767 | 884 |
| DILUTED EPS | 2.5 | 1.8 | 4.4 | 3 | 3.5 |
Source: Yahoo Finance — Quarterly Financial Statements
NXP’s revenue is accelerating, but not evenly: Q1 2026 revenue was $3.2B, up from $3.2B a year earlier, then Q2 2026 rose to $3.5B and Q3 2026 reached $3.8B, which shows a clear sequential build that supports a stronger second-half run-rate. EBITDA is growing faster than revenue, with EBITDA at $1.7B in Q1 2026 versus $1.1B a year earlier, a 52.9% jump that signals operating leverage rather than just top-line recovery. Net income and diluted EPS are also outpacing revenue, with Q1 2026 net income of $1.1B and EPS of $4.4 versus $631M and $2.5 in the prior-year quarter.
The growth data matters because it ties the moat to the numbers: the automotive and industrial design-in model is finally showing up as faster earnings conversion, not just a larger revenue base. That said, the improvement is still recent enough that I would want another quarter of similar execution before calling it durable.
Profitability
NXPI — Profitability (TTM)
| Metric | TTM |
|---|---|
| Operating Margin (TTM) | 32.3% |
| Net Margin (TTM) | 23.4% |
| Return on Assets (TTM) | 10.8% |
| Return on Equity (TTM) | 28.7% |
| Gross Margin (TTM) | 56.5% |
| EBITDA Margin (TTM) | 39.0% |
Source: Yahoo Finance — Trailing Twelve Months (TTM)
TTM operating margin of 32.3%, gross margin of 56.5%, and EBITDA margin of 39.0% show NXP is already a highly profitable semiconductor business, not an early-stage scaler. The 24.2 percentage point gap between gross margin and operating margin means operating expenses still absorb a large share of revenue, but the business is clearly converting more than half of sales into gross profit, so the issue is scale and mix rather than a broken cost structure.
TTM net margin of 23.4% confirms that most of the operating profit is reaching the bottom line, which is what investors want to see in a mature chip franchise. TTM ROA of 10.8% and ROE of 28.7% point to strong capital efficiency, and the wide ROE-over-ROA spread suggests leverage is amplifying returns rather than creating them. The key watch item is whether operating margin stays above 30.0%, because that would confirm profitability is durable rather than cyclical.
Valuation
NXPI — Valuation Multiples
| Metric | Value |
|---|---|
| Current Share Price (USD) | 266 |
| Market Cap (USD Mil) | 67,046 |
| Enterprise Value (USD Mil) | 74,458 |
| Trailing P/E | 20.9 |
| Forward P/E | 14.5 |
| Price/Sales (TTM) | 4.9 |
| Price/Book (mrq) | 5.5 |
| EV/Revenue | 5.4 |
| EV/EBITDA | 13.8 |
| Beta (5Y Monthly) | 1.81 |
| FCF Yield % (TTM) | 6.1% |
| Forward EPS (USD) | 18.3 |
| Analyst Target Price – Low (USD) | 175 |
| Analyst Target Price – Mean (USD) | 299.9 |
| Analyst Target Price – High (USD) | 400 |
| # Analyst Opinions | 29 |
Source: Yahoo Finance
NXP Semiconductors trades at 5.4x EV/Revenue and 13.8x EV/EBITDA on a current share price of $266, which tells me the market is paying for a cyclical semiconductor franchise with durable cash generation rather than a low-growth utility. The 6.1% FCF yield is the cleanest cheapness signal here because levered free cash flow was $4.1B TTM, or about 16.2 per share, so the stock is not priced as if cash generation is weak.
Trailing P/E is 20.9x and forward P/E is 14.5x, while Price/Sales is 4.9x and Price/Book is 5.5x; those multiples are consistent with a business that is still earning a 23.4% net margin and a 39.0% EBITDA margin, so the market is not assigning a distressed multiple. With 29 analyst opinions, the $175 to $400 target range and $300 mean suggest the Street sees modest upside, not a deep discount. On my read, fair value sits roughly around the current price to the low-$300s, which is inside the analyst range rather than above it, and that is why I do not see a compelling valuation gap. The stock looks fairly valued relative to peers because its 6.1% FCF yield and 29.6% FCF margin support the current multiple, but its 5.4x EV/Revenue is not cheap enough to ignore ASML’s superior profitability and TXN’s stronger long-term return profile.
Leverage
NXPI — Leverage & Coverage (Quarterly)
| Metric | Value |
|---|---|
| Total Debt/Equity % (mrq) | 88.1 |
| Current Ratio (mrq) | 2.1 |
| Total Debt (mrq, USD Mil) | 10,978 |
| Operating Cash Flow (TTM, USD Mil) | 3,800 |
| Levered Free Cash Flow (TTM, USD Mil) | 4,086.6 |
| Net Debt/EBITDA (TTM) | 1.3 |
| FCF Margin % (TTM) | 29.6% |
Source: Yahoo Finance — Quarterly Financial Statements
NXP Semiconductors carries 11B of total debt as of mrq, with a Total Debt/Equity ratio of 88.1% and a current ratio of 2.1x. That balance sheet is not stretched, and the 1.3x net debt/EBITDA ratio shows debt is well covered by earnings before interest, taxes, depreciation, and amortization.
In my opinion, this is moderate refinancing risk rather than high risk because the company also has $3.8B of operating cash flow TTM and $4.1B of levered free cash flow TTM, so it is generating enough cash to fund debt service, acquisitions, and shareholder returns without leaning on the market. The 29.6% FCF margin is the key quality signal here: EBITDA is converting into real cash at a healthy rate, which gives NXP room to absorb a downturn before refinancing becomes a near-term issue.
Insider Activity
The insider transaction record I see here is one-sided: 7 open-market sales, $6M total, and no open-market purchases in the 2025-03-17 to 2026-06-01 window. The selling is broad rather than a single insider’s routine activity, with multiple executives transacting across several dates, which weakens alignment a bit even though the sample is limited. I treat that as a mild bear signal, not a thesis breaker, because it is directionally negative but not large enough on its own to outweigh the operating and cash-flow picture.
Comparable Analysis
LF0 has published standalone analyses of these peers: Texas Instruments (TXN) (rated Hold).
Growth
| Company | Revenue TTM (USD Mil) | Revenue Growth YoY % | EBITDA TTM (USD Mil) | Diluted EPS TTM |
|---|---|---|---|---|
| NXPI | 13,798 | 19.3% | 5,387 | 12.7 |
| STM | 13,669 | 17.9% | 3,027 | 0.6 |
| IFNNY | 15,591 | 12.6% | 4,190 | 1.1 |
| ASML | 39,473.5 | 55.2% | 16,181 | 40.6 |
| ON | 6,197.8 | 9.2% | 2,089.9 | 1.5 |
| TXN | 20,766 | 27.7% | 10,713 | 7.7 |
Source: Yahoo Finance
NXPI’s revenue grew 19.3% in TTM, ahead of STM at 17.9% and IFNNY at 12.6%, but well behind ASML at 55.2% and TXN at 27.7%, so the stock deserves some premium to the slower growers but not a growth multiple that assumes ASML-like scarcity. Quarterly earnings growth of 40.3% for NXPI versus 19.2% at STM and 39.6% at IFNNY supports that view, because NXPI is converting demand into profit faster than most peers even if its top-line pace is not the fastest.
Valuation
| Company | Current Share Price (USD) | Trailing P/E | Forward P/E | EV/Revenue | EV/EBITDA | Price/Sales (TTM) | Price/Book (mrq) | Market Cap (USD Mil) | Enterprise Value (USD Mil) | Beta (5Y Monthly) | FCF Yield % (TTM) | Forward EPS | Analyst Target Price – Low | Analyst Target Price – Mean | Analyst Target Price – High | # Analyst Opinions |
|---|---|---|---|---|---|---|---|---|---|---|---|---|---|---|---|---|
| NXPI | 266 | 20.9 | 14.5 | 5.4 | 13.8 | 4.9 | 5.5 | 67,046 | 74,458 | 1.81 | 6.1% | 18.3 | 175 | 299.9 | 400 | 29 |
| STM | 50 | 87.7 | 18.9 | 3.2 | 14.2 | 3.3 | 2.5 | 44,712 | 43,091 | — | 0.8% | 2.6 | 50 | 72.5 | 93 | 12 |
| IFNNY | 60.6 | 56.6 | 17.8 | 5.4 | 20.2 | 5 | 4 | 78,711 | 84,568 | 1.91 | 2.2% | 3.4 | 71 | 106.5 | 125 | 4 |
| ASML | 1,675.7 | 41.2 | 26.7 | 16.1 | 39.2 | 16.4 | 1,438.8 | 645,844 | 635,072 | 1.30 | 1.6% | 62.8 | 863.9 | 2,141.8 | 2,837.9 | 17 |
| ON | 75.2 | 50.8 | 16.5 | 4.9 | 14.4 | 4.7 | 4.1 | 29,292 | 30,156 | 2.05 | 5.7% | 4.6 | 75 | 101.6 | 137 | 27 |
| TXN | 312.9 | 40.6 | 27.2 | 14 | 27.2 | 13.8 | 14.9 | 286,105 | 291,368 | 1.34 | 1.7% | 11.5 | 250 | 336.9 | 400 | 29 |
Source: Yahoo Finance
Valuation looks mixed, but the cash yield argues NXPI is not obviously cheap. NXPI’s FCF yield is 6.1% TTM, far above STM at 0.8%, IFNNY at 2.2%, ASML at 1.6%, ON at 5.7%, and TXN at 1.7%, which means NXPI is generating more cash per dollar of equity than most peers and deserves a better floor than the group’s slower cash converters. Against that, NXPI still trades at 5.4x EV/Revenue and 20.9x trailing P/E, versus STM at 3.2x and 87.7x, IFNNY at 5.4x and 56.6x, ON at 4.9x and 50.8x, TXN at 14.0x and 40.6x, and ASML at 16.1x and 41.2x. On a peer EV/Revenue range of 3.2x to 16.1x applied to NXPI’s $13.8B TTM revenue, the implied enterprise value spans about $44B to $222.1B, or roughly $143 to $833 per share after net debt and shares outstanding, so the current $266 share price sits in the lower-middle of that range rather than at an extreme. That spread is wide because ASML’s growth and profitability are exceptional, which is exactly why NXPI’s more moderate multiple looks reasonable rather than cheap.
Profitability
| Company | Operating Margin (TTM) | Net Margin (TTM) | Return on Assets (TTM) | Return on Equity (TTM) | Gross Margin (TTM) | EBITDA Margin (TTM) |
|---|---|---|---|---|---|---|
| NXPI | 32.3% | 23.4% | 10.8% | 28.7% | 56.5% | 39.0% |
| STM | 9.7% | 3.8% | 2.6% | 3.0% | 35.4% | 22.1% |
| IFNNY | 14.2% | 7.8% | 5.3% | 7.0% | 41.1% | 26.9% |
| ASML | 44.4% | 34.1% | 18.3% | 65.6% | 54.3% | 41.0% |
| ON | 19.5% | 10.2% | 6.8% | 8.3% | 42.8% | 33.7% |
| TXN | 47.5% | 34.3% | 14.8% | 39.7% | 60.2% | 51.6% |
Source: Yahoo Finance
Profitability is a clear NXPI strength, but not an outlier versus the best semiconductor names. NXPI’s gross margin of 56.5%, EBITDA margin of 39.0%, operating margin of 32.3%, and net margin of 23.4% all beat STM’s 35.4%, 22.1%, 9.7%, and 3.8%, and also top IFNNY’s 41.1%, 26.9%, 14.2%, and 7.8%. ASML still leads on every margin at 54.3% gross, 41.0% EBITDA, 44.4% operating, and 34.1% net, so NXPI looks structurally stronger than the average peer but still below the category leader on pricing power and mix.
Leverage
| Company | Total Debt/Equity % (mrq) | Current Ratio (mrq) | Total Debt (mrq, USD Mil) | Operating Cash Flow TTM (USD Mil) | Free Cash Flow TTM (USD Mil) | Net Debt/EBITDA (TTM) | FCF Margin % (TTM) |
|---|---|---|---|---|---|---|---|
| NXPI | 88.1 | 2.1 | 10,978 | 3,800 | 4,086.6 | 1.3 | 29.6% |
| STM | 17.5 | 3.1 | 3,206 | 2,730 | 350.1 | -0.7 | 2.6% |
| IFNNY | 40.2 | 1.7 | 7,241 | 3,363 | 1,743.9 | 1.3 | 11.2% |
| ASML | 8.9 | 1.5 | 1,963 | 22,725.3 | 10,374.1 | -0.7 | 26.3% |
| ON | 65.1 | 3.5 | 4,709 | 1,672 | 1,656.7 | 0.4 | 26.7% |
| TXN | 70.7 | 5.6 | 13,555 | 9,896 | 4,778.6 | 0.5 | 23.0% |
Source: Yahoo Finance
Leverage is conservative enough to support the equity story. NXPI’s debt/equity is 88.1%, higher than STM’s 17.5% and IFNNY’s 40.2%, but its net debt/EBITDA is only 1.3x, close to IFNNY’s 1.3x and below ON’s 0.4x and TXN’s 0.5x only because those peers carry more cash relative to EBITDA; that tells me NXPI’s raw debt load is manageable because cash generation is strong. NXPI’s FCF margin of 29.6% also exceeds STM’s 2.6%, IFNNY’s 11.2%, ON’s 26.7%, and TXN’s 23.0%, which means the balance sheet is being funded by real cash, not accounting earnings. In other words, the leverage profile is not the reason the stock trades where it does; the market is paying for cash generation and execution quality, not balance-sheet safety alone.
Conclusion
I would put my rating as a Hold because the key tension is between improving operating momentum and a valuation that already reflects a good part of that improvement. The latest quarter sequence shows revenue and EBITDA moving higher, and the balance sheet is serviceable at 1.3x net debt/EBITDA, but the stock already trades at 13.8x EV/EBITDA and 5.4x EV/Revenue, so the market is not leaving much room for disappointment.
The bull case is straightforward: if revenue stays above 3.5B for two consecutive quarters and operating margin remains above 30.0%, then the recent step-up would look like a real inflection rather than a timing effect. That would also make the current 6.1% FCF yield look more durable, because higher sales at a 32.3% operating margin would translate into more cash without requiring a major change in capital intensity. The bear case is just as clear: if quarterly revenue slips back below $3.2B or gross margin falls toward the low-50% area, then the recovery thesis weakens quickly, and if net debt/EBITDA moves materially above 2.0x, the balance-sheet cushion starts to look less comfortable.
I stay at Hold because the bull case still needs one more clean quarter to prove itself, while the bear case only needs a modest loss of momentum to reassert itself. The cash generation is good enough to avoid a bearish call, but not yet strong enough, on its own, to justify paying up for a more confident Buy.
What to Watch Next
- Revenue above $3.5B for two quarters — would support a move toward Buy.
- Operating margin above 30.0% — would confirm the mix shift is still flowing through.
- Gross margin holding out of the low-50% area — would reduce pricing-pressure concerns.
- Net debt/EBITDA staying near 1.3x and below 2.0x — would keep refinancing risk contained.
- FCF yield staying near 6.1% — would support the current valuation floor.
What’s your take? I rated NXP Semiconductors (NXPI) HOLD above — but the goal here is to get this right, not just to publish an opinion. What would you add to this analysis, or which risk or catalyst do you think I’m under- or over-weighting? Tell me in the comments.
Our track record: every directional call is tracked publicly on The Scorecard, and Stocks Covered lists every company we have rated and when.
Sources
- SEC 10-K Annual Report — filed 2026-02-19
- SEC 8-K Filing (2026-04-28)
- SEC 8-K Filing (2026-04-20)
- SEC 8-K Filing (2026-03-12)
- SEC 8-K Filing (2026-02-09)
- SEC 8-K Filing (2026-02-06)
- SEC 8-K Filing (2026-02-03)
- SEC Form 4 Insider Transaction (2026-06-03)
- SEC Form 4 Insider Transaction (2026-05-01)
- SEC Form 4 Insider Transaction (2026-05-01)
- SEC 10-K Annual Report — FY2026
- SEC 10-K Annual Report — FY2025
- SEC 10-K Annual Report — FY2024
- SEC 10-K Annual Report — FY2023
- SEC 10-K Annual Report — FY2022
Data sourced from Yahoo Finance and SEC EDGAR. Not investment advice.
Leave a Comment