| Company | Jul 25 | Aug 25 | Sep 25 | Oct 25 | Nov 25 | Dec 25 | Jan 26 | Feb 26 | Mar 26 | Apr 26 | May 26 | Jun 26 | 12-Mo |
|---|---|---|---|---|---|---|---|---|---|---|---|---|---|
| AM | -2% | -3% | +9% | -10% | +4% | -1% | +7% | +19% | +1% | -3% | -4% | +9% | +26% |
| WES | +5% | -2% | +0% | -2% | +5% | +0% | +5% | +3% | -1% | +6% | +1% | +2% | +24% |
| PAA | +2% | -1% | -5% | -1% | +6% | +3% | +9% | +9% | +7% | +3% | -1% | -1% | +32% |
| KMI | -4% | -4% | +5% | -7% | +5% | +1% | +11% | +10% | +1% | -2% | -5% | +3% | +13% |
| DTM | -7% | +1% | +9% | -3% | +11% | -1% | +5% | +10% | -2% | +10% | -5% | +5% | +37% |
| KNTK | +0% | -4% | +2% | -8% | -10% | +4% | +13% | +13% | +6% | +6% | -9% | +5% | +18% |
Source: Yahoo Finance monthly adjusted close.
Executive Summary
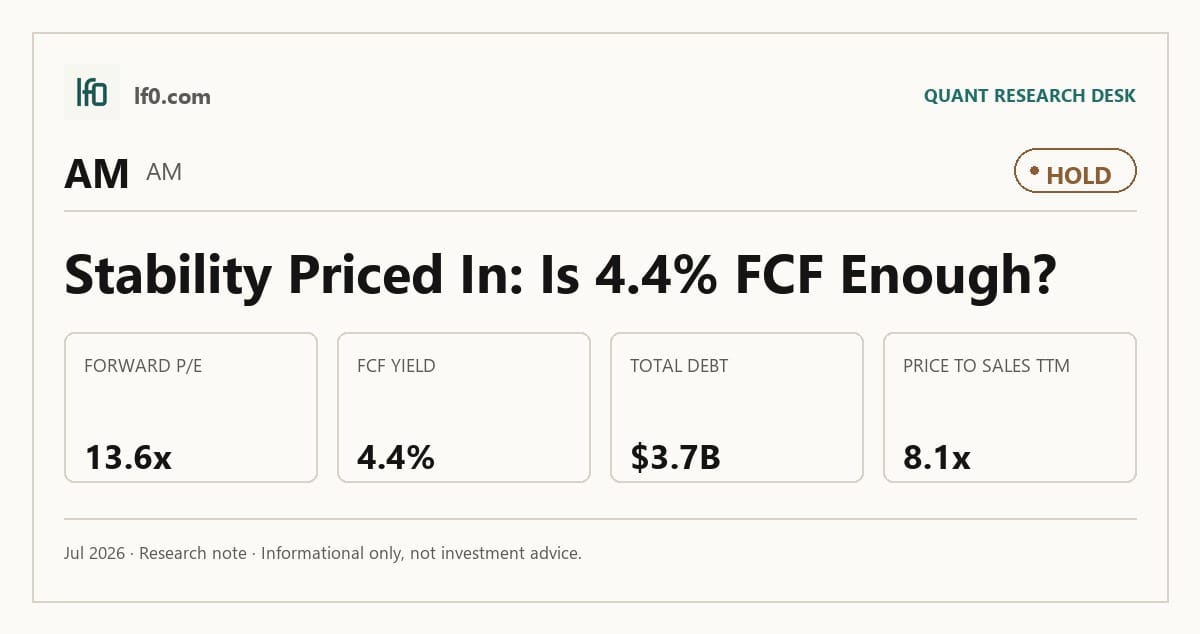
Rating: HOLD | AM
Measured from adjusted close on 2026-07-31 to 2026-09-15. Sell ratings are correct when the stock falls; Hold is tracked as a +/-10% range. Daily-close data, not intraday. Calls are tracked for 182 days from publication, then frozen as a final record.
I would put my rating as a Hold because Antero Midstream combines unusually visible fee-based cash flow with a valuation that already discounts much of that stability. The core system is protected by long-dated acreage dedication and fixed-fee contracts, but the shares still trade at 8.1x sales and 13.6x forward earnings, so the market is not leaving much room for a slowdown. In my view, the key question is whether the company can keep converting that contract base into cash at the current pace. I would raise my rating toward a Buy if levered free cash flow stays above $450M TTM, meaning the business keeps generating enough cash to support the debt load and still compound equity value.
Company Profile
Antero Midstream Corp. gathers, compresses, processes, and handles water for Antero Resources in the Appalachian Basin, mainly in West Virginia and Ohio. It earns revenue under long-term fixed-fee and cost-of-service contracts, including gathering and compression agreements that run through 2038 and water services through 2035, with minimum volume commitments on certain new assets. The company was formed to own and develop midstream infrastructure and operates through Antero Midstream Partners and its wholly owned subsidiaries; Antero Resources owned 29.0% of the common stock at December 31, 2025. At December 31, 2025, the system included 426 miles of low-pressure gathering lines, 305 miles of high-pressure lines, 4.8 Bcf/d of compression capacity, 236 miles of buried water pipeline, and 187 miles of surface water pipeline. Antero Midstream is listed on the NYSE under AM.
Economic Moat
Business Model
The dedicated gathering and compression system tied to Antero Resources is the part of the model I view as hardest to replicate within 3 years, because substantially all of Antero Resources’ approximate 566,000 gross acres, or 537,000 net acres, were dedicated to Antero Midstream as of December 31, 2025, and those gathering and compression agreements run through 2038. That long-dated acreage dedication, plus minimum volume commitments on certain new high-pressure lines and compressor stations and a cost-of-service option that can earn a 13% rate of return over seven years on new construction, gives the business a contractual cash-flow base that a well-funded competitor would struggle to dislodge quickly. I also see a secondary moat in the integrated water system, because the company had 426 miles of low-pressure pipeline, 305 miles of high-pressure pipeline, 4.8 Bcf/d of compression capacity, 236 miles of buried water pipeline, and 187 miles of surface water pipeline in the Appalachian Basin at December 31, 2025, which makes it difficult for a rival to match the footprint without years of capital and permitting. The 29.0% Antero Resources ownership stake in Antero Midstream further tightens the relationship, although it also creates related-party dependence rather than a pure standalone advantage.
Business & Operating Risks
The main disclosed risk is concentration, not a direct threat to the moat itself. Antero Midstream depends heavily on one customer and one basin, so any slowdown in Antero Resources’ drilling program would hit volumes and contract renewals before it would threaten the asset network’s physical advantage. The company also faces execution risk on new construction, because the 13% return option only helps if projects are completed on time and within budget. In my view, those risks pressure cash flow more than they undermine the structural edge created by acreage dedication and long-term contracts.
Management Discussion & Analysis
Management appears to be responding to concentration risk by simplifying the asset base and leaning harder into the core Appalachian footprint. The February 23, 2026 sale of substantially all Utica Shale midstream assets for $400M in cash sharpened the focus on the highest-value acreage, and the HG Acquisition added gathering pipelines and integrated water handling assets in the core of the Marcellus Shale in West Virginia. That is the right response to the disclosed risks, because it concentrates capital where the contractual relationship with Antero Resources is strongest, even though the customer concentration itself remains unresolved.
Recent Events
The most important recent event was the February 23, 2026 sale of substantially all Utica Shale midstream assets for $400M in cash. That divestiture reduces complexity and should improve capital allocation discipline, but it also confirms that management is willing to shrink the footprint outside the core system rather than chase scale for its own sake. The June 3, 2026 annual meeting, where shareholders elected directors, ratified KPMG LLP, and approved say-on-pay, was routine governance maintenance. The April 29, 2026 8-K was the first-quarter earnings release, and the May 12, 2026 filing updated the investor presentation; neither changed the moat thesis in a material way.
Financial Analysis
Growth
AM — Financial Growth (Quarterly, USD Mil)
| Metric | 2025-06-30 | 2025-09-30 | 2025-12-31 | 2026-03-31 | 2026-06-30 |
|---|---|---|---|---|---|
| REVENUE (USD Mil) | 323.1 | 312.5 | 314.7 | 335.4 | 350 |
| EBIT (USD Mil) | 216.5 | 208.9 | 124 | 209.9 | 210.2 |
| EBITDA (USD Mil) | 267.5 | 261 | 175.4 | 265.8 | 270.3 |
| NET INCOME (USD Mil) | 124.5 | 116 | 51.9 | 118.3 | 113.5 |
| DILUTED EPS | 0.3 | 0.2 | 0.1 | 0.2 | 0.2 |
Source: Yahoo Finance — Quarterly Financial Statements
| Metric | 2025-06-30 | 2025-09-30 | 2025-12-31 | 2026-03-31 | 2026-06-30 |
|---|---|---|---|---|---|
| Revenue USD Mil | 323.1 | 312.5 | 314.7 | 335.4 | 350 |
| EBIT USD Mil | 216.5 | 208.9 | 124 | 209.9 | 210.2 |
| EBITDA USD Mil | 267.5 | 261 | 175.4 | 265.8 | 270.3 |
| Net Income USD Mil | 124.5 | 116 | 51.9 | 118.3 | 113.5 |
| Diluted EPS | 0.3 | 0.2 | 0.1 | 0.2 | 0.2 |
Revenue reached $350M in the latest quarter, up from $323.1M a year earlier, while EBITDA rose to $270.3M from $267.5M. That is a solid top-line result, but the more important read is that the business is still producing stable fee-based earnings rather than a burst of cyclical volume. The dip to $175.4M of EBITDA in the December quarter and the rebound to $265.8M in March point to some quarterly noise, so I would focus on the year-over-year trend rather than the quarter-to-quarter path.
Profitability
AM — Profitability (TTM)
| Metric | TTM |
|---|---|
| Operating Margin (TTM) | 55.4% |
| Net Margin (TTM) | 31.9% |
| Return on Assets (TTM) | 7.6% |
| Return on Equity (TTM) | 20.4% |
| Gross Margin (TTM) | 80.9% |
| EBITDA Margin (TTM) | 73.9% |
Source: Yahoo Finance — Trailing Twelve Months (TTM)
| Metric | TTM |
|---|---|
| Operating Margin TTM | 55.4% |
| Net Margin TTM | 31.9% |
| Return on Assets TTM | 7.6% |
| Return on Equity TTM | 20.4% |
| Gross Margin TTM | 80.9% |
| EBITDA Margin TTM | 73.9% |
TTM gross margin of 80.9% and EBITDA margin of 73.9% show that the core contract model still carries strong economics. Operating margin of 55.4% and net margin of 31.9% leave a meaningful gap, but that gap is not alarming in a capital-intensive midstream business where depreciation and interest matter. Return on equity of 20.4% versus return on assets of 7.6% tells me leverage is amplifying equity returns, which is useful as long as cash flow stays steady. The profitability profile supports the moat thesis because the contract structure is still converting into high-margin earnings.
Valuation
AM — Valuation Multiples
| Metric | Value |
|---|---|
| Market Cap (USD Mil) | 10,433 |
| Enterprise Value (USD Mil) | — |
| Trailing P/E | 26.5 |
| Forward P/E | 13.6 |
| Price/Sales (TTM) | 8.1 |
| Price/Book (mrq) | 5.3 |
| EV/Revenue | — |
| EV/EBITDA | — |
| Beta (5Y Monthly) | 0.61 |
| FCF Yield % (TTM) | 4.4% |
| Forward EPS (USD) | 1.6 |
| Analyst Target Price – Low (USD) | 23 |
| Analyst Target Price – Mean (USD) | 24.1 |
| Analyst Target Price – High (USD) | 26 |
| # Analyst Opinions | 7 |
Source: Yahoo Finance
| Metric | Value |
|---|---|
| Market Cap USD Mil | 10,433 |
| Enterprise Value USD Mil | — |
| Trailing P/E | 26.5 |
| Forward P/E | 13.6 |
| Price/Sales (TTM) | 8.1 |
| Price/Book (mrq) | 5.3 |
| EV/Revenue | — |
| EV/EBITDA | — |
| Beta (5Y Monthly) | 0.61 |
| FCF Yield % (TTM) | 4.4% |
| Forward EPS USD | 1.6 |
| Analyst Target Price – Low USD | 23 |
| Analyst Target Price – Mean USD | 24.1 |
| Analyst Target Price – High USD | 26 |
| # Analyst Opinions | 7 |
I would put fair value in a range of about $20-$26 per share based on the peer multiple work and the company’s own cash-flow profile. That range sits broadly inside the analyst target band of 23–26, which tells me the market and the sell side are not far apart on the base case. The more important point is that the stock is not cheap on sales, even though the 4.4% FCF yield and 13.6x forward P/E are more reasonable than the trailing P/E suggests. On my read, the valuation is supported by margin quality, but the debt load means I would want cash conversion to keep improving before I argue for a higher multiple.
Leverage
AM — Leverage & Coverage (Quarterly)
| Metric | Value |
|---|---|
| Total Debt/Equity % (mrq) | 191.7 |
| Current Ratio (mrq) | 1 |
| Total Debt (mrq, USD Mil) | 3,712.5 |
| Operating Cash Flow (TTM, USD Mil) | 972.1 |
| Levered Free Cash Flow (TTM, USD Mil) | 457.1 |
| Net Debt/EBITDA (TTM) | — |
| FCF Margin % (TTM) | 35.5% |
Source: Yahoo Finance — Quarterly Financial Statements
| Metric | Value |
|---|---|
| Total Debt/Equity % (mrq) | 191.7 |
| Current Ratio (mrq) | 1 |
| Total Debt (mrq, USD Mil) | 3,712.5 |
| Operating Cash Flow (TTM, USD Mil) | 972.1 |
| Levered Free Cash Flow (TTM, USD Mil) | 457.1 |
| Net Debt/EBITDA (TTM) | — |
| FCF Margin % (TTM) | 35.5% |
Total debt of $3.7B and debt-to-equity of 191.7% leave the balance sheet meaningfully levered, even though the current ratio of 1.0x is still serviceable. The good news is that operating cash flow of $972.1M and levered free cash flow of $457.1M show the business is converting earnings into cash at a healthy rate. That cash conversion matters more than the missing net debt figure, because it is what gives management room to fund the network, service debt, and still return capital over time. I view leverage as manageable, but not a reason to pay up.
Insider Activity
| Date | Insider | Role | Type | Shares | Price |
|---|---|---|---|---|---|
| 2026-05-04 | Kennedy Michael N. | See Remarks | S | 100,000 | $21.9 |
| 2026-05-04 | Schultz Yvette K | See Remarks | S | 69,269 | $21.9 |
| 2026-03-12 | KLIMLEY BROOKS J | Director | S | 5,000 | $23.2 |
| 2026-03-10 | Pearce Sheri | See Remarks | S | 14,000 | $22.8 |
| 2026-03-09 | Schultz Yvette K | See Remarks | S | 25,000 | $22.8 |
The visible Form 4 activity is one-sided, with sales rather than purchases. I would not overread that on its own, but it does not give me a reason to argue that insiders are leaning into the stock at current levels. In a name where the thesis already depends on stable cash flow and a premium multiple, the absence of open-market buying is at least a mild caution flag.
Comparable Analysis
Growth
| Company | Revenue TTM (USD Mil) | Revenue Growth YoY % | EBITDA TTM (USD Mil) | Diluted EPS TTM |
|---|---|---|---|---|
| AM | 1,285.7 | 8.6% | 950.6 | 0.8 |
| WES | 4,049.9 | 22.5% | 2,371.6 | 3 |
| PAA | 45,255 | 8.7% | 2,362 | 1.1 |
| KMI | 17,959 | 10.8% | 7,635 | 1.6 |
| DTM | 1,310 | 11.0% | 920 | 4.5 |
| KNTK | 1,731.1 | -7.5% | 560.6 | 2.5 |
Source: Yahoo Finance
AM’s revenue growth of 8.6% TTM sits near PAA at 8.7% and below WES at 22.5%, DTM at 11.0%, and KMI at 10.8%, while KNTK is at -7.5%. That puts AM in the middle of the group on growth, which is fine for a fee-based midstream name but not enough to justify a premium on its own. I think the market is paying more for AM’s consistency than for outright growth, and that is the right framing.
Valuation
| Company | Trailing P/E | Forward P/E | EV/Revenue | EV/EBITDA | Price/Sales (TTM) | Price/Book (mrq) | Market Cap (USD Mil) | Enterprise Value (USD Mil) | Beta (5Y Monthly) | FCF Yield % (TTM) | Forward EPS | Analyst Target Price – Low | Analyst Target Price – Mean | Analyst Target Price – High | # Analyst Opinions |
|---|---|---|---|---|---|---|---|---|---|---|---|---|---|---|---|
| AM | 26.5 | 13.6 | — | — | 8.1 | 5.3 | 10,433 | — | 0.61 | 4.4% | 1.6 | 23 | 24.1 | 26 | 7 |
| WES | 15.3 | 12.5 | 6.6 | 11.3 | 4.8 | 5.5 | 19,250 | 26,918 | 0.65 | 4.6% | 3.7 | 38 | 46 | 55 | 12 |
| PAA | 22.1 | 12.7 | 0.8 | 14.5 | 0.4 | 2.3 | 17,335 | 34,173 | 0.47 | 6.4% | 1.9 | 20 | 24.4 | 27 | 17 |
| KMI | 20.8 | 20.9 | 5.8 | 13.6 | 4 | 2.3 | 71,595 | 104,083 | 0.53 | 1.5% | 1.5 | 31 | 35.6 | 43 | 21 |
| DTM | 30.4 | 27.6 | 13.2 | 18.8 | 10.8 | 2.9 | 14,088 | 17,296 | — | 0.9% | 5 | 130 | 156.9 | 176 | 14 |
| KNTK | 20.2 | 31.4 | 7 | 21.5 | 4.9 | -2.1 | 8,455 | 12,080 | 0.78 | -1.4% | 1.6 | 48 | 54.2 | 64 | 16 |
Source: Yahoo Finance
AM’s forward P/E of 13.6x is above WES at 12.5x and PAA at 12.7x, but below KMI at 20.9x, DTM at 27.6x, and KNTK at 31.4x. Its FCF yield of 4.4% is also below PAA at 6.4% and only slightly below WES at 4.6%, which means AM is not obviously the cheapest name in the group despite its stronger margins. On a growth-adjusted basis, I think the market is giving AM credit for quality, but not enough to call it a bargain.
Profitability
| Company | Operating Margin (TTM) | Net Margin (TTM) | Return on Assets (TTM) | Return on Equity (TTM) | Gross Margin (TTM) | EBITDA Margin (TTM) |
|---|---|---|---|---|---|---|
| AM | 55.4% | 31.9% | 7.6% | 20.4% | 80.9% | 73.9% |
| WES | 41.1% | 29.5% | 7.3% | 36.7% | 69.8% | 58.6% |
| PAA | 2.8% | 2.5% | 3.0% | 10.4% | 5.9% | 5.2% |
| KMI | 30.1% | 19.3% | 4.5% | 11.0% | 49.4% | 42.5% |
| DTM | 50.4% | 35.7% | 4.0% | 9.9% | 75.3% | 70.2% |
| KNTK | -0.9% | 29.0% | 1.5% | 17.5% | 40.8% | 32.4% |
Source: Yahoo Finance
AM’s operating margin of 55.4% and EBITDA margin of 73.9% both top WES at 41.1% and 58.6%, and they are far above PAA at 2.8% and 5.2%. Return on equity of 20.4% is also well ahead of KMI at 11.0% and DTM at 9.9%, though WES is higher at 36.7%. That combination tells me AM’s margin quality is real, and it helps explain why the stock trades above the cheaper peers even without the fastest growth.
Leverage
| Company | Total Debt/Equity % (mrq) | Current Ratio (mrq) | Total Debt (mrq, USD Mil) | Operating Cash Flow TTM (USD Mil) | Free Cash Flow TTM (USD Mil) | Net Debt/EBITDA (TTM) | FCF Margin % (TTM) |
|---|---|---|---|---|---|---|---|
| AM | 191.7 | 1 | 3,712.5 | 972.1 | 457.1 | — | 35.5% |
| WES | 248.3 | 1.1 | 8,707.5 | 2,161.7 | 887.2 | 3.4 | 21.9% |
| PAA | 90.3 | 0.9 | 11,578 | 2,715 | 1,107.5 | 4.8 | 2.5% |
| KMI | 98.6 | 0.5 | 32,425 | 6,557 | 1,075 | 4.2 | 6.0% |
| DTM | 68.5 | 1.4 | 3,373 | 937 | 128 | 3.5 | 9.8% |
| KNTK | 136.8 | 0.6 | 3,889.3 | 607.7 | -117.9 | 6.9 | -6.8% |
Source: Yahoo Finance
AM’s debt-to-equity ratio of 191.7% is lower than WES at 248.3% but above PAA at 90.3%, KMI at 98.6%, DTM at 68.5%, and KNTK at 136.8%. Its current ratio of 1.0x is better than KMI at 0.5x and KNTK at 0.6x, but weaker than DTM at 1.4x and slightly below WES at 1.1x. The stronger cash conversion helps offset that leverage: AM’s 35.5% FCF margin is well above WES at 21.9%, PAA at 2.5%, KMI at 6.0%, DTM at 9.8%, and KNTK at -6.8%, so the balance sheet is levered but not fragile.
Conclusion
I would put my rating as a Hold because the real tension here is between a durable fee-based moat and a valuation that already assumes that moat keeps working. The 2038 acreage dedication, the fixed-fee contract base, and the 35.5% FCF margin all argue that the business is doing what it should, but the stock already trades at 8.1x sales and 13.6x forward earnings, so the upside case needs continued execution rather than just stability.
I would raise my rating toward a Buy if levered free cash flow stays above $450M TTM and revenue growth holds above 8.0% for the next two quarters, because that would tell me the core system is still compounding cash fast enough to justify a higher multiple. I would also want to see the debt-to-equity ratio move lower over time, or at least not worsen, since a 191.7% leverage load leaves less margin for error if growth slows.
I would move from Hold to Sell if revenue growth falls below 5.0% for two straight quarters or if levered free cash flow drops below $350M TTM, because that would mean the contract base is no longer translating into the cash generation the current valuation requires. At that point, the balance sheet would start to matter more than the moat.
For now, I think the numbers still support patience rather than aggression. The moat is intact, but the market is already paying for it, so I want to see another clean stretch of cash generation before I get more constructive.
What’s your take? I rated Antero Midstream (AM) HOLD above — but the goal here is to get this right, not just to publish an opinion. What would you add to this analysis, or which risk or catalyst do you think I’m under- or over-weighting? Tell me in the comments.
Sources
- SEC 10-K Annual Report — filed 2026-02-11
- SEC 8-K Filing (2026-06-04)
- SEC 8-K Filing (2026-05-12)
- SEC 8-K Filing (2026-04-29)
- SEC 8-K Filing (2026-04-01)
- SEC 8-K Filing (2026-02-23)
- SEC 8-K Filing (2026-02-11)
- SEC Form 4 Insider Transaction (2026-05-04)
- SEC Form 4 Insider Transaction (2026-05-04)
- SEC Form 4 Insider Transaction (2026-04-14)
Data sourced from Yahoo Finance and SEC EDGAR. Not investment advice.
Leave a Comment