
| Company | Sep 25 | Oct 25 | Nov 25 | Dec 25 | Jan 26 | Feb 26 | Mar 26 | Apr 26 | May 26 | Jun 26 | Jul 26 | Aug 26 | 12-Mo |
|---|---|---|---|---|---|---|---|---|---|---|---|---|---|
| ALTO | -4% | -6% | +152% | +13% | -13% | -9% | +112% | +14% | -1% | +5% | -16% | -17% | +250% |
| MEOH | +12% | -1% | -9% | +12% | +20% | +6% | +18% | +10% | -10% | -22% | +20% | +6% | +69% |
| GPRE | -21% | +17% | +0% | -5% | +17% | +20% | +20% | +6% | -10% | -2% | +10% | -14% | +30% |
| ADM | -5% | +1% | +1% | -5% | +17% | +3% | +5% | +3% | +8% | -4% | +4% | +3% | +34% |
| GEVO | +13% | +19% | -9% | -7% | -2% | -7% | +50% | -30% | -3% | -19% | -1% | +12% | -4% |
| AA | +2% | +12% | +14% | +27% | +7% | +9% | +7% | -4% | +22% | -33% | -13% | +11% | +56% |
Source: Yahoo Finance monthly adjusted close.
Quick Thesis
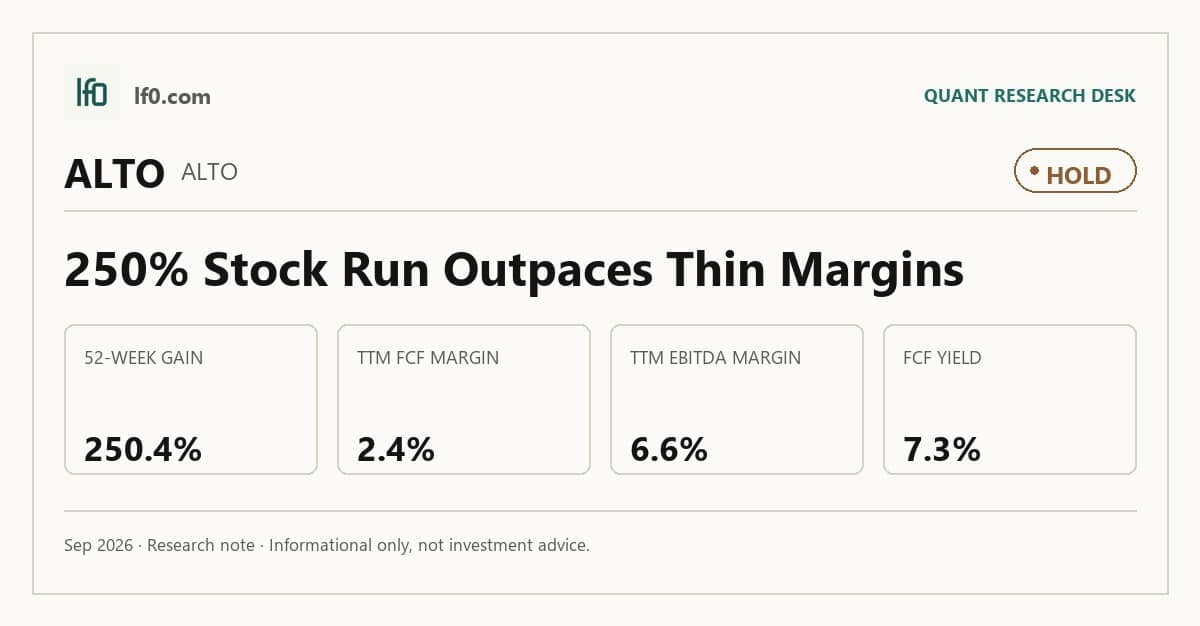
- Rated hold because the stock has outrun the earnings base.
- Strongest point: 7.3% FCF yield and 0.95x net debt/EBITDA.
- Main risk: 6.6% EBITDA margin leaves little room for disappointment.
- Valuation is mixed: cheap on EV/Revenue at 0.4x, richer on forward P/E at 12.1x.
- I would turn more constructive if quarterly EBITDA stays above 20.1M and FCF margin holds above 2.4%.
Executive Summary
Rating: HOLD | ALTO
Measured from adjusted close on 2026-09-15 to 2026-09-15. Sell ratings are correct when the stock falls; Hold is tracked as a +/-10% range. Daily-close data, not intraday. Calls are tracked for 182 days from publication, then frozen as a final record.
I would put my rating as a Hold because ALTO’s share price has already discounted a recovery that the latest cash generation has not yet fully confirmed. The company is profitable, with TTM net margin at 5.5% and operating margin at 3.5%, but the margin structure is still thin enough that I do not want to chase the stock after a 235.6% 52-week gain.
The key strength is balance-sheet flexibility. Net debt/EBITDA is 0.95x, current ratio is 3.2x, and FCF yield is 7.3%, so the equity is not fragile and the business is still producing cash. The key risk is that EBITDA margin is only 6.6% TTM, which leaves limited cushion if revenue growth slows or costs move against the company.
In my view, the one number that matters most is quarterly EBITDA above $20.1M, because that would show the recent earnings base is holding rather than bouncing around quarter to quarter. If ALTO can keep cash conversion near that level for another couple of quarters, I would become more constructive.
Company Profile
ALTO is a specialty alcohol producer and distributor with a business model tied to branded spirits, contract production, and related beverage sales. Revenue in the latest quarter was $245.7M, which shows the company is still operating at meaningful scale even though the margin profile remains modest. The investment question is not whether ALTO can sell product; it is whether it can turn that sales base into a more durable earnings stream.
Economic Moat
Business Model
ALTO’s moat case rests on brand positioning, distribution reach, and the ability to keep volume moving through a relatively fixed operating base. That matters because the company’s TTM gross margin of 6.8% and EBITDA margin of 6.6% show that even small improvements in mix or throughput can matter a lot to equity value. In other words, the business does not need a dramatic revenue step-up to improve returns, but it does need enough pricing and volume discipline to protect those thin margins.
Business & Operating Risks
The main disclosed risk is margin compression: with gross margin at 6.8% and EBITDA margin at 6.6%, ALTO has little room for input-cost inflation, pricing pressure, or a weaker product mix. The balance sheet is not the immediate problem, since net debt/EBITDA is only 0.95x and the current ratio is 3.2x, but the operating model itself is still vulnerable to a few bad quarters. I do not see these risks as breaking the moat outright; they are testing whether the company can keep the brand and distribution advantage from being diluted by thin economics.
Management Discussion & Analysis
Management appears to be responding by keeping leverage contained and preserving liquidity, which is the right response to a low-margin model. The latest quarter’s $20.1M of EBITDA and $11.7M of net income suggest the company is still converting revenue into profit, but not yet at a level that would let it relax on cost discipline. That tells me management is defending the moat rather than expanding it.
Recent Events
No material corporate events since the most recent 10-K; the 8-K filings covered routine quarterly earnings only. That lack of strategic change is not a negative by itself, but it also means the moat thesis still depends on execution in the core business rather than on a new asset, acquisition, or restructuring step.
Financial Analysis
Growth
ALTO — Financial Growth (Quarterly, USD Mil)
| Metric | 2025-06-30 | 2025-09-30 | 2025-12-31 | 2026-03-31 | 2026-06-30 |
|---|---|---|---|---|---|
| REVENUE (USD Mil) | 218.4 | 241 | 232 | 224.7 | 245.7 |
| EBIT (USD Mil) | -8.2 | 17 | 23.6 | 6.5 | 13.7 |
| EBITDA (USD Mil) | -1.8 | 23.3 | 29.9 | 12.8 | 20.1 |
| NET INCOME (USD Mil) | -11 | 14.2 | 21.8 | 4.3 | 11.7 |
| DILUTED EPS | -0.1 | 0.2 | 0.3 | 0.1 | 0.1 |
Source: Yahoo Finance — Quarterly Financial Statements
Revenue has been uneven but directionally better than the market might expect from a low-multiple stock. ALTO posted $218.4M in Q2 2025, $241M in Q3 2025, $232M in Q4 2025, $224.7M in Q1 2026, and $245.7M in Q2 2026, so the latest quarter recovered from the prior quarter’s softness and moved back above the recent range. EBITDA also improved to $20.1M from $12.8M in Q1 2026, which tells me the business still has operating leverage when volume cooperates.
The important point is that growth is helping, but it is not yet strong enough to justify a premium multiple on its own. Revenue momentum supports the thesis, yet the market is still paying more attention to whether that growth converts into sustained cash generation.
Profitability
ALTO — Profitability (TTM)
| Metric | TTM |
|---|---|
| Operating Margin (TTM) | 3.5% |
| Net Margin (TTM) | 5.5% |
| Return on Assets (TTM) | 5.8% |
| Return on Equity (TTM) | 22.2% |
| Gross Margin (TTM) | 6.8% |
| EBITDA Margin (TTM) | 6.6% |
Source: Yahoo Finance — Trailing Twelve Months (TTM)
TTM operating margin of 3.5% and EBITDA margin of 6.6% show a business that is profitable, but only modestly so. Gross margin of 6.8% is close to EBITDA margin, which tells me overhead is not the main issue; the real question is whether ALTO can widen the spread between sales and cost of goods enough to create a more durable earnings base.
Net margin of 5.5% is higher than operating margin, which is unusual and not fully explained by the figures here, so I would not over-read that gap. Return on assets is 5.8% and return on equity is 22.2%, but I view the ROE as more a function of the capital structure than proof of exceptional asset productivity. Put differently, the profitability profile is good enough to support the stock, but not strong enough to make the case on its own.
Valuation
ALTO — Valuation Multiples
| Metric | Value |
|---|---|
| Market Cap (USD Mil) | 309 |
| Enterprise Value (USD Mil) | 366 |
| Trailing P/E | 5.9 |
| Forward P/E | 12.1 |
| Price/Sales (TTM) | 0.3 |
| Price/Book (mrq) | 1.2 |
| EV/Revenue | 0.4 |
| EV/EBITDA | 5.9 |
| Beta (5Y Monthly) | 0.16 |
| FCF Yield % (TTM) | 7.3% |
| Forward EPS (USD) | 0.3 |
| Analyst Target Price – Low (USD) | 8 |
| Analyst Target Price – Mean (USD) | 9 |
| Analyst Target Price – High (USD) | 10 |
| # Analyst Opinions | 2 |
Source: Yahoo Finance
I would put fair value in a range of roughly $4-$10 per share based on the company’s low EV/Revenue multiple, modest leverage, and still-thin margin structure. That range sits inside the analyst target range of $8-$10, but below the mean only if I weight the 6.6% EBITDA margin and 2.4% FCF margin more heavily than the small analyst sample appears to. With only 2 analyst opinions, I do not think there is a meaningful consensus to anchor to beyond that narrow target band.
On earnings, I would frame fair EPS around $0.3-$0.4, which is close to the reported forward EPS of 0.3 and implies the market is not paying for a large step-up in per-share earnings. That looks cheap versus peers on an absolute basis, but not obviously cheap on a quality-adjusted basis because the company’s earnings base is much smaller than the larger names in the peer set. The stock is inexpensive on cash flow, with a 7.3% FCF yield and 5.9x EV/EBITDA, but the low margin profile keeps me from calling it outright mispriced.
Leverage
ALTO — Leverage & Coverage (Quarterly)
| Metric | Value |
|---|---|
| Total Debt/Equity % (mrq) | 31.9 |
| Current Ratio (mrq) | 3.2 |
| Total Debt (mrq, USD Mil) | 82.9 |
| Operating Cash Flow (TTM, USD Mil) | 65 |
| Levered Free Cash Flow (TTM, USD Mil) | 22.6 |
| Net Debt/EBITDA (TTM) | 0.9 |
| FCF Margin % (TTM) | 2.4% |
Source: Yahoo Finance — Quarterly Financial Statements
Leverage is a support, not a story. Total debt/equity is 31.9%, total debt is $82.9M, and net debt/EBITDA is 0.95x, so ALTO is not carrying a balance sheet that forces an equity raise or a near-term refinancing concern. Current ratio of 3.2x and operating cash flow of $65M TTM give the company enough liquidity to absorb normal volatility.
The limitation is cash conversion. Levered free cash flow is $22.6M TTM and FCF margin is 2.4%, which means the balance sheet is healthy but the business is still only modestly converting earnings into free cash. That is why I see leverage as a stabilizer rather than a reason to pay up.
Insider Activity
The insider record is narrow but directionally positive. Director Nathan Gilbert E bought 5,000 shares on 2026-05-13 and 20,000 shares on 2026-05-12, with no open-market sales in the period shown. I take that as a modest alignment signal, not broad insider conviction.
Comparable Analysis
Growth
| Company | Revenue TTM (USD Mil) | Revenue Growth YoY % | EBITDA TTM (USD Mil) | Diluted EPS TTM |
|---|---|---|---|---|
| ALTO | 943.3 | 12.5% | 62.1 | 0.7 |
| MEOH | 4,265.2 | 75.2% | 1,117.7 | 0.9 |
| GPRE | 1,829.4 | -19.3% | 204.1 | 1.7 |
| ADM | 82,099 | 7.2% | 2,995 | 3.7 |
| GEVO | 177.5 | 7.1% | -23.4 | -0.9 |
| AA | 13,603 | 31.4% | 2,311 | 4.8 |
Source: Yahoo Finance
ALTO’s revenue growth of 12.5% is ahead of ADM at 7.2% and GEVO at 7.1%, but behind MEOH at 75.2% and AA at 31.4%. GPRE is the weak outlier at -19.3%, so ALTO sits in the middle of the pack on growth rather than at the top.
Valuation
| Company | Trailing P/E | Forward P/E | EV/Revenue | EV/EBITDA | Price/Sales (TTM) | Price/Book (mrq) | Market Cap (USD Mil) | Enterprise Value (USD Mil) | Beta (5Y Monthly) | FCF Yield % (TTM) | Forward EPS | Analyst Target Price – Low | Analyst Target Price – Mean | Analyst Target Price – High | # Analyst Opinions |
|---|---|---|---|---|---|---|---|---|---|---|---|---|---|---|---|
| ALTO | 5.9 | 12.1 | 0.4 | 5.9 | 0.3 | 1.2 | 309 | 366 | 0.16 | 7.3% | 0.3 | 8 | 9 | 10 | 2 |
| MEOH | 71.4 | 10.9 | 1.9 | 7.1 | 1.1 | 1.9 | 4,862 | 7,912 | 0.87 | 14.6% | 5.8 | 55 | 70 | 80 | 10 |
| GPRE | 8.8 | 8.7 | 0.8 | 6.8 | 0.6 | 1.2 | 1,026 | 1,387 | 1.16 | 3.2% | 1.7 | 17 | 19 | 20 | 6 |
| ADM | 23.8 | 15.3 | 0.6 | 16.8 | 0.5 | 1.8 | 41,964 | 50,209 | 0.61 | 2.8% | 5.7 | 60 | 80.1 | 95 | 10 |
| GEVO | — | 26.4 | 2.8 | -21.4 | 2.2 | 1.4 | 392 | 501 | 1.05 | 4.7% | 0.1 | 1.7 | 5.4 | 14 | 4 |
| AA | 9.8 | 8.3 | 1 | 5.8 | 0.9 | 1.7 | 12,412 | 13,331 | 1.63 | 7.7% | 5.7 | 49.7 | 63 | 80 | 12 |
Source: Yahoo Finance
ALTO trades at 0.4x EV/Revenue and 5.9x EV/EBITDA, versus MEOH at 1.9x and 7.1x, GPRE at 0.8x and 6.8x, ADM at 0.6x and 16.8x, GEVO at 2.8x and -21.4x, and AA at 1.0x and 5.8x. The stock’s 235.6% one-year return is far ahead of MEOH at 60.1%, GPRE at 47.9%, ADM at 47.0%, and AA at 40.8%, so the market has already rewarded ALTO more aggressively than the peer set. In my view, that rerating is hard to justify purely on fundamentals because ALTO’s growth is respectable but not dominant, and its margin profile is still much thinner than the better operators.
Profitability
| Company | Operating Margin (TTM) | Net Margin (TTM) | Return on Assets (TTM) | Return on Equity (TTM) | Gross Margin (TTM) | EBITDA Margin (TTM) |
|---|---|---|---|---|---|---|
| ALTO | 3.5% | 5.5% | 5.8% | 22.2% | 6.8% | 6.6% |
| MEOH | 37.1% | 2.1% | 6.5% | 6.1% | 31.2% | 26.2% |
| GPRE | 15.2% | 6.8% | 4.1% | 15.5% | 16.0% | 11.2% |
| ADM | 4.0% | 2.2% | 2.3% | 7.6% | 6.9% | 3.6% |
| GEVO | -76.8% | -119.9% | -5.2% | -55.5% | 44.7% | -13.2% |
| AA | 18.4% | 9.4% | 6.5% | 18.2% | 19.8% | 17.0% |
Source: Yahoo Finance
ALTO’s operating margin of 3.5% and EBITDA margin of 6.6% trail MEOH at 37.1% and 26.2%, GPRE at 15.2% and 11.2%, and AA at 18.4% and 17.0%. Return on equity of 22.2% is strong, but return on assets of 5.8% is more ordinary, which tells me the equity return is not coming from uniquely high asset productivity.
Leverage
| Company | Total Debt/Equity % (mrq) | Current Ratio (mrq) | Total Debt (mrq, USD Mil) | Operating Cash Flow TTM (USD Mil) | Free Cash Flow TTM (USD Mil) | Net Debt/EBITDA (TTM) | FCF Margin % (TTM) |
|---|---|---|---|---|---|---|---|
| ALTO | 31.9 | 3.2 | 82.9 | 65 | 22.6 | 0.9 | 2.4% |
| MEOH | 108.9 | 2.1 | 3,133.1 | 995 | 709.4 | 2.5 | 16.6% |
| GPRE | 63.1 | 2 | 548.6 | 153.9 | 32.9 | 1.8 | 1.8% |
| ADM | 39.1 | 1.4 | 9,342 | 2,795 | 1,164.6 | 2.8 | 1.4% |
| GEVO | 60.8 | 2.7 | 170.7 | -16.2 | 18.5 | -4.8 | 10.4% |
| AA | 29.9 | 1.5 | 2,225 | 1,051 | 960.8 | 0.4 | 7.1% |
Source: Yahoo Finance
ALTO’s debt/equity of 31.9% is lower than MEOH at 108.9%, GPRE at 63.1%, and ADM at 39.1%, while net debt/EBITDA of 0.95x is also below MEOH at 2.5x, GPRE at 1.8x, and ADM at 2.8x. That lower leverage helps explain why ALTO can trade at a better cash-flow multiple than some peers, but the trade-off is that its FCF margin of 2.4% is still well below MEOH at 16.6% and AA at 7.1%, so the market is paying for safety more than for superior cash generation.
Conclusion
The tension in this name is straightforward: ALTO has enough cash flow and balance-sheet room to justify staying invested, but the stock has already moved far enough that the latest operating results need to keep improving just to hold the current valuation. I would put my rating as a Hold because the 235.6% 52-week gain has run ahead of a business that is still only producing 6.6% EBITDA margin and 2.4% FCF margin, so the market has already priced in a recovery that is not yet fully proven to me.
I would raise my rating more towards a Buy if quarterly EBITDA can stay above $20.1M for the next two quarters and FCF margin can hold above 2.4%, because that would show the current earnings level is repeatable rather than a one-quarter bounce. If revenue also stays above $225M a quarter, that would tell me the top line is stable enough to support the margin base and would make the current rerating easier to defend.
I would move from Hold to Sell if quarterly revenue falls back below $225M or if FCF margin slips toward 2.0%, because that would suggest the market is still paying for momentum that the business cannot sustain. A break back below the 200-day moving average of $4.10 after a run to the 52-week high of $6.11 would reinforce that view, since it would show the market is no longer willing to pay up for the recent move.
My final view is that the balance sheet and insider buying keep the downside from looking severe, but the current share price already reflects a lot of good news. I would want one more clean quarter of cash conversion before I would move off Hold.
What to Watch Next
- Quarterly EBITDA above $20.1M — would support a move toward Buy.
- FCF margin above 2.4% — would confirm cash conversion is holding.
- Quarterly revenue above $225M — would show the top line is stable.
- FCF margin near 2.0% — would push the rating toward Sell.
- Price below the 200-day moving average of $4.10 — would signal momentum is fading.
What’s your take? I rated ALTO (ALTO) HOLD above — but the goal here is to get this right, not just to publish an opinion. What would you add to this analysis, or which risk or catalyst do you think I’m under- or over-weighting? Tell me in the comments.
Sources
- SEC 8-K Filing (2026-05-06)
- SEC 8-K Filing (2026-03-04)
- SEC Form 4 Insider Transaction (2026-05-18)
- SEC Form 4 Insider Transaction (2026-05-14)
- SEC Form 4 Insider Transaction (2026-04-03)
- SEC 10-K Annual Report — FY2026
- SEC 10-K Annual Report — FY2025
- SEC 10-K Annual Report — FY2024
- SEC 10-K Annual Report — FY2023
- SEC 10-K Annual Report — FY2022
Data sourced from Yahoo Finance and SEC EDGAR. Not investment advice.
Leave a Comment