
| Company | Aug 25 | Sep 25 | Oct 25 | Nov 25 | Dec 25 | Jan 26 | Feb 26 | Mar 26 | Apr 26 | May 26 | Jun 26 | Jul 26 | 12-Mo |
|---|---|---|---|---|---|---|---|---|---|---|---|---|---|
| TDS | +3% | -2% | -1% | +4% | +2% | +10% | -1% | -6% | +7% | -13% | -5% | -9% | -14% |
| T | +7% | -4% | -11% | +5% | -5% | +7% | +7% | +3% | -9% | -5% | -17% | +14% | -11% |
| TMUS | +6% | -5% | -12% | -0% | -3% | -3% | +11% | -3% | -7% | -4% | -11% | +3% | -26% |
| VZ | +3% | -1% | -8% | +3% | -1% | +11% | +13% | +0% | -3% | -0% | -11% | +12% | +17% |
| TU | +2% | -4% | -7% | -10% | +0% | +6% | -2% | -4% | -2% | +0% | -14% | -10% | -38% |
| DTEGY | +2% | -7% | -9% | +4% | +2% | +2% | +21% | -8% | -10% | +4% | -19% | +13% | -11% |
Source: Yahoo Finance monthly adjusted close.
Quick Thesis
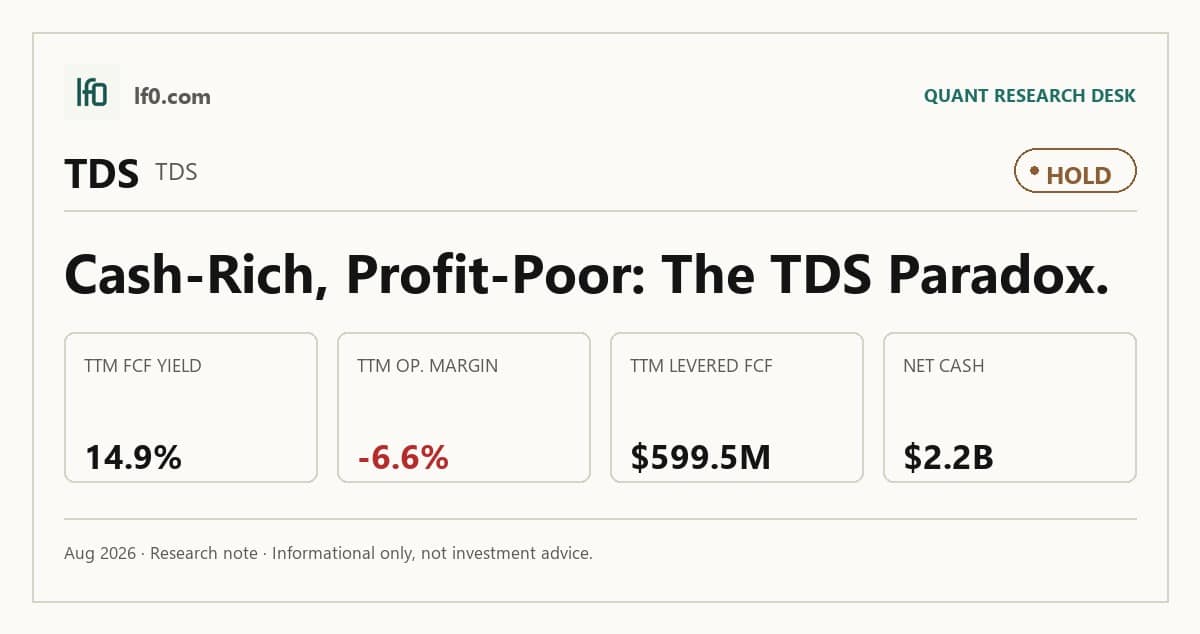
- Rated hold — cash-rich, but operating margin remains negative.
- Strongest support: $599.5M TTM levered free cash flow.
- Main risk: -6.6% TTM operating margin and execution risk in fiber build-out.
- Valuation looks fair on cash, with 13.7x EV/EBITDA and a 14.8% FCF yield.
- I would raise the rating if TTM free cash flow stays above about $550M and operating margin turns positive.
Executive Summary
Rating: HOLD | TDS
Measured from adjusted close on 2026-08-17 to 2026-10-01. Sell ratings are correct when the stock falls; Hold is tracked as a +/-10% range. Daily-close data, not intraday. Calls are tracked for 182 days from publication, then frozen as a final record.
I would put my rating as a hold because TDS has real balance-sheet support and cash generation, but it has not yet proven to me that the fiber build is translating into durable operating profit. The strongest offset is the 14.8% TTM free cash flow yield, which gives the stock downside support, while the main drag is the -6.6% TTM operating margin that says core earnings are still weak. In my view, the market is paying for cash today rather than for a clean earnings rerating, and that is why I stop at hold. I would become more constructive if TTM free cash flow stays above roughly $550M, meaning the current cash yield holds while fiber spending remains disciplined, and if operating margin turns positive for two consecutive quarters.
Company Profile
Telephone and Data Systems, Inc. was founded in 1968 and provides communications services through TDS Telecommunications LLC and Array Digital Infrastructure, Inc. TDS Telecom serves broadband, video, voice and wireless customers across 30 states, while Array owns towers and spectrum assets after the sale of its wireless operations and select spectrum assets to T-Mobile on August 1, 2025. TDS Telecom is expanding fiber in Wisconsin and the Pacific Northwest, with residential speeds up to 8 Gbps and select business speeds up to 10 Gbps. TDS common shares trade on the NYSE under TDS, and Array common shares trade under AD. The TDS Voting Trust controls a majority of voting power.
Economic Moat
Business Model
The most defensible part of the model is TDS Telecom’s fiber network, which I view as hard to replicate quickly because the company is already interconnecting substantially all of its service territories through a 400-gigabit core network and monitoring faults around the clock through Network Management Centers. That infrastructure supports higher-speed broadband and gives the company a local service advantage that is reinforced by door-to-door selling, digital marketing, targeted mailings and bundled offerings across video, voice and wireless. The moat is not monopoly-like, though, because the company still competes directly with wireline, cable, fiber overbuilders, VoIP, satellite and wireless providers.
The strategic shift away from legacy access lines is important. Earlier filings showed a much more mixed wireline and cable footprint, but by December 31, 2025 the business had become more clearly fiber-led, while OneNeck IT Solutions had already been sold on September 3, 2024. That evolution strengthens the moat because it concentrates capital on the part of the network that can support better service quality and stickier broadband demand.
Business & Operating Risks
The biggest disclosed risk is Array’s dependence on T-Mobile after the August 1, 2025 transaction, because Array is now substantially dependent on T-Mobile under a new master lease agreement with a minimum 15-year term and 15-year minimum extensions on existing leases. If T-Mobile underperforms, the hit would fall on a much smaller earnings base than before, and decommissioning costs on retired towers could add to the damage. Spectrum monetization is the other key risk: if remaining sales or approvals slip, the expected cash will not arrive when planned, and the company could be left with assets that still require spending to preserve value. The disclosed risks do not break the fiber moat at TDS Telecom, but they do threaten the cash-flow bridge that is supposed to support the broader restructuring.
Management Discussion & Analysis
Management is responding to those risks by shrinking the asset base, recycling capital and keeping fiber spending in place. The August 1, 2025 sale of Array’s wireless operations and select spectrum assets brought in $2.6B of cash proceeds and $1.7B of debt assumed, and TDS also received $725.6M of its pro rata share of Array’s special dividend in February 2026. At the same time, TDS Telecom still plans $550M to $600M of capital expenditures in 2026 for fiber deployment, E-ACAM builds and broadband growth, so management is not abandoning the network investment that underpins the moat.
That said, the operating results have not yet caught up with the spending. 2025 telecom revenue fell 2.0% to $1B and operating income dropped 81.0% to $19.7M, which tells me the fiber strategy is still in the investment phase rather than the payoff phase. The company is using the balance sheet as a source of cash, but the unresolved spectrum and lease exposure means the transition is only partly de-risked.
Recent Events
The most important recent event was the June 1, 2026 closing of Array Digital Infrastructure’s sale of select spectrum assets to Verizon for $1B in cash. That is a clean monetization of non-core spectrum and it supports the thesis by turning dormant assets into liquidity.
On the same day, Array’s board declared an $11.00 per share special cash dividend payable June 25, 2026 to holders of both common classes. I read that as a direct return of sale proceeds rather than idle cash sitting on the balance sheet, which reinforces the capital-recycling strategy.
The May 8, 2026 proposal from TDS to acquire the remaining Array shares in an all-stock merger is the more strategic development. If completed, it would simplify the structure and give TDS tighter control over Array’s spectrum and infrastructure assets, which should reduce the discount created by partial ownership. The May 21, 2026 shareholder vote also matters because investors approved officer exculpation amendments and re-elected the board, which modestly improves governance stability while the restructuring continues.
Financial Analysis
Growth
TDS — Financial Growth (Quarterly, USD Mil)
| Metric | 2025-06-30 | 2025-09-30 | 2025-12-31 | 2026-03-31 | 2026-06-30 |
|---|---|---|---|---|---|
| REVENUE (USD Mil) | 298.5 | 308.5 | 330.7 | 309.4 | 309.3 |
| EBIT (USD Mil) | 39.1 | 53.3 | 97.6 | 239.2 | 459.1 |
| EBITDA (USD Mil) | 125.2 | 145 | 187.4 | 325.1 | 547.9 |
| NET INCOME (USD Mil) | 11.6 | -81.8 | 56.5 | 144.6 | 298.4 |
| DILUTED EPS | -0.1 | -0.8 | 0.3 | 1.1 | 2.4 |
Source: Yahoo Finance — Quarterly Financial Statements
Revenue has been essentially flat over the last three reported quarters, moving from $330.7M in Q4 2025 to $309.4M in Q1 2026 and $309.3M in Q2 2026 after $308.5M in Q3 2025 and $298.5M in Q2 2025. That is only 3.6% growth year over year, so the top line is not yet showing the kind of scale effect that would justify a rerating on its own. EBITDA, however, rose from $125.2M in Q2 2025 to $547.9M in Q2 2026, which tells me earnings leverage is improving even as revenue stalls. The step-up in EBIT and EBITDA in early 2026 is the kind of move I would want to see repeated before I treat it as durable.
Profitability
TDS — Profitability (TTM)
| Metric | TTM |
|---|---|
| Operating Margin (TTM) | -6.6% |
| Net Margin (TTM) | 33.2% |
| Return on Assets (TTM) | -0.2% |
| Return on Equity (TTM) | 11.8% |
| Gross Margin (TTM) | 59.4% |
| EBITDA Margin (TTM) | 25.6% |
Source: Yahoo Finance — Trailing Twelve Months (TTM)
TTM operating margin was -6.6%, while gross margin was 59.4% and EBITDA margin was 25.6%. That spread says the business still has a cost absorption problem below gross profit, even though the revenue base itself is not weak. Net margin was 33.2%, but I would not read that as core operating strength because it is likely being helped by below-the-line items, so EBITDA and operating margin matter more here.
Return on assets was -0.2% and return on equity was 11.8%. The gap tells me equity returns are being amplified by the capital structure rather than by strong asset productivity, which makes the reported ROE less durable if the operating line does not improve. A positive operating margin is the threshold that matters most to me, because it would show the fiber investment is finally producing self-sustaining earnings power.
Valuation
TDS — Valuation Multiples
| Metric | Value |
|---|---|
| Market Cap (USD Mil) | 4,036 |
| Enterprise Value (USD Mil) | 4,414 |
| Trailing P/E | 8.8 |
| Forward P/E | 4,312.4 |
| Price/Sales (TTM) | 3.2 |
| Price/Book (mrq) | 1 |
| EV/Revenue | 3.5 |
| EV/EBITDA | 13.7 |
| Beta (5Y Monthly) | 0.35 |
| FCF Yield % (TTM) | 14.8% |
| Forward EPS (USD) | — |
| Analyst Target Price – Low (USD) | 47 |
| Analyst Target Price – Mean (USD) | 49 |
| Analyst Target Price – High (USD) | 51 |
| # Analyst Opinions | 2 |
Source: Yahoo Finance
TDS screens as a cash-generation name first and a growth name second. Its 14.8% TTM FCF yield is well above T’s 5.9%, TMUS’s 5.8%, VZ’s 8.7%, and DTEGY’s 11.0%, which is why I think the market is paying less for each dollar of cash flow than it does for most peers. EV/Revenue is 3.5x and EV/EBITDA is 13.7x, so the stock is not a deep bargain on enterprise value, but it is inexpensive relative to the cash it is producing.
On my read, fair value sits in a range of about $16.4-$28.2 per share using the peer EV/Revenue framework and TDS’s net cash position. That range is below the $47-$51 analyst target band, but I do not put much weight on the consensus here because there are only 2 analyst opinions and the forward EPS field is not meaningful. The gap between my range and the analyst targets reflects the fact that I weight the weak operating margin and modest growth more heavily than the cash yield alone. Put differently, the market is already giving TDS credit for cash generation, but I do not think it is yet paying for a clean earnings rerating.
I would also frame earnings power as modest rather than robust. On the current trajectory, I would think in terms of low-single-digit EPS support rather than a rapid step-up, and that makes TDS look cheaper on cash flow than on earnings quality. Relative to peers, that EPS profile is not rich, but it is also not the kind of trajectory that usually supports a premium multiple.
Leverage
TDS — Leverage & Coverage (Quarterly)
| Metric | Value |
|---|---|
| Total Debt/Equity % (mrq) | 23.1 |
| Current Ratio (mrq) | 3.8 |
| Total Debt (mrq, USD Mil) | 1,249 |
| Operating Cash Flow (TTM, USD Mil) | 105.7 |
| Levered Free Cash Flow (TTM, USD Mil) | 599.4 |
| Net Debt/EBITDA (TTM) | -2.9 |
| FCF Margin % (TTM) | 47.6% |
Source: Yahoo Finance — Quarterly Financial Statements
TDS has a strong balance sheet. Total debt to equity was 23.1% in mrq, current ratio was 3.8x, and total debt was $1.2B, while total cash was $2.2B, so the company is in a net-cash position. Net debt to EBITDA was -2.9x and FCF margin was 47.7%, which tells me the business is funding itself internally rather than leaning on leverage.
That balance-sheet strength matters because it gives management room to keep funding fiber build-out even while operating margin is still negative. The risk is not refinancing stress today; it is whether the cash is being deployed into assets that can eventually lift the operating line. If free cash flow were to fall materially from here, the cushion would still be there, but the equity case would weaken because the current valuation depends on cash conversion staying strong.
Insider Activity
The insider record shows one open-market sale by CARLSON LEROY T JR, Vice Chair, on 2026-05-21 for 4,961 shares at $41.20. I do not see open-market buying in the record provided, so the signal is mildly negative rather than decisive. In my view, that is not enough to drive the thesis, but it does not add confidence at the margin.
Comparable Analysis
Growth
| Company | Revenue TTM (USD Mil) | Revenue Growth YoY % | EBITDA TTM (USD Mil) | Diluted EPS TTM |
|---|---|---|---|---|
| TDS | 1,258 | 3.6% | 322.4 | 4 |
| T | 127,239 | 2.3% | 44,939 | 3 |
| TMUS | 92,189 | 7.9% | 34,371 | 9.6 |
| VZ | 138,895 | -0.7% | 51,082 | 3.8 |
| TU | 20,206 | -2.2% | 4,964 | -0.4 |
| DTEGY | 123,226 | 4.3% | 42,652 | 2 |
Source: Yahoo Finance
TDS’s 3.6% revenue growth trails TMUS at 7.9% and DTEGY at 4.3%, but it is ahead of T at 2.3% and VZ at -0.7%. That puts TDS in the middle of the group on growth, which is consistent with a business that is still investing in fiber rather than harvesting a mature network.
Valuation
| Company | Trailing P/E | Forward P/E | EV/Revenue | EV/EBITDA | Price/Sales (TTM) | Price/Book (mrq) | Market Cap (USD Mil) | Enterprise Value (USD Mil) | Beta (5Y Monthly) | FCF Yield % (TTM) | Forward EPS | Analyst Target Price – Low | Analyst Target Price – Mean | Analyst Target Price – High | # Analyst Opinions |
|---|---|---|---|---|---|---|---|---|---|---|---|---|---|---|---|
| TDS | 8.8 | 4,312.4 | 3.5 | 13.7 | 3.2 | 1 | 4,036 | 4,414 | 0.35 | 14.8% | — | 47 | 49 | 51 | 2 |
| T | 8.2 | 9.7 | 2.6 | 7.5 | 1.3 | 1.6 | 170,659 | 336,737 | 0.42 | 5.9% | 2.6 | 20 | 28.7 | 36 | 23 |
| TMUS | 19.1 | 12.7 | 3.4 | 9.1 | 2.1 | 3.5 | 196,079 | 313,483 | 0.33 | 5.8% | 14.4 | 169 | 243.4 | 300 | 24 |
| VZ | 12.6 | 9.2 | 2.8 | 7.7 | 1.5 | 1.9 | 201,714 | 394,549 | 0.23 | 8.7% | 5.3 | 44 | 51.6 | 71 | 23 |
| TU | — | 17.4 | 2.3 | 9.4 | 0.8 | 1.6 | 15,411 | 46,452 | 0.73 | 15.6% | 0.6 | 9.5 | 11.7 | 14.5 | 3 |
| DTEGY | 16.1 | 10.4 | 2.7 | 7.7 | 1.3 | 2.3 | 158,257 | 329,556 | 0.32 | 11.0% | 3.2 | 40.3 | 42.1 | 44.3 | 3 |
Source: Yahoo Finance
On EV/Revenue, TDS at 3.5x is above T at 2.6x, VZ at 2.8x, TU at 2.3x and DTEGY at 2.7x, but below TMUS at 3.4x. The more important point is that TDS’s 14.8% FCF yield is the best in the group, so the market is not charging it a growth premium even though its leverage profile is stronger than every peer here. That combination is why I think the stock looks cheaper on cash than on headline multiples alone.
Profitability
| Company | Operating Margin (TTM) | Net Margin (TTM) | Return on Assets (TTM) | Return on Equity (TTM) | Gross Margin (TTM) | EBITDA Margin (TTM) |
|---|---|---|---|---|---|---|
| TDS | -6.6% | 33.2% | -0.2% | 11.8% | 59.4% | 25.6% |
| T | 24.8% | 16.9% | 4.2% | 18.3% | 59.7% | 35.3% |
| TMUS | 25.2% | 11.5% | 6.0% | 18.0% | 63.0% | 37.3% |
| VZ | 23.0% | 11.6% | 5.0% | 15.8% | 59.5% | 36.8% |
| TU | 15.1% | -4.5% | 3.4% | -6.4% | 35.6% | 24.6% |
| DTEGY | 23.5% | 7.0% | 5.7% | 15.1% | 44.9% | 34.6% |
Source: Yahoo Finance
TDS’s 59.4% gross margin is close to T’s 59.7% and VZ’s 59.5%, but its 25.6% EBITDA margin trails TMUS at 37.3% and VZ at 36.8%. The real gap is operating margin: TDS is at -6.6% versus positive 15.1% to 25.2% for the peers, which tells me the company is not yet converting gross profit into operating profit as efficiently as the stronger names. That is why the valuation discount is justified even with a decent gross margin base.
Leverage
| Company | Total Debt/Equity % (mrq) | Current Ratio (mrq) | Total Debt (mrq, USD Mil) | Operating Cash Flow TTM (USD Mil) | Free Cash Flow TTM (USD Mil) | Net Debt/EBITDA (TTM) | FCF Margin % (TTM) |
|---|---|---|---|---|---|---|---|
| TDS | 23.1 | 3.8 | 1,249 | 105.7 | 599.5 | -2.9 | 47.6% |
| T | 129.1 | 1 | 165,756 | 39,899 | 10,142 | 3.3 | 8.0% |
| TMUS | 214 | 0.9 | 120,427 | 28,833 | 11,336 | 3.4 | 12.3% |
| VZ | 184.1 | 0.6 | 193,646 | 38,799 | 17,466.6 | 3.8 | 12.6% |
| TU | 223.8 | 0.7 | 31,532 | 5,015 | 2,395.8 | 6.1 | 11.9% |
| DTEGY | 165.3 | 1 | 146,756 | 40,805 | 17,394.6 | 3.3 | 14.1% |
Source: Yahoo Finance
TDS is the cleanest balance sheet in the group, with total debt to equity of 23.1% and net debt to EBITDA of -2.9x, versus T at 129.1% and 3.3x, TMUS at 214.0% and 3.4x, VZ at 184.1% and 3.8x, TU at 223.8% and 6.1x, and DTEGY at 165.3% and 3.3x. Its 47.7% FCF margin also leads the peer set, which means the company is generating cash with far less balance-sheet strain than the others. That leverage advantage helps explain why TDS can trade on a reasonable cash yield even though its operating margin is weaker than the larger telecom names.
Conclusion
I would put my rating as a hold because the key tension is still unresolved: TDS has a strong cash yield and net cash, but the operating margin has not yet turned positive. In other words, the balance sheet is already doing the heavy lifting, while the fiber investment still needs to prove that it can lift core earnings rather than just support cash recycling.
The bull case is straightforward. If TTM free cash flow stays above about $550M, meaning the current 47.7% FCF margin is holding, and if operating margin turns positive for two consecutive quarters, I would raise my rating more towards a buy. That would tell me the fiber build in Wisconsin and the Pacific Northwest is finally converting into earnings leverage, not just capital spending, and it would make the current valuation look too conservative for a net-cash telecom name.
The bear case is just as clear. If TTM free cash flow falls below $400M, meaning the cash yield is no longer high enough to offset the weak operating line, or if the spectrum monetization and T-Mobile lease exposure begin to pressure cash flow from Array, I would move from hold to sell. At that point, the thesis would shift from a cash-rich transition to a business where cash is being consumed by a slower operating base.
My final view is that the upside case probably takes longer to show up than the market wants, while the downside is already cushioned by cash generation and net cash. I stay at hold because the current numbers support patience, but I would want to see the operating margin inflect before I pay for a rerating.
What to Watch Next
- TTM free cash flow above about $550M — would support a move toward Buy.
- Operating margin turning positive for two straight quarters — would show the fiber build is working.
- TTM free cash flow below $400M — would weaken the cash-yield support for the stock.
- Any pressure on Array cash flow from T-Mobile lease exposure — would raise downside risk.
- Further spectrum sale proceeds or dividends — would confirm the capital-recycling thesis.
What’s your take? I rated Telephone and Data Systems (TDS) HOLD above — but the goal here is to get this right, not just to publish an opinion. What would you add to this analysis, or which risk or catalyst do you think I’m under- or over-weighting? Tell me in the comments.
Sources
- SEC 10-K Annual Report — filed 2026-02-24
- SEC 8-K Filing (2026-06-01)
- SEC 8-K Filing (2026-05-26)
- SEC 8-K Filing (2026-05-08)
- SEC 8-K Filing (2026-05-08)
- SEC 8-K Filing (2026-03-24)
- SEC 8-K Filing (2026-03-13)
- SEC Form 4 Insider Transaction (2026-05-26)
- SEC Form 4 Insider Transaction (2026-05-26)
- SEC Form 4 Insider Transaction (2026-05-26)
- SEC 10-K Annual Report — FY2026
- SEC 10-K Annual Report — FY2025
- SEC 10-K Annual Report — FY2024
- SEC 10-K Annual Report — FY2023
- SEC 10-K Annual Report — FY2022
Data sourced from Yahoo Finance and SEC EDGAR. Not investment advice.
Leave a Comment