
| Company | Oct 25 | Nov 25 | Dec 25 | Jan 26 | Feb 26 | Mar 26 | Apr 26 | May 26 | Jun 26 | Jul 26 | Aug 26 | Sep 26 | 12-Mo |
|---|---|---|---|---|---|---|---|---|---|---|---|---|---|
| TMUS | -12% | -0% | -3% | -3% | +11% | -3% | -7% | -4% | -11% | +3% | +5% | -10% | -30% |
| T | -11% | +5% | -5% | +7% | +7% | +3% | -9% | -5% | -17% | +14% | +11% | -6% | -10% |
| VZ | -8% | +3% | -1% | +11% | +13% | +0% | -3% | -0% | -11% | +12% | +7% | -8% | +11% |
| AMX | +8% | +1% | -10% | +0% | +26% | -2% | +4% | -5% | +2% | -1% | -9% | -8% | +2% |
| BCE | -2% | +3% | +3% | +9% | +2% | -3% | -6% | +6% | -13% | +1% | +9% | -13% | -8% |
| RCI | +14% | -0% | -4% | +0% | +6% | -3% | -5% | +6% | -15% | +4% | +9% | -16% | -8% |
Source: Yahoo Finance monthly adjusted close.
Quick Thesis
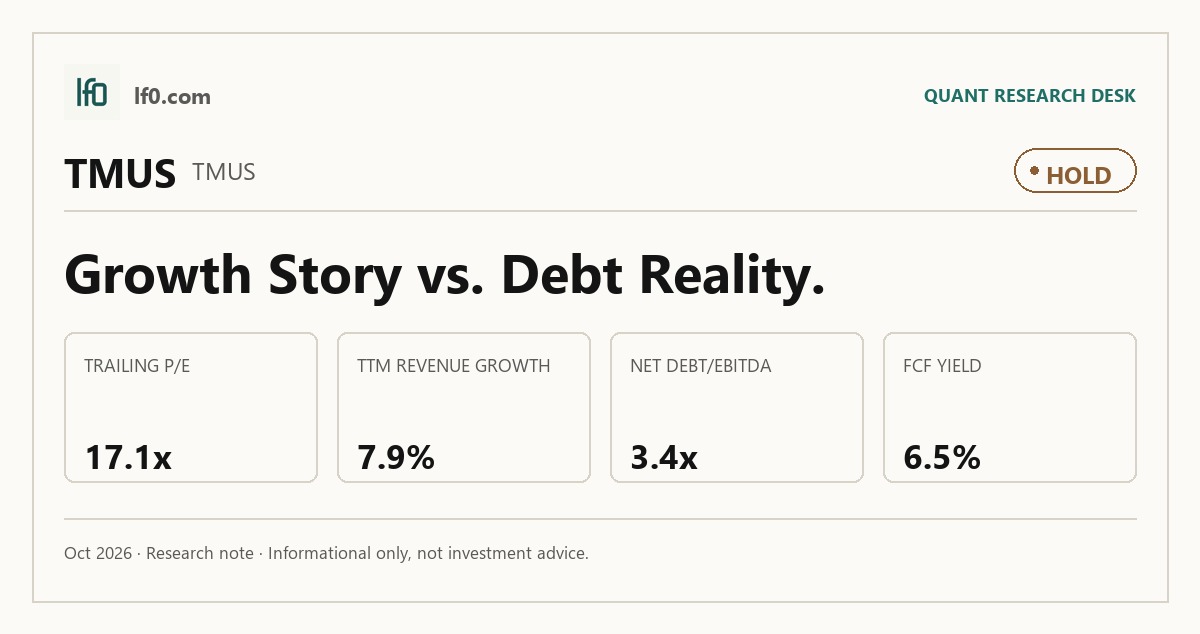
- Rated hold — growth is solid, but leverage and valuation already reflect it.
- TTM free cash flow is \$11.3B, supporting the equity story.
- Net debt/EBITDA is 3.4x, the main balance-sheet constraint.
- TMUS trades at 8.5x EV/EBITDA, above the peer group on growth quality.
- I would turn more constructive if FCF margin moves above 13.0%.
Executive Summary
Rating: HOLD | TMUS
We’ll begin tracking this call’s performance since publication once sufficient adjusted-close data is available.
I would put my rating as a hold because T-Mobile US is still growing faster than the large-cap wireless group, but the stock already prices in much of that strength at 17.1x trailing P/E and a 6.5% free cash flow yield. Q2 2026 revenue of $22.8B, up 8.0% year over year, shows the postpaid franchise is still expanding at scale, while TTM free cash flow of \$11.3B confirms the model continues to convert that scale into cash. The issue is not business quality; it is that the current valuation already discounts a good deal of that quality, and the balance sheet leaves less room for error than the operating momentum alone would suggest. I would turn more constructive if FCF margin moves above 13.0%, because that would mean materially more cash generation on the current revenue base and would make the leverage profile easier to absorb.
Company Profile
T-Mobile US provides wireless communications and broadband services in the United States, Puerto Rico, and the U.S. Virgin Islands. As of December 31, 2025, it served 142.4 million postpaid and prepaid customers, and postpaid users generated 81% of 2025 service revenue versus 15% from prepaid and 4% from wholesale and other services. The company sells service plans, smartphones, wearables, tablets, 5G broadband gateways, and accessories through T-Mobile, Metro by T-Mobile, and Mint Mobile.
The business traces its roots to 1994 and became T-Mobile US through the 2013 merger with MetroPCS. It is listed on the Nasdaq under TMUS, and its network spans low-band, mid-band, and millimeter-wave spectrum. That spectrum base is the core of the franchise because it supports both coverage and capacity across the same footprint.
Economic Moat
Business Model
The network is the hardest thing for a well-funded rival to copy within three years. T-Mobile US controlled an average of 394 MHz of combined low- and mid-band spectrum nationwide as of December 31, 2025, which gives it a dense spectrum stack that supports broad 5G coverage and capacity. In my view, that depth is difficult to replicate quickly because the company is using it across low-band, mid-band, and mmWave layers, while also managing the portfolio through the Comcast transaction and the Grain transaction.
The customer experience engine is the second pillar. The Un-carrier model ties together the end of annual service contracts, overages, unpredictable roaming fees, and data buckets with the T-Life app, AI-enabled self-service, and a nationwide retail and digital footprint serving 142.4 million customers. I feel that combination is harder to dislodge than a price-led carrier model because it is reinforced by network quality, product design, and switching friction rather than by one isolated feature.
Business & Operating Risks
The most material disclosed risk is intensifying competition across a saturated wireless market. According to the risk factors in its SEC 10-K, T-Mobile expects pressure in prepaid, postpaid, enterprise, and government segments from AT&T, Verizon, Comcast, Charter, Cox, Altice, and satellite providers. That mix matters because it hits both pricing and margins, and the filing is explicit that if T-Mobile cannot successfully differentiate its services, its competitive position and growth would suffer.
Cyberattack and third-party security exposure are the next major risks. The August 2021 and January 2023 incidents already triggered significant costs tied to mass arbitration claims, class actions, and an FCC investigation, and the filing warns that unauthorized access, ransomware, or distributed denial of service attacks can disrupt service and damage trust. The company has already incurred those costs, so this is a live operating issue rather than a theoretical one.
Execution risk also remains meaningful in network technology and digital transformation. The filing ties failure in 5G standalone, 5G Advanced, AI-driven Radio Access Networks, and broader digital transformation to slower adoption, higher expense, and weaker service quality. That would erode the company’s ability to defend share in a market where network quality is a primary buying criterion.
The UScellular acquisition and fiber joint ventures add integration and control risk. Restructuring and integration are expected to run over the next two years, and the filing warns that service disruptions, customer migration delays, and internal control problems could follow. The disclosed risks do not break the moat, but they do test whether the spectrum and customer-experience advantages can keep compounding while management absorbs a heavier integration load.
Management Discussion & Analysis
Management is signaling that 2026 is a capital-deployment and integration year, not a pause year. The UScellular Wireless Business closed on August 1, 2025 for $2.8B of cash plus the exchange of $1.7B of UScellular senior notes, and management expects $1.2B of annual run-rate cost synergies with about $2.6B of costs to achieve, mostly through fiscal 2027. The company is clearly trying to turn scale into operating leverage, but the savings need to arrive on schedule for the leverage profile to improve.
The fiber strategy is equally aggressive. T-Mobile invested $932M in Lumos for a 50% equity interest and 97,000 fiber customers, then $4.6B in Metronet for a 50% equity interest and 713,000 residential fiber customers. Those are growth bets on broadband scale, but they also lock in more capital before the payoff is visible.
Management is also leaning on shareholder returns. It authorized a $14.6B 2026 stockholder return program and repurchased 5.1M shares for $984M through February 6, 2026, which signals confidence in cash generation. At the same time, the company had $88.6B of total debt and financing lease liabilities as of December 31, 2025, so buybacks are being funded alongside a very large balance sheet.
The operating message is constructive, but not cleanly de-risked. Postpaid service revenue is expected to keep growing, yet total operating expenses are also set to rise from higher depreciation, equipment sales, and UScellular-related costs. In my view, management is responding to the risks above, but the response is still in the investment phase rather than the harvest phase.
Recent Events
The most significant development was the €2.5B senior note offering that closed on February 19, 2026. T-Mobile USA used the proceeds for general corporate purposes, including share repurchases, dividends, and refinancing, which preserves financial flexibility while still funding shareholder returns.
A second positive signal came on March 31, 2026, when TMUSA released subsidiary guarantees under its $10B revolving credit agreement and related debt facilities after legacy indebtedness was repaid. That simplification improves balance-sheet quality and reduces the kind of encumbrances that can limit strategic optionality.
The board also authorized an increase in the 2026 shareholder return program on April 23, 2026, lifting total authorized returns to up to $18.2B. Then, on April 28, 2026, T-Mobile reported first-quarter 2026 results and raised guidance, which reinforces the operating momentum behind the capital return plan. The only offset was Abdurazak Mudesir’s resignation from the board on March 31, 2026, but that appears isolated. On balance, the recent events support the moat thesis because they show the company using its cash flow and financing access to extend the network and return capital at the same time.
Financial Analysis
Growth
TMUS — Financial Growth (Quarterly, USD Mil)
| Metric | 2025-06-30 | 2025-09-30 | 2025-12-31 | 2026-03-31 | 2026-06-30 |
|---|---|---|---|---|---|
| REVENUE (USD Mil) | 21,132 | 21,957 | 24,334 | 23,107 | 22,791 |
| EBIT (USD Mil) | 5,202 | 4,452 | 3,647 | 4,365 | 5,383 |
| EBITDA (USD Mil) | 8,348 | 7,860 | 7,403 | 8,182 | 8,817 |
| NET INCOME (USD Mil) | 3,222 | 2,714 | 2,103 | 2,504 | 3,239 |
| DILUTED EPS | 2.8 | 2.4 | 1.9 | 2.3 | 3 |
Source: Yahoo Finance — Quarterly Financial Statements
T-Mobile’s revenue rose from $21.1B in Q2 2025 to $24.3B in Q4 2025, then eased to $23.1B in Q1 2026 and $22.8B in Q2 2026. That still leaves Q2 2026 up 8.0% year over year versus Q2 2025, so the top line is growing, but the sequence shows a post-acquisition step-up followed by two softer quarters rather than a clean acceleration. EBITDA moved from $8.3B in Q2 2025 to $8.8B in Q2 2026, while net income was essentially flat at $3.2B, so earnings quality is improving but not dramatically outpacing sales.
Profitability
TMUS — Profitability (TTM)
| Metric | TTM |
|---|---|
| Operating Margin (TTM) | 25.2% |
| Net Margin (TTM) | 11.5% |
| Return on Assets (TTM) | 6.0% |
| Return on Equity (TTM) | 18.0% |
| EBITDA Margin (TTM) | 37.3% |
Source: Yahoo Finance — Trailing Twelve Months (TTM)
TTM gross margin was 63.0%, EBITDA margin was 37.3%, operating margin was 25.2%, and net margin was 11.5%. The spread from gross to operating margin is 37.8 percentage points, which tells me T-Mobile US is past the pure scale-build phase and is now converting a large share of gross profit into operating profit, although the remaining opex load still keeps a meaningful gap in place. EBITDA margin sits 12.1 points above operating margin, so depreciation and amortisation still absorb a material slice of earnings, which is normal for a network-heavy carrier. TTM ROA was 6.0% and TTM ROE was 18.0%; the 12.0-point gap suggests returns are being amplified by leverage rather than by asset efficiency alone.
Valuation
TMUS — Valuation Multiples
| Metric | Value |
|---|---|
| Trailing P/E | 17.1 |
| Forward P/E | 11.3 |
| EV/Revenue | 3.2 |
| EV/EBITDA | 8.5 |
| Analyst Target Price – Low (USD) | 169 |
| Analyst Target Price – Mean (USD) | 241.8 |
| Analyst Target Price – High (USD) | 296 |
Source: Yahoo Finance
T-Mobile US trades at 3.2x EV/Revenue and 8.5x EV/EBITDA, with a 17.1x trailing P/E, 11.3x forward P/E, 1.9x Price/Sales, 3.1x Price/Book, and a 6.5% FCF yield. At a current share price of $163, the market is paying about 11.3x forward EPS of $14.4, which implies investors are underwriting mid-teens earnings power with continued cash conversion rather than a low-growth utility profile. The PEG ratio of 0.6x is the clearest growth signal here: the stock is not priced as a no-growth telecom, because the market is assigning a discount to the company’s expected earnings growth relative to the multiple.
On the analysis here, I would put fair value in a range of $106-$138 per share, using the peer EV/Revenue range already discussed against T-Mobile’s revenue base and balance sheet. That range sits below the $169 low and $241.8 mean analyst targets, which tells me the sell-side is more optimistic than I am about how much of the growth and cash flow should be capitalized into the stock. I also think the implied EPS path matters: with forward EPS at $14.4, T-Mobile is ahead of T at $2.6, VZ at $5.3, BCE at $1.9, and RCI at $3.4, but that advantage is already reflected in the multiple, so the stock needs continued execution rather than just stable earnings. In my view, the valuation is neutral to slightly expensive because the market is already paying for the company’s growth and cash generation.
Leverage
TMUS — Leverage & Coverage (Quarterly)
| Metric | Value |
|---|---|
| Total Debt/Equity % (mrq) | 214 |
| Current Ratio (mrq) | 0.9 |
| Total Debt (mrq, USD Mil) | 120,427 |
| Operating Cash Flow (TTM, USD Mil) | 28,833 |
| Levered Free Cash Flow (TTM, USD Mil) | 11,336 |
| Net Debt/EBITDA (TTM) | 3.4 |
| FCF Margin % (TTM) | 12.3% |
Source: Yahoo Finance — Quarterly Financial Statements
T-Mobile’s leverage is elevated but still serviceable. Total Debt/Equity was 214.0% (mrq), Current Ratio was 0.9x (mrq), and Total Debt was $120.4B, so the balance sheet is debt-heavy and near-term liquidity is tight rather than abundant. Against that, Operating Cash Flow was $28.8B, Levered Free Cash Flow was $11.3B, Net Debt/EBITDA was 3.4x, and FCF Margin was 12.3%.
In my opinion, this is medium refinancing risk because cash generation is strong enough to support the debt load, but the sub-1.0 current ratio leaves little cushion if integration costs, spectrum spending, or refinancing terms worsen. EBITDA is converting into cash, but not fully, which points to a capital-intensive model rather than a cash-rich one. The leverage profile is the main reason I am not more aggressive on the stock.
Insider Activity
The insider transaction record is clearly net selling: 32 open-market sales versus 2 open-market purchases, with $212.5M of sales against $1.9M of purchases over 58 Form 4 filings from 2023-12-15 to 2026-05-21. The pattern is broad rather than concentrated, because multiple executives and directors sold across several dates instead of one isolated seller dominating the tape. In my view, that is a bear signal for alignment between insiders and shareholders.
Comparable Analysis
LF0 has published standalone analyses of these peers: Verizon (VZ) Stock: 2026 Valuation, 5Y Beta & Dividend Thesis (VZ) (rated Hold).
Growth
| Company | Revenue TTM (USD Mil) | Revenue Growth YoY % | Diluted EPS TTM |
|---|---|---|---|
| TMUS | 92,189 | 7.9% | 9.6 |
| T | 127,239 | 2.3% | 3 |
| VZ | 138,895 | -0.7% | 3.8 |
| AMX | 955,730.9 | 3.1% | 1.6 |
| BCE | 24,797 | 1.5% | 4.8 |
| RCI | 22,617 | 7.7% | 8 |
Source: Yahoo Finance
TMUS grew revenue 7.9% TTM and EBITDA to $34.4B, versus T at 2.3%, VZ at -0.7%, AMX at 3.1%, BCE at 1.5%, and RCI at 7.7%. That puts TMUS at the top of the large-cap U.S. wireless group on top-line momentum, and the premium looks justified because it is still converting that growth into 9.6 diluted EPS TTM, ahead of T at 3.0, VZ at 3.8, BCE at 4.8, and RCI at 8.0.
Valuation
| Company | Trailing P/E | Forward P/E | EV/Revenue | EV/EBITDA | Forward EPS | Analyst Target Price – Low | Analyst Target Price – Mean | Analyst Target Price – High | # Analyst Opinions |
|---|---|---|---|---|---|---|---|---|---|
| TMUS | 17.1 | 11.3 | 3.2 | 8.5 | 14.4 | 169 | 241.8 | 296 | 25 |
| T | 8 | 9.5 | 2.6 | 7.4 | 2.6 | 20 | 28.8 | 36 | 24 |
| VZ | 12 | 8.7 | 2.8 | 7.5 | 5.3 | 44 | 51.2 | 62 | 23 |
| AMX | 12.7 | 10.1 | 0.8 | 2.3 | 2.1 | 20.8 | 29.4 | 35 | 15 |
| BCE | 4.2 | 10.7 | 2.6 | 7.3 | 1.9 | 24.7 | 26.5 | 28.3 | 3 |
| RCI | 3.9 | 9.3 | 2.9 | 7 | 3.4 | 35.5 | 38.7 | 41.9 | 3 |
Source: Yahoo Finance
Valuation is mixed, but the FCF yield makes TMUS look less expensive than its headline multiples suggest: TMUS yields 6.5% versus T at 6.1%, VZ at 9.1%, BCE at 13.9%, and RCI at 44.8%, while trading at 3.2x EV/Revenue and 17.1x trailing P/E. The discount to VZ and BCE on FCF yield is not a red flag by itself because TMUS also has the strongest growth profile and a $14.4 forward EPS, well above T at $2.6, VZ at $5.3, BCE at $1.9, and RCI at $3.4. On a peer-multiple basis, the stock still looks rich relative to the group, which is why I think the market is paying for quality rather than value.
Profitability
| Company | Operating Margin (TTM) | Net Margin (TTM) | Return on Assets (TTM) | Return on Equity (TTM) | EBITDA Margin (TTM) |
|---|---|---|---|---|---|
| TMUS | 25.2% | 11.5% | 6.0% | 18.0% | 37.3% |
| T | 24.8% | 16.9% | 4.2% | 18.3% | 35.3% |
| VZ | 23.0% | 11.6% | 5.0% | 15.8% | 36.8% |
| AMX | 21.5% | 9.4% | 6.4% | 21.6% | 33.1% |
| BCE | 22.1% | 25.9% | 4.4% | 30.5% | 35.1% |
| RCI | 22.2% | 27.3% | 3.8% | 30.9% | 42.1% |
Source: Yahoo Finance
TMUS sits in the middle of the pack on profitability rather than at the top. Its 25.2% operating margin and 37.3% EBITDA margin are ahead of T at 24.8% and 35.3%, and VZ at 23.0% and 36.8%, but the more important read is that TMUS’s 63.0% gross margin is above T at 59.7% and VZ at 59.5%. That suggests the gap is not a cost-of-revenue problem; it looks more like a scale and opex advantage that TMUS is using better than the legacy carriers.
Leverage
| Company | Total Debt/Equity % (mrq) | Current Ratio (mrq) | Total Debt (mrq, USD Mil) | Operating Cash Flow TTM (USD Mil) | Free Cash Flow TTM (USD Mil) | Net Debt/EBITDA (TTM) | FCF Margin % (TTM) |
|---|---|---|---|---|---|---|---|
| TMUS | 214 | 0.9 | 120,427 | 28,833 | 11,336 | 3.4 | 12.3% |
| T | 129.1 | 1 | 165,756 | 39,899 | 10,142 | 3.3 | 8.0% |
| VZ | 184.1 | 0.6 | 193,646 | 38,799 | 17,466.6 | 3.8 | 12.6% |
| AMX | 157.8 | 0.7 | 691,326.8 | 283,994 | 153,238.8 | 1.9 | 16.0% |
| BCE | 172.8 | 0.7 | 41,776 | 6,786 | 2,602.6 | 4.7 | 10.5% |
| RCI | 200 | 0.5 | 45,698 | 6,179 | 7,589.8 | 4.6 | 33.6% |
Source: Yahoo Finance
Leverage is the main trade-off. TMUS carries 214.0% debt/equity and 3.4x net debt/EBITDA, versus T at 129.1% and 3.3x, VZ at 184.1% and 3.8x, BCE at 172.8% and 4.7x, and RCI at 200.0% and 4.6x. The raw debt/equity looks heavy, but the net debt/EBITDA gap versus BCE and RCI shows TMUS is not the most stretched balance sheet in the group, and its 12.3% FCF margin is stronger than T’s 8.0% and BCE’s 10.5%, which means the debt load is being supported by real cash generation rather than accounting earnings alone.
Conclusion
The key tension is simple: T-Mobile’s operating base is strong, but the stock already reflects a lot of that strength, so the question is whether cash flow can keep outrunning leverage. I think the answer is yes, but only modestly. Q2 2026 revenue of $22.8B, up 8.0% year over year, and TTM free cash flow of \$11.3B show the business is still compounding, while the 3.4x net debt/EBITDA ratio and 0.9x current ratio keep the balance sheet from looking flexible enough for a more aggressive call.
I would raise my rating more toward a buy if FCF margin moves above 13.0%, because that would mean roughly $1B of extra annual free cash flow on the current revenue base and would make the leverage profile easier to absorb. I would also want to see the UScellular integration and the fiber investments translate into cleaner operating leverage, since the $1.2B synergy target and the $2.6B cost-to-achieve bill only help if the savings arrive on schedule rather than getting pushed out.
I would move from hold to sell if revenue growth slips back toward the low single digits for two consecutive quarters or if net debt/EBITDA moves above 4.0x, because that would tell me the company is paying for growth with too much balance-sheet strain. A weaker scenario would be slower postpaid net adds, a flatter ARPA trend, and FCF margin slipping back toward 10.0%, which would cut roughly $2B from annual free cash flow versus today and would make the current valuation harder to defend.
Weighing both cases, I think the bull case is more likely to show up first because the network and spectrum position are already in place, while the main bear risk is execution on integration and capital discipline. The stock is not cheap enough for me to call it a strong buy, but the operating base is strong enough that I would rather own it than wait for a better entry.
What to Watch Next
- FCF margin above 13.0% — would support a more constructive rating.
- Net debt/EBITDA above 4.0x — would make the balance sheet look more stretched.
- Revenue growth in the low single digits for two quarters — would weaken the thesis.
- Postpaid net adds and ARPA — would show whether scale is still compounding.
- UScellular synergy capture versus the $2.6B cost-to-achieve bill — would show whether integration is on track.
What’s your take? I rated T-Mobile US (TMUS) HOLD above — but the goal here is to get this right, not just to publish an opinion. What would you add to this analysis, or which risk or catalyst do you think I’m under- or over-weighting? Tell me in the comments.
Sources
- SEC 10-K Annual Report — filed 2026-02-11
- SEC 8-K Filing (2026-04-28)
- SEC 8-K Filing (2026-04-23)
- SEC 8-K Filing (2026-03-31)
- SEC 8-K Filing (2026-03-27)
- SEC 8-K Filing (2026-02-19)
- SEC 8-K Filing (2026-02-11)
- SEC Form 4 Insider Transaction (2026-05-26)
- SEC Form 4 Insider Transaction (2026-05-04)
- SEC Form 4 Insider Transaction (2026-05-04)
- SEC 10-K Annual Report — FY2026
- SEC 10-K Annual Report — FY2025
- SEC 10-K Annual Report — FY2024
- SEC 10-K Annual Report — FY2023
- SEC 10-K Annual Report — FY2022
Data sourced from Yahoo Finance and SEC EDGAR. Not investment advice.
Leave a Comment