
| Company | Oct 25 | Nov 25 | Dec 25 | Jan 26 | Feb 26 | Mar 26 | Apr 26 | May 26 | Jun 26 | Jul 26 | Aug 26 | Sep 26 | 12-Mo |
|---|---|---|---|---|---|---|---|---|---|---|---|---|---|
| FISV | -48% | -8% | +9% | -5% | -2% | -10% | +12% | -10% | -13% | +10% | -1% | -15% | -65% |
| USB | -3% | +5% | +10% | +5% | -3% | -4% | +9% | -3% | +11% | +4% | -2% | -5% | +24% |
| MA | -3% | -0% | +4% | -5% | -4% | -3% | +1% | -2% | +4% | +12% | +3% | -6% | -2% |
| PYPL | +3% | -9% | -7% | -10% | -12% | -2% | +11% | -11% | -3% | +32% | -8% | -0% | -21% |
| JPM | -1% | +1% | +3% | -5% | -2% | -2% | +7% | -4% | +9% | +8% | +1% | -7% | +7% |
| FITB | -7% | +4% | +9% | +7% | -1% | -5% | +9% | -2% | +14% | +0% | -5% | -5% | +17% |
Source: Yahoo Finance monthly adjusted close.
Quick Thesis
- Rated sell — revenue is softening while margins and leverage remain under pressure.
- Core strength: recurring processing and services revenue was 80% of 2025 revenue.
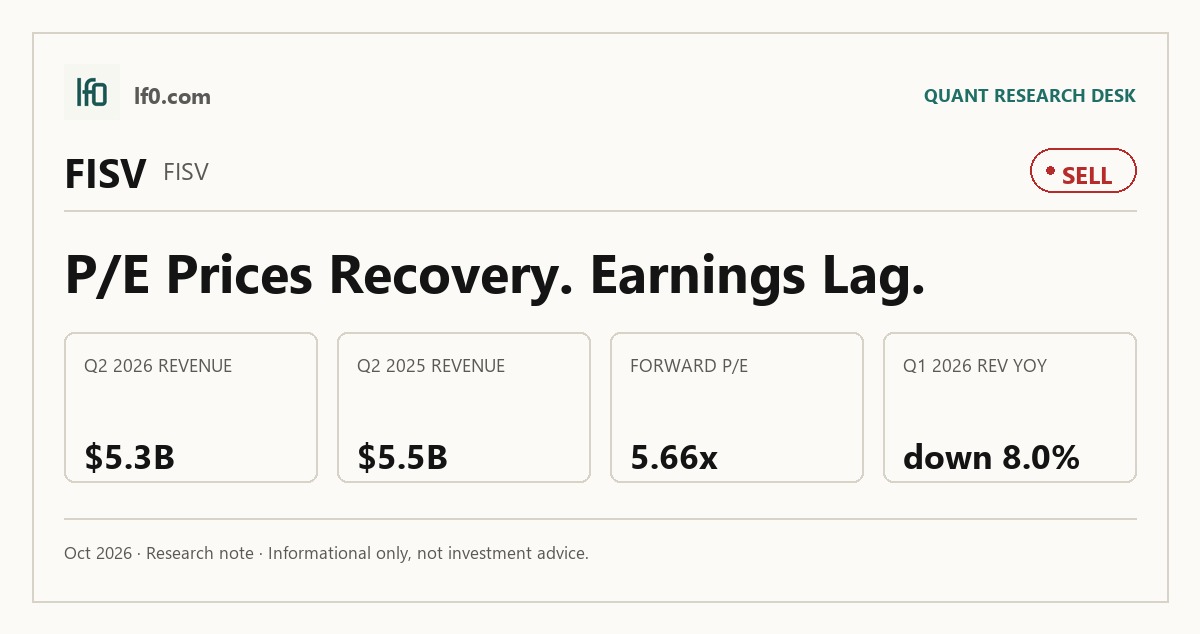
- Core risk: Q2 2026 revenue was 5.3B, down from 5.5B a year earlier.
- Valuation looks cheap on earnings at 8.7x trailing P/E, but not on momentum.
- I would raise my rating only if revenue reaccelerates and operating margin stays above 30.0%.
Executive Summary
Rating: SELL | FISV
We’ll begin tracking this call’s performance since publication once sufficient adjusted-close data is available.
I would put my rating as a sell because the business still has a recurring-revenue base, but the latest numbers show that earnings momentum is not keeping pace with the valuation reset. Fiserv remains a large payments and financial technology processor, yet the stock is already near the low end of its 52-week range and the market is still asking investors to believe in a recovery that has not shown up cleanly in the quarterly data.
The key strength is the franchise itself: processing and services revenue was 80% of 2025 revenue, and that mix gives the company a durable fee base. The key weakness is that Q2 2026 revenue was 5.3B, only slightly above the prior quarter and below the 5.5B level a year earlier, while EBITDA fell to 2B from 2.5B over the same span. I would move from sell toward hold only if the next two quarters show revenue holding above 5.3B and operating margin staying above 30.0%, which would tell me the operating reset is finally feeding through to earnings.
Company Profile
Fiserv is a global payments and financial technology company that earns most of its revenue from account processing, digital banking, card issuer processing, network services, merchant acquiring, e-commerce, and the Clover cloud-based point-of-sale platform. In 2025, processing and services revenue was 80% of total revenue, so the model is built on recurring transaction volume and contract fees rather than one-time product sales.
The company was formed in 1984 and became a public company through the 2019 merger of Fiserv and First Data, which broadened it into a merchant and financial services platform. It is headquartered in Milwaukee, Wisconsin and listed on Nasdaq under FI.
Fiserv operates across the U.S. and Canada, Europe, the Middle East and Africa, Latin America, and Asia Pacific. The company said 84% of 2025 revenue came from the U.S. and Canada, with 16% from international markets, and it had more than 38,000 employees worldwide at year-end 2025.
Economic Moat
Business Model
Clover is the clearest structural advantage in the business because it combines merchant acquiring, POS hardware, software, and value-added services into one operating system for small businesses. In my view, that installed base is hard to copy quickly because it is already embedded through direct sales, ISVs, ISOs, financial institutions, and strategic partnerships, and the platform is still being extended into Australia, Singapore, Brazil, Mexico, Belgium, Spain, and Japan. The secondary moat is the processing and services mix: with 80% of 2025 revenue coming from recurring fees, the company is less exposed to one-off product cycles than a typical software or hardware vendor.
That moat is also reinforced by the network layer. Accel, STAR, MoneyPass, Zelle, CheckFree RXP, and Commerce Hub all deepen integration with merchants and financial institutions, which makes switching more cumbersome once the platform is embedded. I think that matters because the company’s earnings base depends on keeping transaction flow inside the network, not just winning one contract at a time.
Business & Operating Risks
The biggest disclosed risk is client and merchant concentration through renewals, alliances, and network access. According to the risk factors in the company’s SEC 10-K, larger clients can seek lower prices, move services in-house, or terminate at renewal, while government contracts can be ended for convenience or reduced unilaterally. For a business built on fixed-term processing relationships, that is not boilerplate; a few large renewals can move both revenue and margin.
Technology displacement is the other major threat, especially from AI-enabled competitors and embedded-finance platforms. The filing warns that large technology companies, start-ups, and international providers may move faster or use AI more effectively, which is a real risk for a company that is still spending heavily on platform refreshes and product expansion. Operational and cyber disruption also matters because a payments processor depends on uninterrupted service, and outages can trigger service credits, litigation, and client loss.
The disclosed risks do not break the moat, but they do pressure the very features that support it: renewal stickiness, network integration, and Clover adoption. If a large client or partner starts pulling volume out of the platform, the managed-fee advantage that underpins the model would be the first thing to weaken.
Management Discussion & Analysis
Management is responding to those risks, but not in a way that makes me comfortable calling the turnaround complete. The One Fiserv action plan is aimed at client focus, Clover expansion, embedded finance, stablecoin, and AI-driven efficiency, which is the right response to competitive and technology pressure. At the same time, the company completed $856M of acquisitions, bought the remaining 49.9% of AIB Merchant Services for $420M, and repurchased $5.6B of stock, so capital allocation is still leaning toward scale and shareholder returns rather than balance-sheet repair.
That matters because the numbers have not yet fully validated the plan. 2025 operating margin fell to 27.5% and total expenses rose 5% to 15.4B, so the cost program has not yet offset higher distribution partner payments, data processing costs, and transformation spending. Management is clearly active, but in my view it has not yet proven to me that the operating reset is translating into cleaner earnings quality.
Recent Events
The most important recent event was the February 18, 2026 supplemental CEO equity award, which gave Michael P. Lyons about 18M of performance share units and 12M of time-vesting restricted stock units. Because the award is tied to the One Fiserv action plan, it strengthens alignment if execution improves, but it also tells me the board is still paying up to keep leadership in place while the transformation is unfinished.
The May 5, 2026 and February 10, 2026 8-Ks were routine earnings releases, so they did not add a new strategic catalyst. The May 21, 2026 annual meeting was more informative on governance: shareholders re-elected the full board, approved executive pay on an advisory basis, and rejected an independent board chair proposal. That leaves the current control structure intact, which gives management room to execute but also means investors are still waiting for operating proof rather than a governance reset.
Financial Analysis
Growth
FISV — Financial Growth (Quarterly, USD Mil)
| Metric | 2025-06-30 | 2025-09-30 | 2025-12-31 | 2026-03-31 | 2026-06-30 |
|---|---|---|---|---|---|
| REVENUE (USD Mil) | 5,516 | 5,263 | 5,284 | 5,027 | 5,292 |
| EBIT (USD Mil) | 1,668 | 1,396 | 1,346 | 954 | 1,151 |
| EBITDA (USD Mil) | 2,470 | 2,184 | 2,149 | 1,773 | 2,008 |
| NET INCOME (USD Mil) | 1,026 | 792 | 811 | 571 | 627 |
| DILUTED EPS | 1.9 | 1.5 | 1.5 | 1.1 | 1.2 |
Source: Yahoo Finance — Quarterly Financial Statements
Revenue was 5.5B in Q2 2025, 5.3B in Q3 2025, 5.3B in Q4 2025, 5B in Q1 2026, and 5.3B in Q2 2026. The pattern is flat to slightly down, and Q2 2026 was still below Q2 2025, so I do not see a reacceleration yet.
EBITDA moved from 2.5B in Q2 2025 to 2B in Q2 2026, while net income fell from 1B to 627M over the same period. That tells me the business is still producing earnings, but the operating leverage is not strong enough yet to offset softer top-line momentum.
Profitability
FISV — Profitability (TTM)
| Metric | TTM |
|---|---|
| Operating Margin (TTM) | — |
| Net Margin (TTM) | — |
| Return on Assets (TTM) | — |
| Return on Equity (TTM) | — |
| Gross Margin (TTM) | — |
| EBITDA Margin (TTM) | — |
Source: Yahoo Finance — Trailing Twelve Months (TTM)
TTM profitability data are not disclosed in the table, so the quarterly earnings line is the better guide. EBITDA of 2B in Q2 2026 still converted into 627M of net income, which shows the core processing franchise remains profitable even as growth slows. The gap between revenue and earnings is what matters here: the model still works, but it is not compounding fast enough to justify complacency.
Valuation
FISV — Valuation Multiples
| Metric | Value |
|---|---|
| Current Share Price (USD) | 45.4 |
| Market Cap (USD Mil) | 24,153 |
| Trailing P/E | 8.7 |
| Forward P/E | 5.7 |
| Price/Book (mrq) | 0.9 |
| Analyst Target Price – Low (USD) | 40 |
| Analyst Target Price – Mean (USD) | 59.8 |
| Analyst Target Price – High (USD) | 106 |
| # Analyst Opinions | 26 |
Source: Yahoo Finance
Fiserv trades at 45.4 per share, or 8.7x trailing earnings and 5.66x forward earnings, with a 0.896x price/book multiple. That is not expensive on earnings, but it is also not a clean bargain when the stock is still near the bottom of its 52-week range and the latest quarter has not shown a clear inflection in revenue or EBITDA.
The analyst target range is 40 to 106, with a mean of 59.8 across 26 opinions. My fair-value view sits inside that range, but closer to the lower half because I weight the flat revenue trend and margin pressure more heavily than the consensus appears to. On that basis, I would put fair value around the mid-$40s to low-$50s, which is modestly above the current price but well below the consensus mean.
On earnings power, I would frame the stock as implying a roughly flat to low-single-digit EPS trajectory rather than a sharp step-up. That is consistent with the company’s own forward P/E of 5.66x, but it looks less compelling next to peers that already show clearer growth and cash conversion. In other words, the market is paying for a recovery, while the current numbers still look more like stabilization.
Leverage
FISV — Leverage & Coverage (Quarterly)
| Metric | Value |
|---|---|
| Total Debt/Equity % (mrq) | — |
| Current Ratio (mrq) | — |
| Total Debt (mrq, USD Mil) | — |
| Operating Cash Flow (TTM, USD Mil) | — |
| Levered Free Cash Flow (TTM, USD Mil) | — |
| Net Debt/EBITDA (TTM) | — |
| FCF Margin % (TTM) | — |
Source: Yahoo Finance — Quarterly Financial Statements
The leverage table does not disclose debt, cash flow, or net debt ratios, so I cannot build a clean balance-sheet model from the table alone. What I can say is that the company is still generating earnings, with Q2 2026 EBITDA of 2B and net income of 627M, and that supports some financial flexibility.
Even so, the absence of explicit leverage data matters because the stock is already weak and the company is still funding acquisitions, buybacks, and transformation spending. I would want clearer evidence that earnings growth is outrunning capital needs before treating leverage as a source of upside.
Insider Activity
I do not see open-market insider buying in the filing window, and the available record points to 10 open-market sales across 109 Form 4 filings from 2025-02-05 to 2026-05-21. That is not decisive on its own, but it does not help the case for insider confidence either.
Comparable Analysis
Growth
| Company | Revenue TTM (USD Mil) | Revenue Growth YoY % | Diluted EPS TTM |
|---|---|---|---|
| FISV | — | — | — |
| USB | 27,321 | 10.4% | 5 |
| MA | 35,083 | 14.1% | 18.2 |
| PYPL | 34,128 | 4.8% | 5.3 |
| JPM | 186,328 | 30.4% | 23.3 |
| FITB | 10,095 | 51.8% | 3 |
Source: Yahoo Finance
Fiserv does not show a disclosed TTM revenue growth figure in the table, which is a problem when peers are still posting visible growth. USB grew revenue 10.4%, MA 14.1%, PYPL 4.8%, JPM 30.4%, and FITB 51.8%, so Fiserv is not winning on top-line momentum. The market is therefore not paying for growth leadership here; it is paying for a recovery that still needs to show up.
Valuation
| Company | Current Share Price (USD) | Trailing P/E | Forward P/E | EV/Revenue | EV/EBITDA | Price/Sales (TTM) | Price/Book (mrq) | Market Cap (USD Mil) | Forward EPS | Analyst Target Price – Low | Analyst Target Price – Mean | Analyst Target Price – High | # Analyst Opinions |
|---|---|---|---|---|---|---|---|---|---|---|---|---|---|
| FISV | 45.4 | 8.7 | 5.7 | — | — | — | 0.9 | 24,153 | — | 40 | 59.8 | 106 | 26 |
| USB | 56.8 | 11.3 | 9.8 | 4.6 | — | 3.2 | 1.5 | 88,528 | 5.8 | 65 | 70.4 | 77 | 21 |
| MA | 549.5 | 30.2 | 23.9 | 14.1 | 22.3 | 13.7 | 85.9 | 481,363 | 23 | 550 | 666.7 | 740 | 37 |
| PYPL | 53.3 | 10.1 | 9.2 | 1.4 | 7.4 | 1.3 | 2.3 | 45,923 | 5.8 | 36 | 56.9 | 80 | 32 |
| JPM | 332.6 | 14.3 | 13.3 | 3.9 | — | 4.7 | 2.5 | 884,073 | 25 | 305 | 375.8 | 436 | 21 |
| FITB | 49.9 | 16.8 | 10.1 | 6.4 | — | 4.5 | 1.4 | 45,265 | 5 | 55 | 62.6 | 67 | 20 |
Source: Yahoo Finance
Fiserv trades at 8.7x trailing P/E and 5.66x forward P/E, below MA at 30.2x and 23.9x, but above PYPL on a forward basis at 9.2x and not obviously cheaper once the weak price trend is considered. PYPL’s 9.6% FCF yield and MA’s 3.5% show what real cash conversion looks like, while Fiserv has no disclosed yield in the table. The stock’s -65.0% 1-year total return is far worse than USB’s 24.1%, JPM’s 6.9%, FITB’s 17.3%, and PYPL’s -20.8%, which tells me the market has already punished Fiserv more than the peer set.
Profitability
| Company | Operating Margin (TTM) | Net Margin (TTM) | Return on Assets (TTM) | Return on Equity (TTM) |
|---|---|---|---|---|
| FISV | — | — | — | — |
| USB | 39.6% | 29.9% | 1.2% | 12.6% |
| MA | 61.1% | 46.3% | 24.1% | 241.2% |
| PYPL | 17.0% | 14.4% | 4.6% | 24.5% |
| JPM | 50.4% | 34.9% | 1.4% | 17.8% |
| FITB | 39.1% | 23.2% | 0.9% | 8.4% |
Source: Yahoo Finance
Fiserv has no disclosed margin figures in the peer table, while USB posts 39.6% operating margin and 29.9% net margin, PYPL 17.0% and 14.4%, JPM 50.4% and 34.9%, FITB 39.1% and 23.2%, and MA 61.1% and 46.3%. That spread says the peer group is generating visible operating leverage, and MA in particular is converting scale into exceptional profitability. Fiserv’s missing margin disclosure makes it harder to argue for a premium earnings-quality case.
Leverage
| Company | Total Debt/Equity % (mrq) | Current Ratio (mrq) | Total Debt (mrq, USD Mil) | Operating Cash Flow TTM (USD Mil) | Free Cash Flow TTM (USD Mil) | Net Debt/EBITDA (TTM) | FCF Margin % (TTM) |
|---|---|---|---|---|---|---|---|
| FISV | — | — | — | — | — | — | — |
| USB | — | — | 99,696 | 12,525 | — | — | — |
| MA | 439.6 | 1.1 | 24,643 | 17,437 | 16,961.2 | 0.6 | 48.4% |
| PYPL | 71.8 | 1.3 | 14,221 | 7,475 | 4,423.1 | 0.5 | 13.0% |
| JPM | — | — | 1,343,307 | -162,534 | — | — | — |
| FITB | — | — | 24,935 | 3,665 | — | — | — |
Source: Yahoo Finance
The peer set shows that leverage is not the main issue for most of these names; cash conversion is. PYPL carries 0.5x net debt/EBITDA and 13.0% FCF margin, while MA carries 0.6x net debt/EBITDA and 48.4% FCF margin. Fiserv cannot claim a balance-sheet advantage over those names because the table does not disclose the same leverage and cash-flow metrics.
Conclusion
I would put my rating as a sell because the core business still looks durable, but the latest numbers do not yet show that the operating reset is strong enough to justify a more constructive call. The tension is simple: Fiserv has a recurring-fee franchise and a profitable processing base, yet revenue is flat to down and EBITDA has slipped from 2.5B in Q2 2025 to 2B in Q2 2026.
The bull case would start to matter if revenue holds above 5.3B for the next two quarters and operating margin stays above 30.0%, meaning the company is protecting profitability while the One Fiserv plan works through the system. If EBITDA can stay near 2B and net income remain above 600M a quarter, I would be more willing to move the rating toward hold because that would show the earnings base is stabilizing rather than just shrinking more slowly.
The bear case is straightforward too. If revenue falls back below 5B or EBITDA slips under 1.8B, I would move the rating further toward sell because that would tell me the recent softness is not a one-off and that pricing pressure or client churn is still working through the franchise. In that scenario, the current 5.66x forward P/E would stop looking like a recovery multiple and start looking like a value trap.
For now, I think the market is right to stay cautious. The franchise is not broken, but it has not yet proven to me that the margin and revenue trend have turned enough to justify paying ahead of the evidence.
What to Watch Next
- Revenue above 5.3B for two straight quarters — would support a move toward hold.
- Operating margin above 30.0% — would show the cost reset is holding.
- EBITDA near 2B — would confirm earnings power is stabilizing.
- Net income above 600M per quarter — would support a stronger cash-earnings case.
- Revenue below 5B or EBITDA below 1.8B — would push the rating further toward sell.
What’s your take? I rated Fiserv (FISV) SELL above — but the goal here is to get this right, not just to publish an opinion. What would you add to this analysis, or which risk or catalyst do you think I’m under- or over-weighting? Tell me in the comments.
Sources
- SEC 10-K Annual Report — filed 2026-02-19
- SEC 8-K Filing (2026-05-22)
- SEC 8-K Filing (2026-05-05)
- SEC 8-K Filing (2026-02-20)
- SEC 8-K Filing (2026-02-10)
- SEC Form 4 Insider Transaction (2026-05-22)
- SEC Form 4 Insider Transaction (2026-05-22)
- SEC Form 4 Insider Transaction (2026-05-22)
- SEC 10-K Annual Report — FY2026
- SEC 10-K Annual Report — FY2025
- SEC 10-K Annual Report — FY2024
- SEC 10-K Annual Report — FY2023
- SEC 10-K Annual Report — FY2022
Data sourced from Yahoo Finance and SEC EDGAR. Not investment advice.
Leave a Comment