
| Company | Oct 25 | Nov 25 | Dec 25 | Jan 26 | Feb 26 | Mar 26 | Apr 26 | May 26 | Jun 26 | Jul 26 | Aug 26 | Sep 26 | 12-Mo |
|---|---|---|---|---|---|---|---|---|---|---|---|---|---|
| AMAT | +14% | +8% | +2% | +25% | +16% | -8% | +15% | +14% | +61% | -30% | -10% | +12% | +151% |
| LRCX | +18% | -1% | +10% | +36% | +0% | -9% | +21% | +23% | +36% | -32% | +3% | +9% | +146% |
| KLAC | +12% | -3% | +3% | +18% | +7% | -3% | +19% | +10% | +57% | -39% | -4% | +11% | +82% |
| COHR | +23% | +24% | +12% | +15% | +22% | -8% | +34% | +13% | +9% | -33% | +6% | +4% | +167% |
| TER | +32% | +0% | +6% | +25% | +33% | -7% | +16% | +9% | +29% | -24% | -5% | +15% | +192% |
| ONTO | +4% | +6% | +10% | +28% | +7% | -5% | +44% | -12% | +47% | -32% | +3% | +15% | +138% |
Source: Yahoo Finance monthly adjusted close.
Quick Thesis
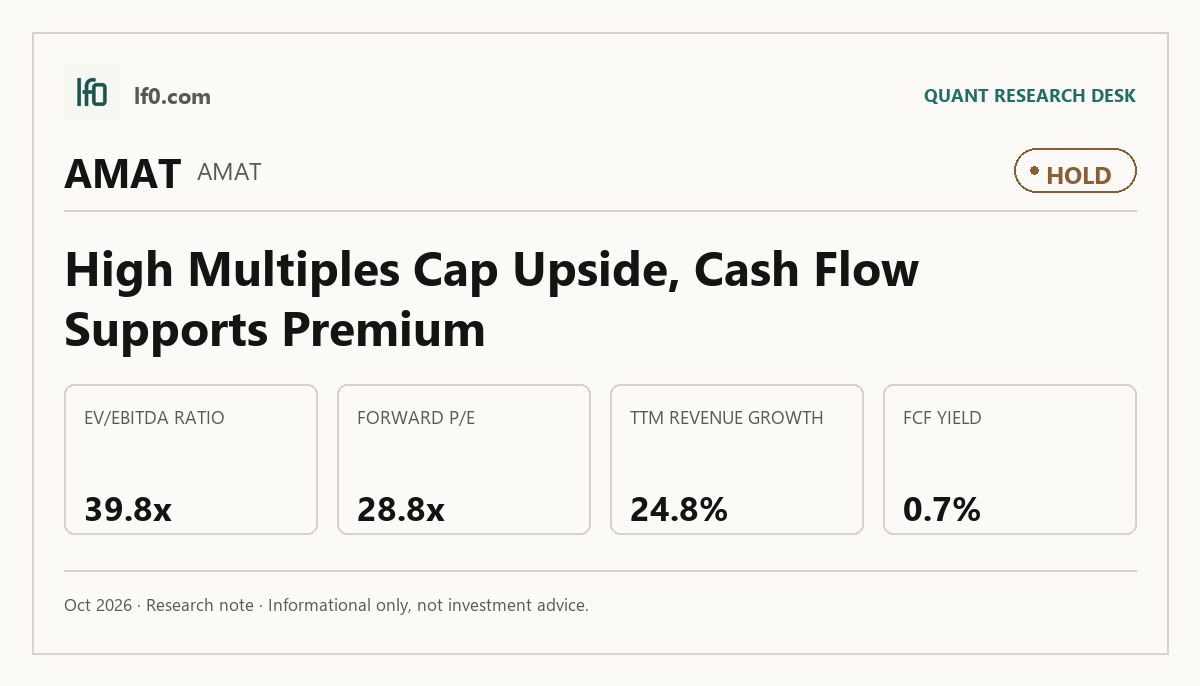
- Rated hold — valuation already discounts strong execution and AI demand.
- Strongest support: $8.4B TTM operating cash flow and $3.1B TTM levered free cash flow.
- Main risk: 39.8x EV/EBITDA leaves little room if growth or margins soften.
- Peer stance: rich versus peers on EV/EBITDA and forward P/E.
- I would turn more constructive if quarterly revenue stays above $9B and operating margin holds above 33.0%.
Executive Summary
Rating: HOLD | AMAT
We’ll begin tracking this call’s performance since publication once sufficient adjusted-close data is available.
I would put my rating as a Hold because Applied Materials has a strong balance sheet and solid free cash flow, but the stock already prices in a lot of the AI and advanced-packaging upside. TTM operating cash flow was $8.4B and levered free cash flow was $3.1B, which gives the company room to keep buying back stock and funding R&D, yet the 39.8x EV/EBITDA multiple and 0.7% FCF yield leave little margin for error if semiconductor capex pauses or China restrictions bite harder. I would raise my rating more towards a Buy if quarterly revenue stays above $9B, meaning the current demand step-up holds, and operating margin stays above 33.0%, which would show the earnings base is still expanding rather than peaking.
Company Profile
Applied Materials, Inc. was incorporated in 1967 and is listed on Nasdaq under AMAT. It designs, manufactures, and services wafer fabrication and display fabrication tools used to make semiconductors and advanced displays, with revenue coming from equipment sales, Applied Global Services (AGS, the installed-base service and spares business), factory automation software, and related support. The company operates three segments: Semiconductor Systems, AGS, and Display, with Semiconductor Systems the largest revenue contributor. It serves foundry, logic, DRAM, and flash customers, and its tools are used in AI servers, mobile devices, automobiles, and consumer electronics. Applied has more than 22,000 active patents, about 35,700 employees across 24 countries, and more than 200 AGS distribution locations. Its manufacturing and supply chain span the United States, Singapore, Japan, China, Korea, Taiwan, Israel, and other countries in Asia and Europe.
Economic Moat
Business Model
The semiconductor capital equipment industry’s most comprehensive portfolio is the core advantage here, because Applied Materials can combine and co-optimize patterning, transistor and interconnect, metrology, inspection, review, and advanced packaging tools into one process flow. In my view, a well funded competitor cannot replicate that breadth within 3 years because the portfolio spans multiple process steps, requires deep customer integration, and is reinforced by more than 22,000 active patents in the United States and other countries. AGS is a second moat element: it supports a large installed base with services, spares, and factory automation software through a global distribution system in more than 200 locations and trained field engineers near customer sites, which makes switching away from Applied more disruptive for fabs. The direct-sales model and global support network also matter, since the company sells almost entirely through a direct sales force and serves customers that depend on tightly timed capital equipment decisions.
The business has become more concentrated in advanced semiconductor complexity over the last five years. In 2020 and 2021, prior filings described a broad materials engineering company serving semiconductor, display, and related industries, with Display and Adjacent Markets still part of the segment mix; by 2024, the company is organized into Semiconductor Systems, AGS, and Display, and the narrative is much more centered on 300mm tools, advanced packaging, and co-optimized solutions for leading-edge nodes. That shift matters because the company is now more exposed to the highest-value parts of chip manufacturing, where shrinking dimensions, 3D transistors, and heterogeneous integration raise the technical bar for customers and raise the switching cost for suppliers. The 2024 filing also shows a more mature service layer, with AGS built around a large installed base rather than just new tool shipments, which makes the revenue base stickier than it was five years ago. Applied Materials is structurally stronger than it was five years ago because the business has moved further toward integrated, hard-to-replicate process solutions and a larger installed-base service model, even though export rules and customer concentration remain real constraints.
Business & Operating Risks
The biggest disclosed risk is China export controls and licensing friction, because the 2024 10-K says the U.S. Department of Commerce expanded licensing requirements for exports to China, eliminated certain license exceptions, and added Chinese companies to the Entity List. That can block shipments, delay service revenue, and push customers toward foreign or Chinese domestic competitors; the filing is explicit that the company’s inability to obtain licenses “could limit our sales in China” and “adversely affect our results of operations.” This is already materialized in the financial data here: the company disclosed that export rules have “limited the market for certain of our products and services” and “adversely impacted our revenues,” so this is not a hypothetical risk. The same filing also notes multiple subpoenas since 2022 from the U.S. Department of Justice, the Commerce Department Bureau of Industry and Security, and the SEC, which adds legal cost and reputational drag on top of the commercial hit.
Customer concentration is the second major risk. According to their SEC filings, a “relatively limited number of customers account for a substantial portion of our business,” with concentration especially in China, Taiwan, Korea and Japan. That matters because a single customer delay, cancellation, or payment issue can swing quarterly results, and the filing warns that customers may “push out, cancel or refrain from purchasing” equipment, leaving Applied with excess inventory and bad debt expense. The financial data in this article is consistent with that risk having already affected results through volatility in revenue mix and backlog timing, so the risk is active rather than theoretical. If one large customer or one geography slows capex, the damage can flow straight into revenue, margins, and working capital.
Supply chain and manufacturing disruption is the third risk, and it is more than boilerplate because the filing ties it to parts shortages, transportation interruptions, cybersecurity incidents at suppliers, and excess or obsolete inventory charges. The company also says accelerated digital transformation may “exacerbate shortages and strain our manufacturing capacity,” which means demand spikes can hurt as much as demand drops. That risk is already visible in the business model because the filing says shipment delays have “adversely impacted” operations before, and the current financial data shows the company still has to manage a global, capital-intensive production base. A 1.0% to 2.0% miss in supply availability can cascade into delayed installations, lower revenue recognition, and higher logistics cost.
The disclosed risks do not break the moat, but China controls and customer concentration do pressure the very installed-base and process-integration advantage that supports the franchise.
Management Discussion & Analysis
Management is signalling that capital allocation remains shareholder-friendly but still tilted toward growth investment: it issued $700M of 4.8% senior unsecured notes due 2029 in June 2024 and ended the year with $6.2B of senior unsecured notes outstanding, which pushes the next refinancing decision out but does not reduce leverage. The company also kept repurchases aggressive, using $3.8B for common stock buybacks in fiscal 2024 and leaving $8.9B authorized, while paying $1.2B of dividends; that mix tells me management is comfortable returning cash because operating cash flow of $8.7B in fiscal 2024 still covered those outflows, but investors should not read the buybacks as a balance-sheet repair story. At the same time, RD&E expense rose to $3.2B in fiscal 2024 and management explicitly tied that spend to new unit process systems, integrated materials solutions, and expansion into etch, deposition, metrology, inspection, and packaging, which supports the long-term technology roadmap but also means near-term margin gains are being reinvested rather than fully harvested. The narrative around AI, high-bandwidth memory, and advanced packaging is backed by fiscal 2024 Semiconductor Systems revenue of $19.9B and AGS revenue of $6.2B, so the growth message is credible, but the Display segment’s operating margin fell to 5.8% from 13.1% in fiscal 2023, which shows not every end market is contributing equally to the thesis. According to management’s discussion in the 10-K, cash and investments totaled $12.3B at October 27, 2024 and the company still expects liquidity to be sufficient for the next 12 months, so the capital structure is strong enough to fund both buybacks and RD&E, but the balance between returns and reinvestment leaves less room for error if China restrictions or a semiconductor capex pause hit demand. Management is responding to the disclosed risks through liquidity, buybacks, and continued R&D, but the China issue remains unresolved.
In prior filings, management’s tone was more cautious but the core claims were broadly consistent with results. In fiscal 2023, the company emphasized that demand would depend on customer spending on capital equipment and services and that the business was exposed to variable industry conditions; fiscal 2024 confirmed that framing, with revenue rising only 2.5% to $27.2B and growth concentrated in AGS rather than a broad-based equipment upswing. Prior filings also pointed to continued investment in new technologies and market expansion, and fiscal 2024 did show RD&E up $131M to $3.2B and AGS operating income up 19.0% to $1.8B, so the spending thesis translated into better service profitability. The one area where tone and numbers diverged was Display: prior filings treated it as a growth adjacency, but fiscal 2024 operating income there fell to $51M from $114M in fiscal 2023, which suggests management has been more optimistic about that segment than the results justify. Management credibility is decent: the company has generally delivered on its core claims about technology investment and service growth, but the persistent softness in Display and the heavy reliance on external capex cycles mean the narrative is reliable rather than flawless. The overall signal is neutral to mildly bullish because the buyback program and $12.3B liquidity cushion support shareholder returns, while the continued RD&E push and uneven segment mix keep execution risk in view.
Recent Events
The most significant development I see is the June 11, 2024 debt issuance: Applied Materials completed a $700M senior unsecured notes offering due 2029, with proceeds earmarked for general corporate purposes. In my view, that strengthens balance-sheet flexibility rather than signaling stress, because the company added long-dated funding on manageable terms and preserved room to keep investing through the semiconductor cycle.
The operating cadence since then has been steady rather than transformative. Applied filed quarterly earnings releases on May 16, 2024, August 15, 2024, and November 14, 2024, each tied to results for the second, third, and fourth fiscal quarters of 2024. Those filings reinforce that the core thesis remains execution on the existing equipment franchise, not a new strategic pivot, so they leave the competitive position broadly intact.
The March 7, 2024 annual meeting also matters at the margin: all ten directors were elected, the named executive pay vote passed, and KPMG was ratified, while the lobbying and pay-equity shareholder proposals were rejected. I read that as governance continuity, which supports stability but does not change the investment case on its own. Overall, recent 8-Ks have modestly strengthened the thesis through financing flexibility and left the operating story materially unchanged.
Financial Analysis
Growth
AMAT — Financial Growth (Quarterly, USD Mil)
| Metric | 2025-07-31 | 2025-10-31 | 2026-01-31 | 2026-04-30 | 2026-07-31 |
|---|---|---|---|---|---|
| REVENUE (USD Mil) | 7,302 | 6,800 | 7,012 | 7,910 | 9,115 |
| EBIT (USD Mil) | 2,629 | 2,338 | 2,397 | 3,294 | 3,075 |
| EBITDA (USD Mil) | 2,742 | 2,452 | 2,524 | 3,429 | 3,226 |
| NET INCOME (USD Mil) | 1,779 | 1,897 | 2,026 | 2,806 | 2,538 |
| DILUTED EPS | 2.2 | 2.4 | 2.5 | 3.5 | 3.2 |
Source: Yahoo Finance — Quarterly Financial Statements
Revenue moved from $7.3B in 2025-07-31 to $9.1B in 2026-07-31, with a dip to $6.8B in 2025-10-31 before the trend reaccelerated. That uneven path matters because it says the business is cyclical, but the latest $9.1B quarter shows demand is still strong enough to reassert itself after a softer patch. EBITDA rose to $3.2B in the latest quarter and diluted EPS reached 3.2, so earnings are still scaling with sales rather than lagging them. I read that as supportive of the moat because the installed-base and process-complexity advantage is still translating into real operating leverage.
Profitability
AMAT — Profitability (TTM)
| Metric | TTM |
|---|---|
| Operating Margin (TTM) | 33.7% |
| Net Margin (TTM) | 30.1% |
| Return on Assets (TTM) | 15.5% |
| Return on Equity (TTM) | 41.1% |
| Gross Margin (TTM) | 49.4% |
| EBITDA Margin (TTM) | 32.9% |
Source: Yahoo Finance — Trailing Twelve Months (TTM)
TTM gross margin was 49.4%, TTM EBITDA margin was 32.9%, TTM operating margin was 33.7%, and TTM net margin was 30.1%. The spread from gross margin to operating margin is only 15.7 percentage points, which points to a business that is already past the early scaling phase and converting a large share of revenue into operating profit rather than burning it on overhead. TTM return on assets was 15.5% and TTM return on equity was 41.1%, so the ROE is much higher than ROA, which tells me equity returns are being amplified by leverage and a capital-light model rather than by weak asset productivity. The gap between EBITDA margin and net margin is 2.9 points, so depreciation, amortisation, and other below-EBITDA items are not masking a broken earnings profile. The next signal to watch is whether operating margin stays above 30% while net margin holds near it, because that would confirm the company is moving further toward durable profitability rather than relying on accounting add-backs. Overall, profitability is a bull signal.
Valuation
AMAT — Valuation Multiples
| Metric | Value |
|---|---|
| Current Share Price (USD) | 531.8 |
| Market Cap (USD Mil) | 422,011 |
| Enterprise Value (USD Mil) | 403,943 |
| Trailing P/E | 45.8 |
| Forward P/E | 28.8 |
| EV/Revenue | 13.1 |
| EV/EBITDA | 39.8 |
| FCF Yield % (TTM) | 0.7% |
| Forward EPS (USD) | 18.5 |
| Analyst Target Price – Low (USD) | 358 |
| Analyst Target Price – Mean (USD) | 638.9 |
| Analyst Target Price – High (USD) | 900 |
| # Analyst Opinions | 36 |
Source: Yahoo Finance
Applied Materials trades at 13.1x EV/Revenue and 39.8x EV/EBITDA, with a 45.8x trailing P/E and 28.8x forward P/E at a current share price of $531.8. The market is pricing in a long runway of high-margin semiconductor equipment demand, because a 39.8x EV/EBITDA multiple implies investors expect the current earnings base to stay elevated and compound rather than mean-revert. FCF yield is 0.7%, which is a weak cash return for a stock already above $500 per share, so the valuation is not anchored by cheap cash generation. Price/Sales is 13.7x and Price/Book is 16.5x, both rich for a capital-intensive equipment maker, while PEG Ratio is 1.0x, which says the premium is being justified by expected earnings growth rather than by a bargain multiple. Beta is 1.6, so the stock also carries meaningfully higher market sensitivity.
On the analysis here, I would put fair value in a broad range of $500-$620. That sits inside the $358-$900 analyst range and below the $638.9 consensus mean, because I weight the weak 0.7% FCF yield and the 39.8x EV/EBITDA multiple more heavily than the sell-side appears to. Forward EPS is 18.5, and that is rich versus peers only if the market keeps paying a premium for Applied’s larger earnings base and cleaner balance sheet; otherwise, the implied earnings power looks closer to a fair multiple than a bargain one. The valuation picture is still a bear signal in my view, but not because the business is weak — it is because the stock already discounts a lot of the good news.
Leverage
AMAT — Leverage & Coverage (Quarterly)
| Metric | Value |
|---|---|
| Levered Free Cash Flow (TTM, USD Mil) | 3,075.4 |
| Net Debt/EBITDA (TTM) | -0.2 |
| FCF Margin % (TTM) | 10.0% |
Source: Yahoo Finance — Quarterly Financial Statements
Applied Materials’ debt load is manageable, not stretched. Total debt was $7.3B, against a current ratio of 2.4 and total debt/equity of 28.7%, which gives the balance sheet room to absorb a cyclical slowdown. Operating cash flow was $8.4B TTM and levered free cash flow was $3.1B TTM, so cash generation remains ample even after investment needs. Net debt/EBITDA was -0.2x, meaning cash exceeds debt on a net basis, and FCF margin was 10.0%, showing the business still converts sales into cash at a healthy rate. In my opinion, refinancing risk is low unless cash generation weakens materially or a large maturity comes due during a downcycle. This is a bull signal because the company has net cash-like leverage and strong free cash flow, which preserves flexibility for buybacks, R&D, and downturns.
Insider Activity
The insider transaction record I see here is clearly net selling: 14 open-market sales versus 2 open-market purchases, with $31.7M of sales against $6.9M of purchases over 2024-12-20 to 2026-06-04. The activity is concentrated, led by Raja Prabu G. on 2026-06-04, but it is not isolated because the CFO, a director, and the controller also sold. In my view, that is a bear signal for insider alignment because the open-market flow is broadly tilted toward distribution rather than accumulation.
Comparable Analysis
LF0 has published standalone analyses of these peers: LRCX — Equity Research (LRCX) (rated Sell); Teradyne (TER) (rated Hold); Onto Innovation (ONTO) (rated Sell).
Growth
| Company | Revenue TTM (USD Mil) | Revenue Growth YoY % | Diluted EPS TTM |
|---|---|---|---|
| AMAT | 30,837 | 24.8% | 11.6 |
| LRCX | 23,232.7 | 30.0% | 5.8 |
| KLAC | 13,579.5 | 15.2% | 3.7 |
| COHR | 7,118.2 | 33.7% | 4.1 |
| TER | 4,464 | 103.9% | 7.3 |
| ONTO | 1,120.1 | 35.3% | 2.7 |
Source: Yahoo Finance
AMAT’s revenue grew 24.8% TTM to $30.8B, below COHR at 33.7% and LRCX at 30.0%, but above KLAC at 15.2%. TER is the outlier on growth at 103.9%, yet its revenue base is only $4.5B, so the comparison is more about rebound intensity than scale. AMAT’s 11.6 TTM diluted EPS is well above KLAC at 3.7 and COHR at 4.1, which tells me the company is converting growth into earnings more efficiently than the smaller names.
Valuation
| Company | Trailing P/E | Forward P/E | EV/Revenue | EV/EBITDA | FCF Yield % (TTM) | Forward EPS | Analyst Target Price – Low | Analyst Target Price – Mean | Analyst Target Price – High | # Analyst Opinions |
|---|---|---|---|---|---|---|---|---|---|---|
| AMAT | 45.8 | 28.8 | 13.1 | 39.8 | 0.7% | 18.5 | 358 | 638.9 | 900 | 36 |
| LRCX | 58.9 | 28.9 | 17.6 | 47.4 | 0.7% | 11.7 | 290 | 373.8 | 500 | 31 |
| KLAC | 55.1 | 30.1 | 18.8 | 42.3 | 1.0% | 6.7 | 175 | 233.8 | 325 | 26 |
| COHR | 78.1 | 22.9 | 8.2 | 40.9 | -1.0% | 14 | 280 | 412.5 | 500 | 23 |
| TER | 57.1 | 35.7 | 14 | 41.5 | 0.7% | 11.7 | 350 | 446.5 | 550 | 15 |
| ONTO | 116.9 | 26.8 | 13.1 | 47.6 | 1.1% | 11.7 | 330 | 386.4 | 450 | 11 |
Source: Yahoo Finance
AMAT’s FCF yield is 0.7% TTM, equal to LRCX and below KLAC at 1.0% and ONTO at 1.1%, so the cash return is decent but not best in class. On earnings, AMAT trades at 28.8x forward P/E versus LRCX at 28.9x, KLAC at 30.1x, COHR at 22.9x, TER at 35.7x, and ONTO at 26.8x, while its forward EPS of $18.5 is the highest in the group, which means the market is paying a full multiple for the strongest near-term earnings base. Using peer EV/Revenue of 8.2x to 18.8x on AMAT’s $30.8B revenue implies an enterprise value of roughly $252.8B to $581B, or about $306.2 to $652.7 per share after netting $1.9B of net cash and dividing by 793.6M shares; that range brackets the current $531.8 share price, so AMAT looks fairly to slightly expensively valued unless one assigns it a premium for its larger earnings base and cleaner balance sheet. The premium is easier to justify than KLAC’s or LRCX’s only if AMAT keeps turning growth into margin expansion, because the market is already paying for that outcome.
Profitability
| Company | Operating Margin (TTM) | Net Margin (TTM) | Return on Equity (TTM) | Gross Margin (TTM) | EBITDA Margin (TTM) |
|---|---|---|---|---|---|
| AMAT | 33.7% | 30.1% | 41.1% | 49.4% | 32.9% |
| LRCX | 37.4% | 31.3% | 65.1% | 50.5% | 37.2% |
| KLAC | 42.5% | 35.6% | 87.5% | 61.3% | 44.6% |
| COHR | 11.8% | 11.3% | 8.0% | 37.5% | 20.0% |
| TER | 33.2% | 25.8% | 36.5% | 59.2% | 33.7% |
| ONTO | 23.0% | 11.8% | 6.8% | 55.5% | 27.6% |
Source: Yahoo Finance
AMAT’s 33.7% operating margin, 30.1% net margin, 49.4% gross margin, and 32.9% EBITDA margin all sit below KLAC’s 42.5%, 35.6%, 61.3%, and 44.6%, and below LRCX’s 37.4%, 31.3%, 50.5%, and 37.2%, but above COHR’s 11.8%, 11.3%, 37.5%, and 20.0% and ONTO’s 23.0%, 11.8%, 55.5%, and 27.6%. The pattern looks more like a scale and mix gap than a cost-of-revenue problem, because AMAT’s gross margin is close to LRCX while its operating margin trails KLAC, which points to opex intensity rather than a broken product gross profile. ROE at 41.1% is strong, but KLAC and LRCX both post higher returns, so AMAT is good rather than best in class on profitability.
Leverage
| Company | Total Debt/Equity % (mrq) | Net Debt/EBITDA (TTM) | FCF Margin % (TTM) |
|---|---|---|---|
| AMAT | 28.7 | -0.2 | 10.0% |
| LRCX | 33 | -0.2 | 13.3% |
| KLAC | 96.9 | 0.2 | 19.3% |
| COHR | 31.6 | 1.1 | -9.1% |
| TER | 2.9 | -0.2 | 9.8% |
| ONTO | 76.5 | -1.3 | 18.1% |
Source: Yahoo Finance
AMAT’s total debt to equity is 28.7%, below LRCX at 33.0% and COHR at 31.6%, and far below KLAC at 96.9% and ONTO at 76.5%, while its net debt to EBITDA is -0.2x, better than every peer except ONTO at -1.3x. Its FCF margin of 10.0% is solid but trails LRCX at 13.3% and ONTO at 18.1%, which means AMAT’s balance sheet is a competitive strength, but not the most cash-generative one in the group. That combination matters because the market is paying a premium multiple for AMAT even though some peers offer either higher margins or stronger cash conversion at lower leverage.
Conclusion
I would put my rating as a Hold because the key tension is between a very strong balance sheet and a valuation that already assumes the next leg of growth arrives on time. The latest numbers show the business is still executing: revenue reached $9.1B in the most recent quarter, operating margin held above 33%, and net debt remains negative on a TTM basis. But the stock already trades at 39.8x EV/EBITDA and only 0.7% FCF yield, so the market is paying for durability that has not yet been tested through a softer capex cycle.
I would raise my rating more towards a Buy if quarterly revenue stays above $9B for another two quarters and EBITDA margin holds above 32%, because that would tell me the current earnings base is not a peak and that the installed-base/service mix is still supporting incremental profit. If that happens, the company should keep converting roughly 10% of sales into free cash flow, which would make the premium multiple easier to defend and would reduce the gap between Applied and the best-margin peers.
I would move from Hold to Sell if revenue growth falls back below 10% for two consecutive quarters or if operating margin slips under 30%, because that would tell me the market is paying a premium multiple for a cycle that is already rolling over. A drop from 33.7% operating margin to below 30% on the current $30.8B revenue base would imply more than $1.1B of annual operating profit pressure, which would quickly narrow the buyback and reinvestment cushion.
Weighing both paths, I think the Hold case wins because the balance sheet and cash generation are strong enough to absorb a softer patch, but the stock is not cheap enough for me to ignore the valuation risk. I would stay constructive on the business and cautious on the shares until the next two quarters prove that growth and margin expansion can keep outrunning the multiple.
What to Watch Next
- Quarterly revenue above $9B — would support a move toward Buy.
- EBITDA margin above 32% — would show the current earnings base is durable.
- Operating margin above 30% — would keep the premium valuation defensible.
- Net debt/EBITDA staying negative — would preserve balance-sheet flexibility.
- China export restrictions easing — would reduce the main policy overhang.
What’s your take? I rated Applied Materials (AMAT) HOLD above — but the goal here is to get this right, not just to publish an opinion. What would you add to this analysis, or which risk or catalyst do you think I’m under- or over-weighting? Tell me in the comments.
Sources
- SEC 10-K Annual Report — filed 2024-12-13
- SEC 8-K Filing (2024-11-14)
- SEC 8-K Filing (2024-08-15)
- SEC 8-K Filing (2024-06-11)
- SEC 8-K Filing (2024-05-16)
- SEC 8-K Filing (2024-03-11)
- SEC 8-K Filing (2024-02-29)
- SEC Form 4 Insider Transaction (2026-06-05)
- SEC Form 4 Insider Transaction (2026-06-05)
- SEC Form 4 Insider Transaction (2026-05-28)
- SEC 10-K Annual Report — FY2024
- SEC 10-K Annual Report — FY2023
- SEC 10-K Annual Report — FY2022
- SEC 10-K Annual Report — FY2021
- SEC 10-K Annual Report — FY2020
Data sourced from Yahoo Finance and SEC EDGAR. Not investment advice.
Leave a Comment