
| Company | Aug 25 | Sep 25 | Oct 25 | Nov 25 | Dec 25 | Jan 26 | Feb 26 | Mar 26 | Apr 26 | May 26 | Jun 26 | Jul 26 | 12-Mo |
|---|---|---|---|---|---|---|---|---|---|---|---|---|---|
| APP | +22% | +50% | -11% | -6% | +12% | -30% | -8% | -8% | +12% | +37% | -16% | -23% | +1% |
| GOOG | +11% | +14% | +16% | +14% | -2% | +8% | -8% | -8% | +33% | -1% | -6% | +1% | +85% |
| MSFT | -5% | +2% | -0% | -5% | -2% | -11% | -9% | -6% | +10% | +11% | -17% | +25% | -12% |
| AAPL | +12% | +10% | +6% | +3% | -3% | -5% | +2% | -4% | +7% | +15% | -7% | +7% | +49% |
| WIX | +4% | +26% | -18% | -34% | +9% | -16% | -19% | +28% | -17% | -25% | -19% | +21% | -60% |
Source: Yahoo Finance monthly adjusted close.
Executive Summary
Rating: HOLD | APP
Measured from adjusted close on 2026-08-06 to 2026-09-18. Sell ratings are correct when the stock falls; Hold is tracked as a +/-10% range. Daily-close data, not intraday. Calls are tracked for 182 days from publication, then frozen as a final record.
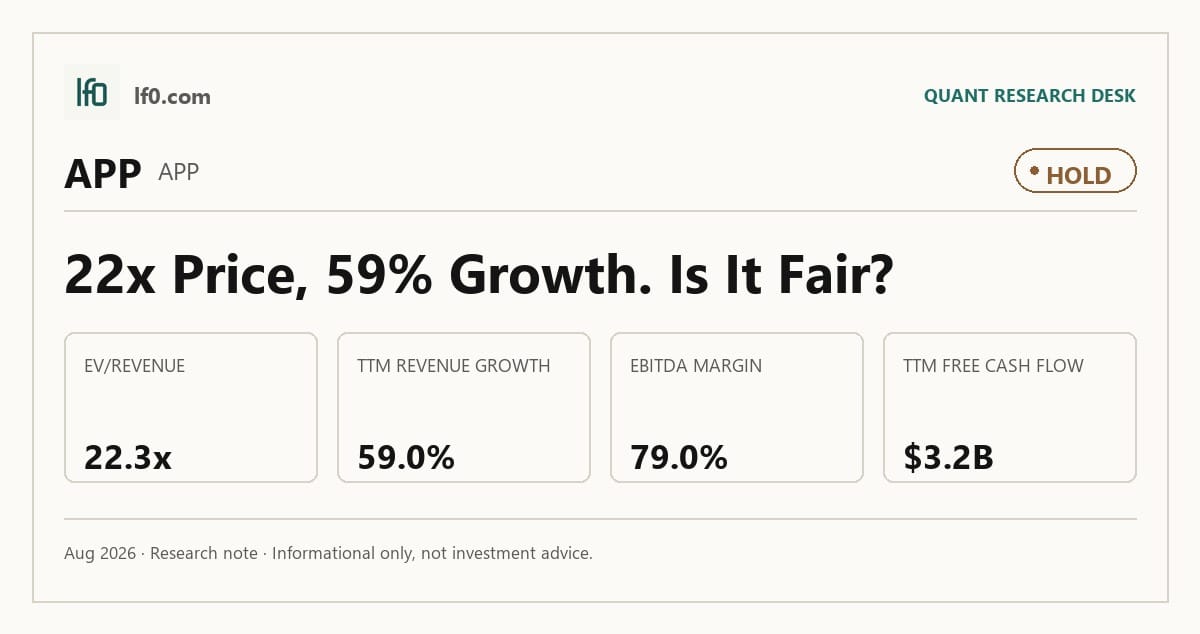
I would put my rating as a Hold because AppLovin’s platform quality is real, but the valuation already discounts a long runway of execution. The company has turned itself into a focused advertising software business, and the post-Apps model is producing strong cash flow, yet the stock still trades at 22.3x EV/Revenue and 28.2x EV/EBITDA on TTM results. In my view, that leaves limited margin of safety if growth normalizes or platform privacy rules bite harder than they have so far. I would raise my rating more towards a Buy if quarterly revenue growth stays above 22.1% and EBITDA holds near $1.5B, because that would show the cleaner ad platform is compounding on a durable base rather than on one strong quarter.
Company Profile
AppLovin provides AI-powered advertising software that matches advertiser demand with publisher supply and monetizes mobile and connected TV inventory through Axon Ads Manager, MAX, Adjust, and Wurl. Axon Ads Manager is the main revenue engine, MAX runs real-time in-app auctions for publishers, Adjust provides measurement and attribution, and Wurl extends the platform into connected TV advertising. The company was incorporated in Delaware in July 2011, went public in 2021, is headquartered in Palo Alto, California, operates in 15 countries, and had 898 employees as of December 31, 2025. It is listed on Nasdaq under APP. AppLovin sold its Apps business on June 30, 2025, leaving the company focused on advertising solutions.
Economic Moat
Business Model
The clearest structural advantage is Axon Ads Manager, which matches advertiser demand with publisher supply through auctions at scale and at microsecond speeds. I feel that a well-funded competitor would struggle to replicate that combination of data density, auction speed, and feedback loop within 3 years. Revenue is generated when advertisers hit return-on-ad-spend targets, so the product improves as clients succeed rather than forcing a one-way software sale. MAX adds a second auction layer for publishers, while Adjust broadens the data set through measurement and fraud prevention and Wurl extends the platform into connected TV.
The business has also become cleaner. AppLovin completed the sale of its Apps business on June 30, 2025, so the current model is centered on advertising software rather than a mix of software and owned content. That matters for the moat because the remaining platform is easier to scale, easier to measure, and more tightly tied to the data flywheel that supports pricing power.
Business & Operating Risks
The most material disclosed risk is dependence on third-party platforms, because Apple, Google, and Meta control key access points in the mobile ecosystem. According to the risk factors in their SEC 10-K, those platforms can change terms, alter fee structures, restrict personal information use, or limit access in ways that make AppLovin’s advertising solutions less effective. The filing specifically points to Apple’s Identifier for Advertisers, App Tracking Transparency, iOS 17 privacy controls, and Google’s Privacy Sandbox and Tracking Protection changes. I view this as a real threat to the moat because the company’s targeting and measurement edge depends on data access it does not control.
Cybersecurity and data misuse are the second major risk. The filing says some of these events have occurred on its systems and expects they will continue to occur, which makes this more than boilerplate. A breach could impair service, damage trust, and force higher compliance spending, especially because the products process large volumes of personal information and source code. Regulatory pressure around privacy, advertising, AI, and minors adds a third layer of risk, with GDPR, CCPA/CPRA, COPPA, the EU AI Act, and the April 8, 2025 U.S. data-transfer rule all raising the cost of operating the platform.
The balance sheet is also a constraint. AppLovin had $3.8B of total debt and a $1B revolving credit facility as of December 31, 2025, so the company is not overlevered, but debt service still competes with buybacks and product investment if cash generation weakens. In my view, these risks pressure the data advantage but do not yet break it; the moat is being tested by platform gatekeepers more than by a direct product substitute.
Management Discussion & Analysis
Management is responding to those risks by simplifying the business and leaning into cash generation. The sale of the Apps business removed a lower-quality operating segment, and the company has used free cash flow to repurchase stock rather than stretch the balance sheet. That is a deliberate answer to platform and regulatory risk: keep the model focused, keep the cash conversion high, and avoid adding complexity that would make the ad platform harder to defend.
The capital allocation signal is clear. In 2025, AppLovin repurchased and retired 5.5 million shares for $2.2B and still ended the year with $3.3B available under its repurchase program. It also borrowed $200M under its $1B revolving facility in March 2025 and repaid it shortly after, which tells me management is using liquidity tactically rather than relying on debt to fund the business. The one caution is that R&D and sales and marketing spending both fell in 2025, so the company is protecting margins while still claiming to invest in Axon AI, e-commerce, and connected TV.
Recent Events
The most important recent event is the April 7, 2026 leadership reset: Basil Shikin will step down as Chief Technology Officer on July 1, 2026, and Victoria Valenzuela will retire as Chief Administrative & Legal Officer on August 1, 2026, with Giovanni Ge and Corina Cacovean moving into those roles. I read that as a mixed signal. It preserves continuity, but it also removes two senior operators in functions that matter directly to product execution and regulatory control.
Board changes point in the same direction. Craig Billings became independent Chairperson on April 2, 2026, replacing Adam Foroughi in that role while Foroughi stayed on as CEO, and Alyssa Harvey Dawson will not stand for re-election at the 2026 annual meeting. That looks like governance cleanup rather than a strategic pivot, so it modestly strengthens oversight without changing the moat thesis.
Financial Analysis
Growth
APP — Financial Growth (Quarterly, USD Mil)
| Metric | 2025-03-31 | 2025-06-30 | 2025-09-30 | 2025-12-31 | 2026-03-31 |
|---|---|---|---|---|---|
| REVENUE (USD Mil) | 1,159 | 1,258.8 | 1,405 | 1,657.9 | 1,842.4 |
| EBIT (USD Mil) | 847.5 | 935.4 | 1,072.4 | 1,304.6 | 1,482.6 |
| EBITDA (USD Mil) | 927.4 | 982.5 | 1,107.5 | 1,337.4 | 1,516.2 |
| NET INCOME (USD Mil) | 576.4 | 819.5 | 835.5 | 1,102.3 | 1,205.6 |
| DILUTED EPS | 1.7 | 2.4 | 2.5 | 3.2 | 3.6 |
Source: Yahoo Finance — Quarterly Financial Statements
Revenue rose from $1,158.9M in Q1 2025 to $1,842.4M in Q1 2026, while EBITDA increased from $927.4M to $1,516.2M over the same period. The key point is that EBITDA is growing faster than revenue, which tells me the platform is still gaining operating leverage rather than buying growth with cost. Net income also climbed from $576.4M to $1,205.6M, and diluted EPS moved from 1.7 to 3.6, so the growth is flowing through to equity holders rather than stopping at the top line. That is consistent with the moat described above: a data-driven ad platform should scale margins as volume rises.
Profitability
APP — Profitability (TTM)
| Metric | TTM |
|---|---|
| Operating Margin (TTM) | 78.2% |
| Net Margin (TTM) | 64.3% |
| Return on Assets (TTM) | 44.2% |
| Return on Equity (TTM) | 266.4% |
| Gross Margin (TTM) | 88.4% |
| EBITDA Margin (TTM) | 79.0% |
Source: Yahoo Finance — Trailing Twelve Months (TTM)
TTM operating margin was 78.2%, net margin was 64.3%, gross margin was 88.4%, and EBITDA margin was 79.0%. Those are exceptional margins for any software-adjacent business, and they show that AppLovin keeps most of each revenue dollar after direct costs. TTM return on assets was 44.2% and return on equity was 266.4%, so the business is generating very high returns on a relatively small equity base. I weight the operating and EBITDA margins most heavily here because they show the core platform is converting scale into profit without relying on heavy non-cash add-backs.
Valuation
APP — Valuation Multiples
| Metric | Value |
|---|---|
| Market Cap (USD Mil) | 112,765 |
| Enterprise Value (USD Mil) | 137,537 |
| Trailing P/E | 25.8 |
| Forward P/E | 15.8 |
| Price/Sales (TTM) | 18.3 |
| Price/Book (mrq) | 47.8 |
| EV/Revenue | 22.3 |
| EV/EBITDA | 28.2 |
| Beta (5Y Monthly) | 2.53 |
| FCF Yield % (TTM) | 2.8% |
| Forward EPS (USD) | 21.3 |
| Analyst Target Price – Low (USD) | 406 |
| Analyst Target Price – Mean (USD) | 656.2 |
| Analyst Target Price – High (USD) | 860 |
| # Analyst Opinions | 30 |
Source: Yahoo Finance
AppLovin trades at 25.8x trailing P/E, 15.8x forward P/E, 22.3x EV/Revenue, and 28.2x EV/EBITDA on TTM results. On my read, fair value sits in a wide range of roughly $406–$860 per share, which is the same broad band implied by analyst targets, but the stock already trades well above the low end and near the middle of that range. With 30 analyst opinions, the consensus is meaningful: the $656 mean target sits above the current price, so my range is not a contrarian outlier, but I still think the market is paying for a very clean execution path. Forward EPS is 21.3, which is rich versus peers on an absolute basis only because the company’s margins are so much higher; the real question is whether that earnings power can keep compounding at a pace that justifies the 22.3x revenue multiple.
I would keep the rating at Hold because the valuation already reflects a lot of the post-Apps simplification. The company’s 2.8% FCF yield and 47.8x price/book tell me the equity is priced for continued cash conversion, not for asset backing, so the burden of proof stays on growth and margin durability.
Leverage
APP — Leverage & Coverage (Quarterly)
| Metric | Value |
|---|---|
| Total Debt/Equity % (mrq) | 162.9 |
| Current Ratio (mrq) | 3.2 |
| Total Debt (mrq, USD Mil) | 3,849.8 |
| Operating Cash Flow (TTM, USD Mil) | 4,439.3 |
| Levered Free Cash Flow (TTM, USD Mil) | 3,180.1 |
| Net Debt/EBITDA (TTM) | 0.2 |
| FCF Margin % (TTM) | 51.6% |
Source: Yahoo Finance — Quarterly Financial Statements
Total debt to equity was 162.9% mrq, current ratio was 3.244x, and total debt was $3.8B mrq. That looks levered on a balance-sheet basis, but the cash flow profile is the more important lens: operating cash flow was $4.4B TTM, levered free cash flow was $3.2B TTM, net debt/EBITDA was 0.2x, and FCF margin was 51.6% TTM. In other words, the company has debt, but it also has enough cash generation to service it comfortably. The leverage profile supports the equity thesis rather than threatening it, provided free cash flow stays near the current run rate.
Insider Activity
The insider record shown here is one-sided: 8 open-market sales by WEBB MAYNARD G JR on 2026-06-05, with no open-market purchases in the period summarized. I would not overread a single-day cluster, but the absence of offsetting buying does matter when the stock already trades at a premium multiple. It is a small negative signal, not a thesis breaker.
Comparable Analysis
Growth
| Company | Revenue TTM (USD Mil) | Revenue Growth YoY % | EBITDA TTM (USD Mil) | Diluted EPS TTM |
|---|---|---|---|---|
| APP | 6,164.2 | 59.0% | 4,872.1 | 13 |
| GOOG | 445,866 | 24.2% | 173,164 | 19.9 |
| MSFT | 331,839 | 17.7% | 194,237 | 17.9 |
| AAPL | 466,823 | 16.4% | 167,959 | 8.7 |
| WIX | 2,133.7 | 14.9% | -147.8 | -3.4 |
Source: Yahoo Finance
AppLovin’s revenue growth was 59.0% TTM, ahead of GOOG at 24.2%, MSFT at 17.7%, AAPL at 16.4%, and WIX at 14.9%. EBITDA was $1,516.2M TTM and diluted EPS was 13, which shows the growth is translating into earnings rather than just scale. That combination is why the market is willing to pay a premium multiple, even though the peer set is much larger and more diversified.
Valuation
| Company | Trailing P/E | Forward P/E | EV/Revenue | EV/EBITDA | Price/Sales (TTM) | Price/Book (mrq) | Market Cap (USD Mil) | Enterprise Value (USD Mil) | Beta (5Y Monthly) | FCF Yield % (TTM) | Forward EPS | Analyst Target Price – Low | Analyst Target Price – Mean | Analyst Target Price – High | # Analyst Opinions |
|---|---|---|---|---|---|---|---|---|---|---|---|---|---|---|---|
| APP | 25.8 | 15.8 | 22.3 | 28.2 | 18.3 | 47.8 | 112,765 | 137,537 | 2.53 | 2.8% | 21.3 | 406 | 656.2 | 860 | 30 |
| GOOG | 17.9 | 24.2 | 10.1 | 25.9 | 9.8 | 7 | 4,361,439 | 4,486,870 | 1.24 | 0.5% | 14.7 | 340 | 421.8 | 475 | 14 |
| MSFT | 27.9 | 21.3 | 11.2 | 19.1 | 11.2 | 8.4 | 3,711,733 | 3,711,545 | 1.10 | 0.4% | 23.5 | 400 | 562.7 | 870 | 53 |
| AAPL | 35.9 | 32.8 | 9.7 | 27 | 9.8 | 42.4 | 4,559,368 | 4,537,092 | 1.09 | 2.4% | 9.5 | 215 | 324 | 400 | 41 |
| WIX | — | 8.6 | 1.8 | -26.1 | 1.2 | -24.9 | 2,548 | 3,852 | 0.94 | 17.4% | 7 | 45 | 72.2 | 135 | 20 |
Source: Yahoo Finance
AppLovin trades at 22.3x EV/Revenue, 25.8x trailing P/E, and 15.8x forward P/E, versus GOOG at 10.1x, 17.9x, and 24.2x, MSFT at 11.2x, 27.9x, and 21.3x, AAPL at 9.7x, 35.9x, and 32.8x, and WIX at 1.8x, no trailing P/E, and 8.6x. On a growth-adjusted basis, APP is not cheap, but it is also not being priced like a low-growth software name; the market is paying for a much faster revenue line and much higher margins. Using the peer EV/Revenue range against APP’s $6.2B TTM revenue gives a very wide implied enterprise value band, which is exactly what I would expect when a company’s growth and profitability sit well above most of the group.
Profitability
| Company | Operating Margin (TTM) | Net Margin (TTM) | Return on Assets (TTM) | Return on Equity (TTM) | Gross Margin (TTM) | EBITDA Margin (TTM) |
|---|---|---|---|---|---|---|
| APP | 78.2% | 64.3% | 44.2% | 266.4% | 88.4% | 79.0% |
| GOOG | 34.0% | 54.8% | 13.0% | 48.7% | 60.9% | 38.8% |
| MSFT | 45.1% | 40.3% | 14.1% | 34.0% | 67.9% | 58.5% |
| AAPL | 32.6% | 27.6% | 27.1% | 148.8% | 48.6% | 36.0% |
| WIX | -5.6% | -8.2% | -5.8% | — | 66.6% | -6.9% |
Source: Yahoo Finance
AppLovin’s gross margin of 88.4%, EBITDA margin of 79.0%, operating margin of 78.2%, and net margin of 64.3% all exceed GOOG, MSFT, AAPL, and WIX. The gap is especially striking versus GOOG’s 60.9% gross margin and 38.8% EBITDA margin, and versus MSFT’s 67.9% and 58.5%, because AppLovin is converting revenue into profit at a much higher rate. That is the main reason the premium multiple is defensible.
Leverage
| Company | Total Debt/Equity % (mrq) | Current Ratio (mrq) | Total Debt (mrq, USD Mil) | Operating Cash Flow TTM (USD Mil) | Free Cash Flow TTM (USD Mil) | Net Debt/EBITDA (TTM) | FCF Margin % (TTM) |
|---|---|---|---|---|---|---|---|
| APP | 162.9 | 3.2 | 3,849.8 | 4,439.3 | 3,180.1 | 0.2 | 51.6% |
| GOOG | 18.9 | 2.7 | 120,791 | 185,675 | 22,665 | -0.7 | 5.1% |
| MSFT | 29.1 | 1.2 | 128,813 | 182,935 | 16,363.5 | 0.3 | 4.9% |
| AAPL | 78.4 | 1 | 84,344 | 146,724 | 107,721.9 | 0.1 | 23.1% |
| WIX | — | 0.6 | 2,038.7 | 421.1 | 442.4 | -7.3 | 20.7% |
Source: Yahoo Finance
AppLovin’s net debt/EBITDA was 0.2x and FCF margin was 51.6%, which is far cleaner than GOOG’s -0.7x and 5.1%, MSFT’s 0.3x and 4.9%, AAPL’s 0.1x and 23.1%, and WIX’s -7.3x and 20.7%. The raw debt-to-equity figure is higher than the peers, but the cash conversion is much stronger, so the balance sheet is a source of flexibility rather than stress. That matters in the peer set because the market is not paying AppLovin for safety; it is paying for growth and cash generation together.
Conclusion
I would put my rating as a Hold because the key tension is still unresolved: AppLovin’s margins and cash flow are strong enough to justify a premium, but the stock already prices in a lot of that strength. The business is generating 79.0% EBITDA margin and 51.6% FCF margin, so the numbers are not showing stress today, and that is why I do not see the bear case in the current results. What I am watching is whether the post-Apps platform can keep quarterly revenue growth above 22.1% while holding EBITDA near $1.5B; if it can, the current multiple is easier to defend.
I would raise my rating more towards a Buy if that growth rate persists and operating margin stays above 75.0%, meaning the company is still converting scale into profit at a very high rate. I would move from Hold to Sell if revenue growth slips into the mid-teens for two straight quarters or if platform privacy changes push EBITDA margin down by 300 bps, because that would tell me the moat is being eroded faster than the valuation can absorb. Net debt moving materially above 0.2x EBITDA would be another warning sign, since the current balance sheet only supports the equity if cash conversion stays this strong.
Weighing both sides, I think the bull case is more likely to show up first, but the stock already reflects a lot of that outcome. My stance is still Hold: the business quality is high, yet I want another clean quarter or two before paying up more aggressively.
What’s your take? I rated AppLovin (APP) HOLD above — but the goal here is to get this right, not just to publish an opinion. What would you add to this analysis, or which risk or catalyst do you think I’m under- or over-weighting? Tell me in the comments.
Sources
- SEC 10-K Annual Report — filed 2026-02-19
- SEC 8-K Filing (2026-06-05)
- SEC 8-K Filing (2026-05-06)
- SEC 8-K Filing (2026-04-07)
- SEC 8-K Filing (2026-02-11)
- SEC Form 4 Insider Transaction (2026-06-08)
- SEC Form 4 Insider Transaction (2026-06-05)
- SEC Form 4 Insider Transaction (2026-06-05)
- SEC 10-K Annual Report — FY2026
- SEC 10-K Annual Report — FY2025
- SEC 10-K Annual Report — FY2024
- SEC 10-K Annual Report — FY2023
- SEC 10-K Annual Report — FY2022
Data sourced from Yahoo Finance and SEC EDGAR. Not investment advice.
Leave a Comment