| Company | Sep 25 | Oct 25 | Nov 25 | Dec 25 | Jan 26 | Feb 26 | Mar 26 | Apr 26 | May 26 | Jun 26 | Jul 26 | Aug 26 | 12-Mo |
|---|---|---|---|---|---|---|---|---|---|---|---|---|---|
| ACHR | +7% | +17% | -31% | -3% | -4% | -1% | -27% | +11% | +19% | -31% | -2% | +25% | -35% |
| JOBY | +14% | +7% | -17% | -9% | -20% | -5% | -18% | +11% | +29% | -25% | -20% | -4% | -52% |
| KTOS | +39% | -1% | -16% | -0% | +36% | -16% | -18% | -11% | +2% | -22% | -7% | +9% | -23% |
| AVAV | +30% | +17% | -24% | -13% | +15% | -9% | -27% | +7% | +6% | -20% | -10% | -1% | -39% |
| RKLB | -1% | +31% | -33% | +66% | +15% | -14% | -7% | +28% | +74% | -29% | -36% | -2% | +32% |
| PLUG | +48% | +15% | -25% | -2% | +8% | -16% | +26% | +38% | +26% | -31% | -24% | +5% | +38% |
Source: Yahoo Finance monthly adjusted close.
Quick Thesis
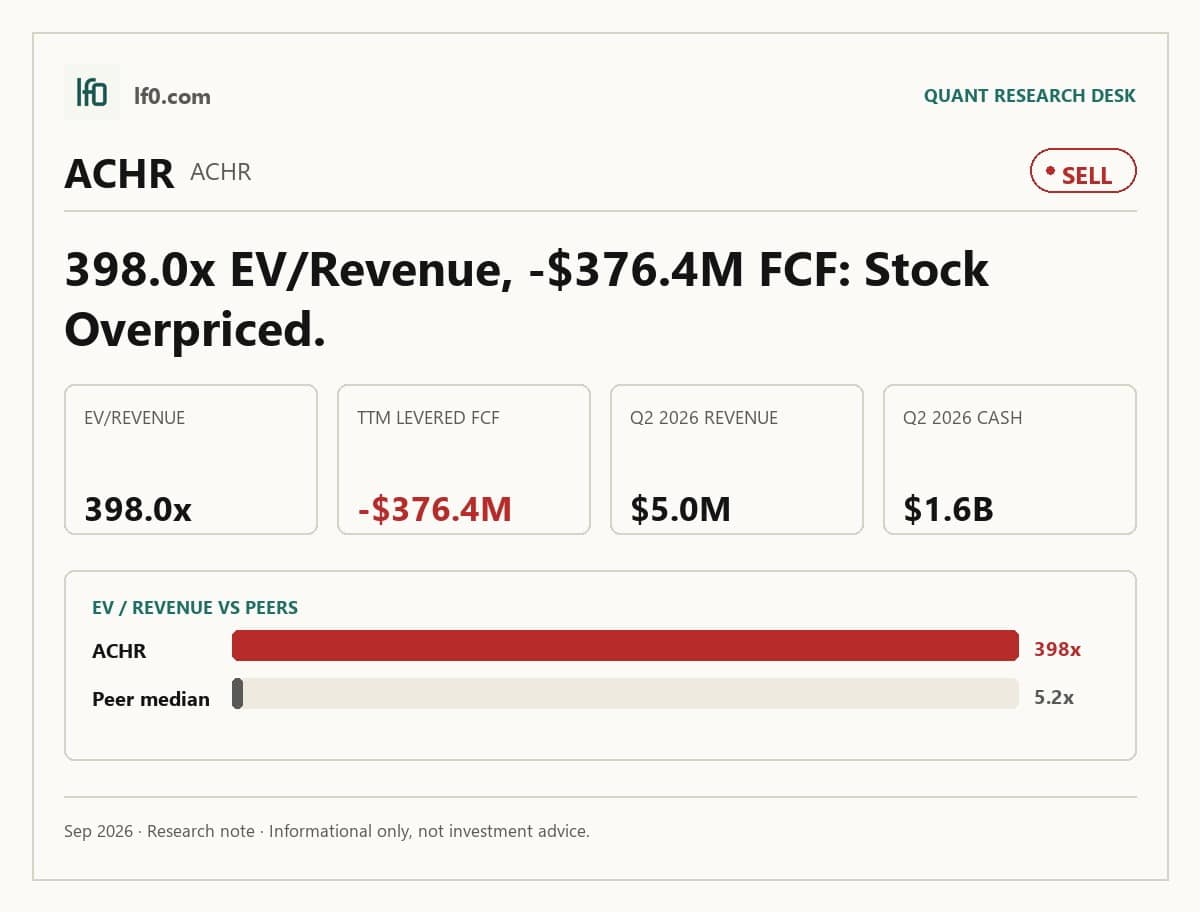
- Rated sell — valuation assumes commercialization far ahead of reported revenue.
- Strongest support is $1.6B of cash and a 10.2x current ratio.
- Biggest risk is $540.4M of TTM operating cash outflow.
- Shares trade at 398.0x EV/revenue and 589.8x price/sales.
- I would turn more constructive only if revenue stays above $5M a quarter and cash burn narrows.
Executive Summary
Rating: SELL | ACHR
Measured from adjusted close on 2026-09-18 to 2026-09-18. Sell ratings are correct when the stock falls; Hold is tracked as a +/-10% range. Daily-close data, not intraday. Calls are tracked for 182 days from publication, then frozen as a final record.
I would put my rating as a Sell because Archer is still priced for a commercialization step-up that has not yet shown up in the financials. Revenue reached $5M in Q2 2026, but the stock still trades at 398.0x EV/revenue and 589.8x price/sales, so investors are paying for a future route network rather than current earnings power. The balance sheet gives the company time, not proof: cash was $1.6B and current ratio was 10.2x, yet levered free cash flow was $376.4M TTM and operating cash flow was $540.4M TTM. I would raise my rating toward Hold if Archer can keep revenue above $5M a quarter for several quarters and narrow cash burn enough to show that commercialization is becoming repeatable.
Company Profile
Archer Aviation develops electric vertical take-off and landing aircraft, software, and services for commercial air taxi and defense use. Its lead aircraft, Midnight, is a four-passenger, pilot-operated platform designed for short urban trips of about 20 miles, while a hybrid-electric defense aircraft is being co-developed with Anduril Industries. The company was founded in 2018 and went public through a SPAC merger in 2021. It operates in the United States, the UAE, Europe, the Middle East, Africa, and Asia-Pacific, with production and test activity centered in California and Georgia and Hawthorne Municipal Airport serving as an operating hub.
Economic Moat
Business Model
The clearest structural advantage I see is Archer’s regulatory progress on Midnight, because that is harder for a rival to duplicate quickly than the aircraft design itself. Midnight’s Means of Compliance was fully FAA accepted in January 2026, piloted test flights began in June 2025, and Archer already holds a Part 135 Air Carrier and Operator Certificate, a Part 145 Repair Station Certificate, and a Part 141 Certificate. In my view, that combination matters more than the concept of eVTOL alone because it moves the company from an idea to a regulated operating platform. The proprietary 12-tilt-6 distributed electric propulsion system, in-house flight control software, and “golden manufacturing lines” in California and Georgia add depth to the moat, and the Hawthorne airport acquisition gives Archer a physical operating base that should be difficult to replicate at speed.
Business & Operating Risks
The main disclosed risk is still certification and commercialization failure. Archer says its eVTOL aircraft remains in development, there are currently no FAA-certified eVTOL aircraft for commercial operations in the United States, and it may not obtain the FAA, DOT, or foreign approvals needed for type certification, production certification, or operations. That risk is not abstract, because the $1B United Purchase Agreement only becomes payable after FAA certification and agreement on material terms, while the USAF contracts also depend on an FAA Airworthiness Certificate, flight tests, and delivery milestones. The filing also highlights supplier dependence, manufacturing inexperience, and financing risk, all of which can delay revenue and increase dilution. In my view, these risks do threaten the moat because the regulatory edge is only valuable if Archer can convert it into certified production and service on time.
Management Discussion & Analysis
Management is responding to those risks by building liquidity and infrastructure, but it has not yet shown that the plan is self-funding. Archer ended 2025 with $1,964.7M of cash, cash equivalents, and short-term investments, and it also raised large amounts of equity to fund development, manufacturing, and airport buildout. The Hawthorne acquisition and the Covington, Georgia facility show a deliberate push to control the operating footprint, while the financing mix tells me the company is still relying on capital markets rather than operating cash flow. That is a rational response to the disclosed risks, but it also confirms that the commercialization gap remains open.
Recent Events
The most important recent event is the March 9, 2026 litigation escalation against Joby, where Archer filed a counterclaim for unfair competition and false advertising and a U.S. International Trade Commission complaint tied to patent claims. I view that as a possible competitive offset if the claims gain traction, because it could slow a rival’s commercialization path. The other notable pattern is repeated equity issuance, including resale filings in March and May 2026, which keeps dilution front and center. A March 19, 2026 transition of Tosha Perkins from chief administrative officer to senior advisor looks more like a personnel adjustment than a strategic reset, so the moat thesis is still being driven more by certification and manufacturing progress than by management turnover.
Financial Analysis
Growth
ACHR — Financial Growth (Quarterly, USD Mil)
| Metric | 2025-03-31 | 2025-06-30 | 2025-09-30 | 2025-12-31 | 2026-03-31 | 2026-06-30 |
|---|---|---|---|---|---|---|
| REVENUE (USD Mil) | — | 0 | 0 | 0.3 | 1.6 | 5 |
| EBIT (USD Mil) | — | -176.1 | -174.8 | -234.4 | -254.6 | -279.2 |
| EBITDA (USD Mil) | — | -171.3 | -169.7 | -228.4 | -246.8 | -269.1 |
| NET INCOME (USD Mil) | — | -206 | -129.9 | -188.9 | -217.7 | -263.2 |
| DILUTED EPS | -0.2 | -0.4 | -0.2 | — | -0.3 | -0.3 |
Source: Yahoo Finance — Quarterly Financial Statements
Revenue is still tiny, but the direction is improving: Archer posted $0M in Q2 2025, $0M in Q3 2025, $0.3M in Q4 2025, $1.6M in Q1 2026, and $5M in Q2 2026. That is real commercialization progress, not just noise, and it is consistent with the company’s move from aircraft validation toward early delivery activity. EBITDA moved from $171M in Q2 2025 to $269M in Q2 2026, so revenue is scaling faster than losses are widening, but the business is still far from operating leverage. The key point is that the growth trajectory is finally visible, yet it is still too small to support the current valuation.
Profitability
ACHR — Profitability (TTM)
| Metric | TTM |
|---|---|
| Operating Margin (TTM) | -5,514.0% |
| Net Margin (TTM) | 0.0% |
| Return on Assets (TTM) | -28.1% |
| Return on Equity (TTM) | -44.5% |
| Gross Margin (TTM) | 14.5% |
| EBITDA Margin (TTM) | -13,127.5% |
Source: Yahoo Finance — Trailing Twelve Months (TTM)
TTM gross margin of 14.5% shows Archer is capturing some value before overhead, but operating margin of -5,514.0% and EBITDA margin of -13,127.5% show the company is still absorbing heavy development and launch costs. Net margin is 0.0% in the table, which I would not read as a sign of profitability because the company is still posting large net losses in the quarterly data. Return on assets of -28.1% and return on equity of -44.5% confirm that capital is being consumed rather than compounded. The gap between gross margin and the deeply negative operating metrics tells me the core product economics are not the issue; scale is.
Valuation
ACHR — Valuation Multiples
| Metric | Value |
|---|---|
| Current Share Price (USD) | 5.3 |
| Market Cap (USD Mil) | 4,070 |
| Enterprise Value (USD Mil) | 2,746 |
| Trailing P/E | — |
| Forward P/E | -6.5 |
| Price/Sales (TTM) | 589.8 |
| Price/Book (mrq) | 2.2 |
| EV/Revenue | 398 |
| EV/EBITDA | -3 |
| Beta (5Y Monthly) | 3.23 |
| FCF Yield % (TTM) | -9.2% |
| Forward EPS (USD) | -0.8 |
| Analyst Target Price – Low (USD) | 4.5 |
| Analyst Target Price – Mean (USD) | 10.6 |
| Analyst Target Price – High (USD) | 18 |
| # Analyst Opinions | 9 |
Source: Yahoo Finance
Archer trades on a revenue multiple because earnings are still deeply negative. EV/revenue is 398.0x and price/sales is 589.8x at a current share price of $5.28, which tells me the market is paying for a commercial aviation platform that has not yet produced meaningful revenue. Forward P/E is -6.6x and EV/EBITDA is -3.0x, so earnings-based multiples do not offer a cheapness case here. FCF yield is -9.3%, and levered free cash flow was $376.4M TTM, so the equity is still funding a large cash burn rather than harvesting cash. On the analysis here, I would put fair value in a range of roughly $3.2–$3.6 per share on a peer EV/revenue framework, which sits below the $5.28 current price and below the $10.61 analyst mean target. That gap is important because it shows the market is already discounting a much larger future revenue base than the company has yet earned. Forward EPS is $0.8, which is still weaker than JOBY’s $0.6 and far below the positive EPS profile of the profitable peers, so the stock is expensive on both a cash-flow and earnings basis.
Leverage
ACHR — Leverage & Coverage (Quarterly)
| Metric | Value |
|---|---|
| Total Debt/Equity % (mrq) | 6.6 |
| Current Ratio (mrq) | 10.2 |
| Total Debt (mrq, USD Mil) | 125.6 |
| Operating Cash Flow (TTM, USD Mil) | -540.4 |
| Levered Free Cash Flow (TTM, USD Mil) | -376.4 |
| Net Debt/EBITDA (TTM) | 1.6 |
| FCF Margin % (TTM) | -5,455.6% |
Source: Yahoo Finance — Quarterly Financial Statements
Archer has $125.6M of total debt and a 6.6% debt-to-equity ratio, while the current ratio is 10.2x and total cash is $1.6B. That liquidity cushion gives it room to fund development, but the cash flow profile is still weak: operating cash flow was $540.4M TTM and levered free cash flow was $376.4M TTM, so the business is consuming cash rather than converting it. Net debt/EBITDA is 1.6x, but EBITDA is negative, so I treat that as a rough balance-sheet indicator rather than a clean leverage signal. The important read is that Archer is liquid today, yet its runway still depends on continued funding or a faster commercialization ramp.
Insider Activity
The insider record is one-sided: 35 open-market sales and 0 open-market purchases from 2024-12-31 to 2026-05-18. Sales came from the CTO, Chief Legal & Strategy, Interim CFO, Chief Accounting Officer, and Chief Administrative Officer, which suggests weak alignment with outside shareholders. I do not overread any single sale, but the breadth of selling is a bear signal when paired with the company’s continuing cash burn.
Comparable Analysis
Growth
| Company | Revenue TTM (USD Mil) | Revenue Growth YoY % | EBITDA TTM (USD Mil) | Diluted EPS TTM |
|---|---|---|---|---|
| ACHR | 6.9 | — | -905.8 | -1.1 |
| JOBY | 116.3 | 257,493.3% | -838.8 | -1 |
| KTOS | 1,522.5 | 30.5% | 87 | 0.2 |
| AVAV | 2,002.7 | 5.7% | 218.8 | -4.1 |
| RKLB | 769.1 | 62.0% | -150.5 | -0.3 |
| PLUG | 744.1 | 2.5% | -512.1 | -1.3 |
Source: Yahoo Finance
Archer’s revenue was only $6.9M TTM, which is far below JOBY at $116.3M, RKLB at $769.1M, PLUG at $744.1M, AVAV at $2B, and KTOS at $1.5B. That makes Archer the earliest-stage name in the peer set, so any growth premium has to come from future scale rather than current size. JOBY’s 257,493.3% revenue growth is not a useful benchmark for Archer’s base, but it does show how much execution the market is already willing to price into this segment.
Valuation
| Company | Current Share Price (USD) | Trailing P/E | Forward P/E | EV/Revenue | EV/EBITDA | Price/Sales (TTM) | Price/Book (mrq) | Market Cap (USD Mil) | Enterprise Value (USD Mil) | Beta (5Y Monthly) | FCF Yield % (TTM) | Forward EPS | Analyst Target Price – Low | Analyst Target Price – Mean | Analyst Target Price – High | # Analyst Opinions |
|---|---|---|---|---|---|---|---|---|---|---|---|---|---|---|---|---|
| ACHR | 5.3 | — | -6.5 | 398 | -3 | 589.8 | 2.2 | 4,070 | 2,746 | 3.23 | -9.2% | -0.8 | 4.5 | 10.6 | 18 | 9 |
| JOBY | 6.1 | — | -9.4 | 39.6 | -5.5 | 51.7 | 3.4 | 6,018 | 4,607 | 2.68 | -7.2% | -0.6 | 6 | 10.7 | 18 | 9 |
| KTOS | 47.3 | 278.5 | 43 | 5.1 | 88.5 | 5.8 | 2.6 | 8,888 | 7,703 | 1.11 | -1.3% | 1.1 | 60 | 102.8 | 150 | 21 |
| AVAV | 161 | — | 36 | 4.3 | 39 | 4.1 | 1.9 | 8,183 | 8,543 | 1.41 | -0.3% | 4.5 | 148.6 | 219.3 | 315 | 19 |
| RKLB | 64.4 | — | 1,412.6 | 49.9 | -255.2 | 53.5 | 11 | 41,152 | 38,412 | 2.61 | -0.6% | 0 | 64 | 109.4 | 150 | 19 |
| PLUG | 2 | — | -13.8 | 5.2 | -7.5 | 3.8 | 4.9 | 2,857 | 3,832 | 2.22 | -8.6% | -0.1 | 0.8 | 3.6 | 7 | 16 |
Source: Yahoo Finance
Archer’s 398.0x EV/revenue and 589.8x price/sales are far above JOBY at 39.6x and 51.7x, RKLB at 49.9x and 53.5x, AVAV at 4.3x and 4.1x, KTOS at 5.1x and 5.8x, and PLUG at 5.2x and 3.8x. FCF yield is -9.3%, worse than JOBY’s -7.2% and PLUG’s -8.6%, so the stock is not being supported by cash generation. On a peer-multiple basis, the implied enterprise value range is well below the current share price, which tells me the market is already paying for a much larger future revenue base. The valuation premium is even harder to justify because Archer’s leverage is low but its profitability is still deeply negative, so the multiple is not being earned by balance-sheet safety or earnings power.
Profitability
| Company | Operating Margin (TTM) | Net Margin (TTM) | Return on Assets (TTM) | Return on Equity (TTM) | Gross Margin (TTM) | EBITDA Margin (TTM) |
|---|---|---|---|---|---|---|
| ACHR | -5,514.0% | 0.0% | -28.1% | -44.5% | 14.5% | -13,127.5% |
| JOBY | -675.2% | 0.0% | -27.5% | -65.9% | 34.3% | -721.2% |
| KTOS | -0.2% | 2.0% | 0.4% | 1.1% | 23.0% | 5.7% |
| AVAV | -2.3% | -10.1% | -0.1% | -4.6% | 26.5% | 10.9% |
| RKLB | -24.6% | -21.5% | -4.6% | -7.9% | 37.3% | -19.6% |
| PLUG | -24.9% | -220.6% | -12.2% | -145.0% | -24.8% | -68.8% |
Source: Yahoo Finance
Archer’s gross margin is 14.5%, below JOBY’s 34.3%, RKLB’s 37.3%, AVAV’s 26.5%, and KTOS’s 23.0%. Its EBITDA margin is -13,127.5% and operating margin is -5,514.0%, far worse than JOBY’s -721.2% and RKLB’s -19.6%. That combination points to both cost-of-revenue pressure and scale inefficiency, not just development-stage losses. Archer is not yet showing the gross-margin profile that usually precedes operating leverage.
Leverage
| Company | Total Debt/Equity % (mrq) | Current Ratio (mrq) | Total Debt (mrq, USD Mil) | Operating Cash Flow TTM (USD Mil) | Free Cash Flow TTM (USD Mil) | Net Debt/EBITDA (TTM) | FCF Margin % (TTM) |
|---|---|---|---|---|---|---|---|
| ACHR | 6.6 | 10.2 | 125.6 | -540.4 | -376.4 | 1.6 | -5,455.6% |
| JOBY | 42.3 | 18 | 747.7 | -609.9 | -436.4 | 1.8 | -375.3% |
| KTOS | 5.7 | 5.5 | 193.6 | -39.6 | -118.3 | -14.3 | -7.8% |
| AVAV | 19.4 | 4.3 | 850.8 | 58.8 | -25.9 | 1.2 | -1.3% |
| RKLB | 3.8 | 5.5 | 133.7 | -222.5 | -252 | 14.4 | -32.8% |
| PLUG | 176.6 | 2.3 | 1,037 | -482.6 | -247.1 | -1.7 | -33.2% |
Source: Yahoo Finance
Archer’s debt-to-equity ratio of 6.6% is low versus JOBY at 42.3%, AVAV at 19.4%, and PLUG at 176.6%, and its current ratio of 10.2x is strong. The company also has $1.6B of cash, or $2.03 per share, which gives it more liquidity than most of the peer set. Net debt/EBITDA of 1.6x is not a meaningful stress signal here because EBITDA is negative, so the cleaner conclusion is that Archer is cash-rich and lightly levered, but not yet self-funding. That balance-sheet strength matters, yet it does not offset the valuation gap because the market is still paying for execution that has not arrived.
Conclusion
The tension in this case is simple: Archer has made real regulatory and early commercialization progress, but the financials still look like a company that is paying to get to scale rather than one that has reached it. Revenue did reach $5M in Q2 2026, and that is enough to show the business is no longer purely conceptual, but the stock still trades at 398.0x EV/revenue while levered free cash flow remains $376.4M TTM. I would keep a Sell rating because the valuation already discounts a much larger future business than the current numbers justify.
I would move toward Hold if Archer can keep quarterly revenue above $5M for several quarters and show operating cash burn narrowing from the current $540.4M TTM pace. That would matter because it would show the launch phase is becoming repeatable and would reduce the odds of another dilutive financing before commercial operations are visible. I would move from Sell to Strong Sell if revenue falls back below $1M a quarter or if operating cash outflow widens beyond the current TTM level, because that would tell me the Q2 2026 step-up was not the start of a durable ramp. A further delay in FAA certification milestones would also push me lower, since the aircraft purchase agreement still depends on certification before it can turn into cash.
Weighing both sides, I think the bear case is more likely to show up first because the company still has to prove manufacturing, certification, and monetization at the same time. The cash balance buys time, but it does not change the fact that the stock is already discounting a future the income statement has not yet earned.
What to Watch Next
- Quarterly revenue above $5M — would support a move toward Hold.
- Operating cash outflow narrowing from $540.4M TTM — would show commercialization is becoming less cash-intensive.
- FAA certification milestones — delays would support a lower rating.
- Levered free cash flow improving from $376.4M TTM — would reduce dilution risk.
- Another large equity raise — would reinforce the bear case if cash burn stays elevated.
What’s your take? I rated Archer Aviation (ACHR) SELL above — but the goal here is to get this right, not just to publish an opinion. What would you add to this analysis, or which risk or catalyst do you think I’m under- or over-weighting? Tell me in the comments.
Sources
- SEC 10-K Annual Report — filed 2026-03-02
- SEC 8-K Filing (2026-05-14)
- SEC 8-K Filing (2026-05-11)
- SEC 8-K Filing (2026-03-19)
- SEC 8-K Filing (2026-03-12)
- SEC 8-K Filing (2026-03-05)
- SEC 8-K Filing (2026-03-02)
- SEC Form 4 Insider Transaction (2026-05-19)
- SEC Form 4 Insider Transaction (2026-05-19)
- SEC Form 4 Insider Transaction (2026-05-19)
- SEC 10-K Annual Report — FY2026
- SEC 10-K Annual Report — FY2025
- SEC 10-K Annual Report — FY2024
- SEC 10-K Annual Report — FY2023
- SEC 10-K Annual Report — FY2022
Data sourced from Yahoo Finance and SEC EDGAR. Not investment advice.
Leave a Comment