| Company | Aug 25 | Sep 25 | Oct 25 | Nov 25 | Dec 25 | Jan 26 | Feb 26 | Mar 26 | Apr 26 | May 26 | Jun 26 | Jul 26 | 12-Mo |
|---|---|---|---|---|---|---|---|---|---|---|---|---|---|
| SDGR | -4% | +3% | +5% | -17% | +2% | -22% | -14% | -6% | +5% | +27% | +7% | -7% | -26% |
| SLP | +9% | +6% | +14% | -1% | +7% | -7% | -28% | -3% | +20% | +21% | +7% | -0% | +40% |
| CERT | +10% | +13% | -5% | -21% | -4% | -0% | -19% | -19% | +8% | -5% | +13% | +24% | -18% |
| CRL | -4% | -4% | +15% | -1% | +12% | +6% | -15% | -3% | -3% | +8% | +25% | +3% | +37% |
| ABCL | -6% | +20% | +10% | -33% | -8% | +6% | -0% | -3% | +19% | +49% | +27% | -27% | +28% |
| RXRX | -21% | +4% | +13% | -16% | -12% | +2% | -12% | -16% | +13% | +4% | +2% | -18% | -50% |
Source: Yahoo Finance monthly adjusted close.
Quick Thesis
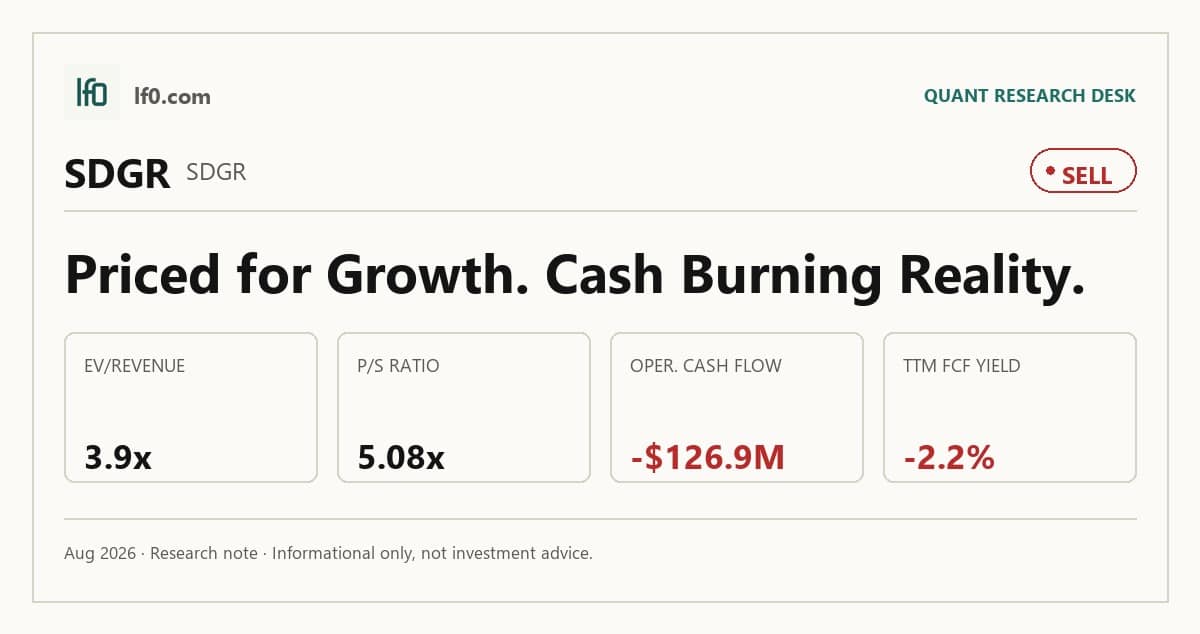
- Rated sell — valuation still prices in growth that cash flow has not earned.
- Strongest point: the platform’s gross margin is 56.9% TTM.
- Biggest risk: operating cash flow is -$126.9M TTM.
- Valuation is rich at 3.9x EV/Revenue and 5.1x P/S.
- I would only improve the rating if free cash flow turns positive and revenue growth re-accelerates.
Executive Summary
Rating: SELL | SDGR
Measured from adjusted close on 2026-08-17 to 2026-09-30. Sell ratings are correct when the stock falls; Hold is tracked as a +/-10% range. Daily-close data, not intraday. Calls are tracked for 182 days from publication, then frozen as a final record.
I would put my rating as a sell because Schrödinger’s platform quality is real, but the stock still trades as if cash burn and uneven monetization are temporary. The company has a defensible physics-based software engine and a broad pharma customer base, yet TTM operating cash flow of -$126.9M and levered free cash flow of -$29.2M show that the business is still funding itself with balance-sheet capacity rather than internal cash generation. In my view, that is the key tension: the moat is credible, but the financial conversion is not. I would move toward a buy only if revenue growth re-accelerates above the 7.5% TTM pace and free cash flow turns positive, which would show the platform is scaling faster than the cost base.
Company Profile
Schrödinger develops and licenses physics-based computational software for molecule discovery and optimization, and it also uses the same platform to run collaborative and proprietary drug discovery programs. In 2025, software revenue was $199.5M and drug discovery revenue was $56.4M, so the company remains a hybrid model with software still the larger engine. Founded in 1990, it went public in February 2020 and trades on Nasdaq under SDGR. Its software is used by all of the top 20 pharmaceutical companies by 2024 revenue, and its direct sales footprint spans the U.S., Europe, Japan, India, and South Korea, with distributors in China. As of February 3, 2026, it had 850 full-time employees and 363 Ph.D. holders.
Economic Moat
Business Model
The core moat is the physics-based computational platform, which I feel is hard to replicate quickly because it was built over several decades by hundreds of scientists and engineers and can evaluate billions of molecules per day. Traditional methods synthesize and test only about 1,000 molecules per year, so the gap is not incremental software performance but a different discovery workflow altogether. That matters because the platform is already embedded with the top 20 pharmaceutical companies, which in 2025 licensed the software and accounted for $737M, or 37.0%, of software revenue. I also see secondary protection in the Columbia University licenses for core programs such as Glide, Prime, and WaterMap, plus a patent portfolio of about 40 patents and applications as of January 20, 2026. The moat is therefore both technical and commercial, and the commercial layer is what makes the technical layer monetizable.
The business has also become more durable than it looked a few years ago. Earlier filings described a software platform and a multidisciplinary drug discovery team, but the current model is broader: the company now has 20 active collaborative drug discovery programs and 20 collaborators as of December 31, 2025. That shift matters because it gives the platform a second proof point beyond software licensing, even if the proprietary drug side still carries clinical and funding risk. In my view, the hybrid model is stronger than the 2022 version because the software franchise is more deeply embedded and the collaboration base is larger.
Business & Operating Risks
The biggest disclosed risk is that Schrödinger still has no approved drug product and expects to keep losing money for several years, so the equity remains dependent on software growth, collaboration milestones, and outside capital rather than drug sales. Net losses were $103.3M in FY2025 and $187.1M in FY2024, with an accumulated deficit of $628.8M at December 31, 2025. That is more than an accounting issue: it means the company has not yet shown me a self-funding model.
Software renewal and pricing risk is the next issue. Most software revenue comes from one-year licenses and subscriptions, and contracts may be terminated or reduced in scope immediately or upon notice. That matters because the customer base is broad but still exposed to renewal timing, especially in a market where direct competitors include BIOVIA, Chemical Computing Group, Cresset, Cadence, Optibrium, Cyrus Biotechnology, Molsoft, Insilico Medicine, Iktos, XtalPi, AbCellera, Inductive Bio, Chemaxon, Revvity, and Simulations Plus. The moat is not broken, but the disclosed renewal risk does mean the commercial edge has to be renewed every year.
The collaboration model carries a separate binary risk. None of the current drug discovery collaborators has completed clinical development of a product candidate, so milestone and royalty income remain uncertain. The company also disclosed upfront payments from Novartis and Bristol Myers Squibb, which shows how dependent the model is on a small number of large counterparties and on milestone timing. I do not think these risks threaten the physics engine itself, but they do threaten the commercial conversion of that engine into steady cash flow.
Management Discussion & Analysis
Management is clearly responding to the risks by shifting away from capital-intensive internal drug development and toward partnerships. Beyond the ongoing Phase 1 trials of SGR-1505 and SGR-3515, the company does not intend to initiate additional clinical trials or advance other proprietary preclinical programs independently. That is a meaningful capital-allocation change, and it should reduce R&D intensity over time. The May 2025 restructuring is expected to produce about $70M of total savings, but the latest cash flow figures show the business is still not self-funding, so the savings are a step toward discipline rather than proof of a turnaround.
The software transition is the harder part of the story. Management is pushing customers from on-premise licenses to hosted subscriptions and expects revenue to decline in the near term as that mix shift progresses, yet 2025 total revenue still rose 23.0% to $255.9M. That tells me the transition is real, but the timing is messy and the near-term revenue path is less linear than management’s narrative suggests. The company also launched a predictive toxicology initiative funded initially by $19.5M from the Bill & Melinda Gates Foundation, which broadens the platform, but it has not yet offset the lower on-premise recognition or the weaker net dollar retention of 100% in 2025 versus 113% in 2024. In my view, management is addressing the disclosed risks, but the operating data has not yet proven that the response is enough.
Recent Events
The most important recent development is the leadership reset in software sales. On May 18, 2026, Mannix Aklian exited as chief commercial officer, global head of software sales and marketing, and the company brought back Paul Davie as interim chief commercial officer while it searches for a permanent replacement. I read that as a test of commercial execution, because the software franchise depends on renewal discipline and customer expansion.
The March 2026 accounting transition was more orderly. Therese Abrams was named principal accounting officer, while Jenny Herman stepped out of the chief accounting officer and principal accounting officer role and stayed on briefly to smooth the handoff. That looks like control continuity rather than a thesis change. The February and May 2026 earnings filings were routine, and the May 18 filing reaffirmed full-year and Q2 2026 guidance. Taken together, the recent events slightly weaken the moat thesis because of the commercial turnover, but they do not suggest structural damage to the platform.
Financial Analysis
Growth
SDGR — Financial Growth (Quarterly, USD Mil)
| Metric | 2025-03-31 | 2025-06-30 | 2025-09-30 | 2025-12-31 | 2026-03-31 | 2026-06-30 |
|---|---|---|---|---|---|---|
| REVENUE (USD Mil) | — | 54.8 | 54.3 | 87.2 | 58.6 | 58.9 |
| NET INCOME (USD Mil) | — | -43.2 | -32.8 | 32.5 | -60 | 6 |
| DILUTED EPS | -0.8 | -0.6 | -0.5 | — | -0.8 | 0.1 |
Source: Yahoo Finance — Quarterly Financial Statements
Revenue was $58.9M in Q2 2026 versus $54.3M in Q3 2025, up 8.4% year over year, after a stronger $87.2M in Q4 2025 that looks more like a one-quarter spike than a new run rate. Q2 2026 revenue was only slightly above $58.6M in Q1 2026, so the top line has flattened after that jump. EBITDA was -$40.1M in Q2 2026 versus -$44.5M in Q3 2025, and net income was $6.0M in Q2 2026 versus -$32.8M in Q3 2025, so profitability is improving but remains volatile. I do not see a clean explanation for the Q4 2025 surge in the figures here, which is worth flagging because the revenue pattern is not yet stable enough to underwrite a higher multiple.
Profitability
SDGR — Profitability (TTM)
| Metric | TTM |
|---|---|
| Operating Margin (TTM) | -70.6% |
| Net Margin (TTM) | -21.0% |
| Return on Assets (TTM) | -14.4% |
| Return on Equity (TTM) | -16.2% |
| Gross Margin (TTM) | 56.9% |
| EBITDA Margin (TTM) | -57.0% |
Source: Yahoo Finance — Trailing Twelve Months (TTM)
TTM gross margin was 56.9%, but TTM operating margin was -70.6% and TTM EBITDA margin was -57.0%, so the company still converts a healthy gross profit into heavy operating losses. That gap tells me the issue is scale and operating expense absorption, not cost of revenue. TTM net margin was -21.0%, return on assets was -14.4%, and return on equity was -16.2%, which means capital is not yet earning an economic return. The gross margin is the encouraging part, because it shows the revenue layer is intact; the problem is that the platform is still too small relative to the cost structure.
Valuation
SDGR — Valuation Multiples
| Metric | Value |
|---|---|
| Market Cap (USD Mil) | 1,316 |
| Enterprise Value (USD Mil) | 1,010 |
| Forward P/E | -13 |
| Price/Sales (TTM) | 5.1 |
| Price/Book (mrq) | 4.2 |
| EV/Revenue | 3.9 |
| EV/EBITDA | -6.8 |
| Beta (5Y Monthly) | 1.66 |
| FCF Yield % (TTM) | -2.2% |
| Forward EPS (USD) | -1.4 |
| Analyst Target Price – Low (USD) | 17 |
| Analyst Target Price – Mean (USD) | 21.4 |
| Analyst Target Price – High (USD) | 30 |
| # Analyst Opinions | 7 |
Source: Yahoo Finance
The stock trades at 3.9x EV/Revenue and 5.1x price/sales on a TTM basis, which is rich for a company with negative free cash flow yield of -2.2% and forward EPS of -$1.35. Forward P/E is -13.0x, so earnings-based valuation is not yet useful as a support for the stock. Market cap is $1.3B and enterprise value is $1.0B, while beta is 1.7, which fits a high-volatility equity rather than a defensive one.
On the analysis here, I would put fair value in a range of roughly $6-$11 per share, using peer EV/Revenue as the anchor and then adjusting for Schrödinger’s weaker cash conversion and negative forward EPS. That range sits below the $17-$30 analyst target range, and the gap matters because there are 7 analyst opinions, so this is not a thin consensus. I think the market is giving more credit than I would to the company’s ability to convert revenue into cash, especially given the -11.3% FCF margin and the still-negative operating cash flow. The valuation case only improves if the company can show that the hosted transition and partnership model are producing durable margin expansion rather than just lumpy revenue.
Leverage
SDGR — Leverage & Coverage (Quarterly)
| Metric | Value |
|---|---|
| Total Debt/Equity % (mrq) | 32.8 |
| Current Ratio (mrq) | 2.7 |
| Total Debt (mrq, USD Mil) | 108 |
| Net Debt/EBITDA (TTM) | 2.1 |
| FCF Margin % (TTM) | -11.3% |
Source: Yahoo Finance — Quarterly Financial Statements
Total debt/equity was 32.8% and the current ratio was 2.7x, so the balance sheet is liquid enough for now. Total debt was $108M, operating cash flow was -$126.9M TTM, levered free cash flow was -$29.2M TTM, and net debt/EBITDA was 2.1x. In my view, that is manageable leverage but weak cash conversion. The balance sheet is not the problem today; the problem is that it is still funding operations instead of compounding them, so any delay in turning EBITDA and free cash flow positive would keep pressure on flexibility.
Insider Activity
The insider record is one-sided selling: 27 open-market sales and 0 purchases from 2025-02-10 to 2026-04-17. The CEO, CFO, and several other executives all sold shares, which does not support a strong alignment case at current prices. I would not overread any single trade, but the pattern is not constructive.
Comparable Analysis
Growth
| Company | Revenue TTM (USD Mil) | Revenue Growth YoY % | EBITDA TTM (USD Mil) | Diluted EPS TTM |
|---|---|---|---|---|
| SDGR | 259 | 7.5% | -147.6 | -0.7 |
| SLP | 82.1 | 7.5% | 15 | 0.4 |
| CERT | 421.8 | 1.0% | 94.2 | -0.1 |
| CRL | 3,999 | -2.7% | 849.1 | -4.8 |
| ABCL | 66.2 | -76.3% | -200 | -0.5 |
| RXRX | 54.9 | -60.1% | -471.6 | -1 |
Source: Yahoo Finance
Schrödinger’s 7.5% revenue growth TTM matches SLP at 7.5% and beats CERT at 1.0% and CRL at -2.7%, but it trails the kind of earnings leverage that makes growth matter. SDGR’s diluted EPS TTM was -0.7 and EBITDA TTM was -$147.6M, while SLP posted $0.4 EPS and $15M EBITDA and CERT generated $94.2M EBITDA. In other words, SDGR is growing at a respectable pace, but the growth is not yet converting into the kind of earnings power that would justify a premium on its own.
Valuation
| Company | Forward P/E | EV/Revenue | EV/EBITDA | Price/Sales (TTM) | Price/Book (mrq) | Market Cap (USD Mil) | Enterprise Value (USD Mil) | Beta (5Y Monthly) | FCF Yield % (TTM) | Forward EPS | Analyst Target Price – Low | Analyst Target Price – Mean | Analyst Target Price – High | # Analyst Opinions |
|---|---|---|---|---|---|---|---|---|---|---|---|---|---|---|
| SDGR | -13 | 3.9 | -6.8 | 5.1 | 4.2 | 1,316 | 1,010 | 1.66 | -2.2% | -1.4 | 17 | 21.4 | 30 | 7 |
| SLP | 20.8 | 3.9 | 21.4 | 4.5 | 2.7 | 371 | 322 | 1.33 | 5.0% | 0.9 | 16 | 17.2 | 18.5 | 2 |
| CERT | 20.5 | 3.2 | 14.2 | 2.9 | 1.3 | 1,220 | 1,337 | 1.41 | 5.1% | 0.4 | 7 | 8.2 | 9 | 10 |
| CRL | 22.1 | 4.1 | 19.1 | 3.4 | 4.7 | 13,369 | 16,260 | 1.38 | 3.5% | 12.7 | 145 | 281 | 318 | 14 |
| ABCL | -15.9 | 46.6 | -15.4 | 52.7 | 3.9 | 3,489 | 3,085 | 1.19 | -1.3% | -0.7 | 9 | 17.1 | 30 | 8 |
| RXRX | -3.6 | 22.1 | -2.6 | 30.9 | 1.8 | 1,695 | 1,213 | 1.05 | -13.0% | -0.9 | 4 | 7.2 | 10 | 6 |
Source: Yahoo Finance
SDGR trades at 3.9x EV/Revenue and 5.1x price/sales, which is above CERT’s 3.2x EV/Revenue and 2.9x price/sales and roughly in line with SLP’s 3.9x EV/Revenue, though SLP is much cheaper on price/sales at 4.5x because it already earns $0.9 forward EPS and has a 5.0% FCF yield. That comparison matters because SDGR’s -2.2% FCF yield and -1.4 forward EPS mean the market is paying for future monetization, not current cash generation. On a peer-multiple basis, I would still place SDGR below the richer software-like names on a growth-adjusted basis because its leverage and cash burn are worse, so the multiple is not backed by balance-sheet quality.
Profitability
| Company | Operating Margin (TTM) | Net Margin (TTM) | Return on Assets (TTM) | Return on Equity (TTM) | Gross Margin (TTM) | EBITDA Margin (TTM) |
|---|---|---|---|---|---|---|
| SDGR | -70.6% | -21.0% | -14.4% | -16.2% | 56.9% | -57.0% |
| SLP | 22.8% | 9.9% | 5.5% | 6.2% | 63.4% | 18.3% |
| CERT | -0.2% | -16.2% | 0.8% | -2.2% | 61.6% | 22.4% |
| CRL | 15.1% | -6.0% | 4.1% | -7.5% | 34.6% | 21.2% |
| ABCL | -1,550.0% | -248.8% | -10.4% | -17.3% | -198.9% | -302.2% |
| RXRX | -1,759.7% | 0.0% | -27.3% | -56.6% | -715.7% | -859.7% |
Source: Yahoo Finance
SDGR’s 56.9% gross margin is respectable and better than CRL’s 34.6%, but its -70.6% operating margin and -57.0% EBITDA margin are far weaker than SLP’s 22.8% operating margin and 18.3% EBITDA margin, CERT’s -0.2% operating margin and 22.4% EBITDA margin, or CRL’s 15.1% operating margin and 21.2% EBITDA margin. The gap says the problem is not the revenue layer; it is the cost structure above it. SDGR’s -16.2% ROE and -14.4% ROA also trail the better peers, so the company is not yet earning acceptable returns on either equity or assets.
Leverage
| Company | Total Debt/Equity % (mrq) | Current Ratio (mrq) | Total Debt (mrq, USD Mil) | Free Cash Flow TTM (USD Mil) | Net Debt/EBITDA (TTM) | FCF Margin % (TTM) |
|---|---|---|---|---|---|---|
| SDGR | 32.8 | 2.7 | 108 | -29.2 | 2.1 | -11.3% |
| SLP | 0.3 | 5.5 | 0.5 | 18.4 | -3.3 | 22.4% |
| CERT | 31.2 | 2.6 | 301.9 | 62.6 | 1.2 | 14.8% |
| CRL | 105 | 1.3 | 3,034.3 | 468.9 | 3.3 | 11.7% |
| ABCL | 15.1 | 12.8 | 135.6 | -46.4 | 2 | -70.2% |
| RXRX | 7.3 | 5 | 66.6 | -219.5 | 1 | -400.1% |
Source: Yahoo Finance
SDGR’s 32.8% debt/equity is higher than SLP’s 0.3% and CERT’s 31.2%, while its 2.7x current ratio is solid but not exceptional versus SLP’s 5.5x and ABCL’s 12.8x. The more important point is that SDGR’s -11.3% FCF margin and -$29.2M free cash flow TTM show the balance sheet is still financing the business. That is why the valuation premium is harder to defend: the market is paying for a platform with decent liquidity, but not for one that is already self-funding.
Conclusion
I would put my rating as a sell because the key tension is unresolved: Schrödinger has a real platform moat, but the numbers still show a business that is not yet converting that moat into durable cash flow. The gross margin is healthy and the customer base is broad, yet operating cash flow of -$126.9M TTM and levered free cash flow of -$29.2M TTM tell me the company is still consuming capital. That is why I do not think the current 3.9x EV/Revenue multiple is justified today.
I would raise my rating more toward a buy if revenue growth re-accelerates above the 7.5% TTM pace and operating margin moves materially closer to a positive operating margin, because that would show the software base is scaling faster than the cost structure. I would also want to see free cash flow turn positive, since that would mean the current cash balance is no longer funding the business and the platform is starting to finance itself. If the hosted transition and partnership model can deliver steadier revenue recognition while keeping collaboration income from lurching quarter to quarter, the valuation case would improve quickly.
I would move from sell to hold if the company simply proves that the current cash burn is temporary and not structural, but I would move lower again if revenue stays uneven and operating cash flow remains negative through the next few quarters. In that case, the market would still be paying up for a recovery that has not yet shown up in the cash numbers. For now, I think the safer read is that the moat is intact, but the financial bridge to durable earnings is still not built.
What to Watch Next
- Revenue growth above 7.5% TTM — would support a higher rating.
- Operating margin moving toward a positive operating margin — would show the cost base is scaling.
- Free cash flow turning positive — would confirm the business is starting to self-fund.
- Operating cash flow staying negative — would keep financing risk in focus.
- A steadier software renewal cadence after the commercial leadership change — would support the moat thesis.
What’s your take? I rated Schrödinger (SDGR) SELL above — but the goal here is to get this right, not just to publish an opinion. What would you add to this analysis, or which risk or catalyst do you think I’m under- or over-weighting? Tell me in the comments.
Sources
- SEC 10-K Annual Report — filed 2026-02-25
- SEC 8-K Filing (2026-06-08)
- SEC 8-K Filing (2026-05-20)
- SEC 8-K Filing (2026-05-05)
- SEC 8-K Filing (2026-03-12)
- SEC 8-K Filing (2026-02-25)
- SEC Form 4 Insider Transaction (2026-04-17)
- SEC Form 4 Insider Transaction (2026-04-17)
- SEC Form 4 Insider Transaction (2026-03-06)
- SEC 10-K Annual Report — FY2026
- SEC 10-K Annual Report — FY2025
- SEC 10-K Annual Report — FY2024
- SEC 10-K Annual Report — FY2023
- SEC 10-K Annual Report — FY2022
Data sourced from Yahoo Finance and SEC EDGAR. Not investment advice.
Leave a Comment