| Company | Sep 25 | Oct 25 | Nov 25 | Dec 25 | Jan 26 | Feb 26 | Mar 26 | Apr 26 | May 26 | Jun 26 | Jul 26 | Aug 26 | 12-Mo |
|---|---|---|---|---|---|---|---|---|---|---|---|---|---|
| ASX | +12% | +44% | -7% | +8% | +18% | +28% | -11% | +45% | +22% | +18% | -21% | +5% | +277% |
| UMC | +15% | +2% | -3% | +5% | +30% | +3% | -14% | +45% | +70% | +23% | -29% | +4% | +207% |
| AMKR | +18% | +14% | +13% | +9% | +22% | -1% | -6% | +55% | -0% | +24% | -42% | -5% | +97% |
| AMAT | +27% | +14% | +8% | +2% | +25% | +16% | -8% | +15% | +14% | +61% | -30% | -10% | +187% |
| KLAC | +24% | +12% | -3% | +3% | +18% | +7% | -3% | +19% | +10% | +57% | -39% | -4% | +102% |
| TSM | +21% | +8% | -3% | +5% | +9% | +13% | -10% | +17% | +6% | +14% | -15% | +3% | +82% |
Source: Yahoo Finance monthly adjusted close.
Quick Thesis
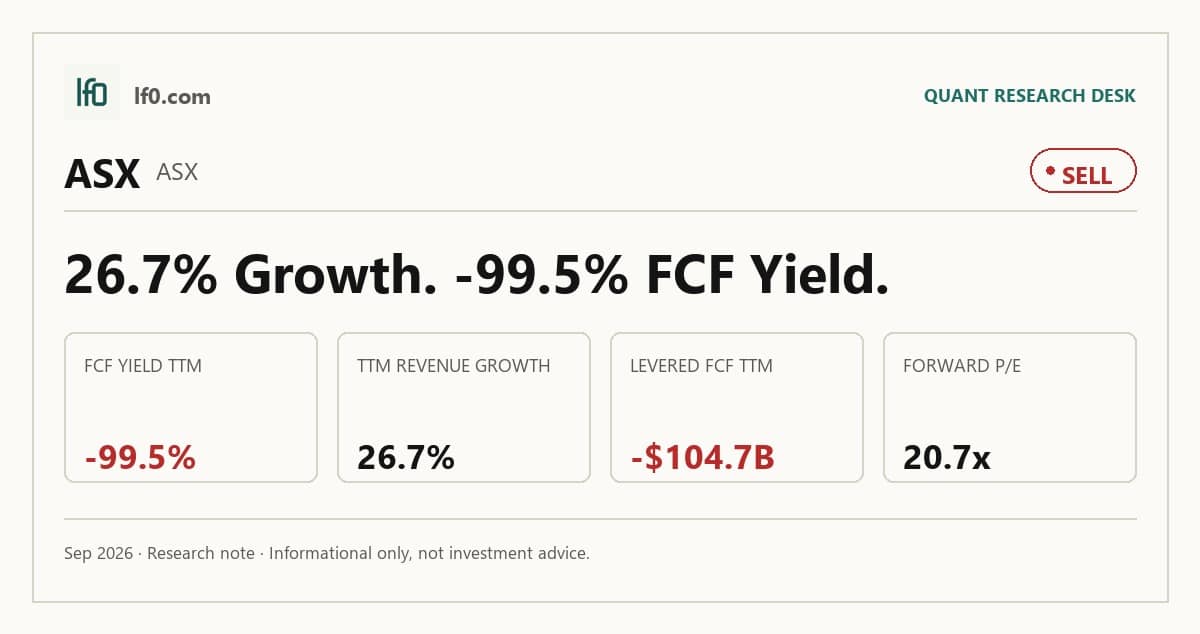
- Rated sell — cash conversion is still broken despite strong revenue growth.
- Strongest point: TTM operating cash flow was $168.8B.
- Biggest risk: TTM levered free cash flow was -$104.7B.
- Valuation is rich on earnings recovery: 20.7x forward P/E and -99.5% FCF yield.
- I would move to a less bearish rating if free cash flow turns positive for two to three quarters.
Executive Summary
Rating: SELL | ASX
Measured from adjusted close on 2026-09-18 to 2026-09-18. Sell ratings are correct when the stock falls; Hold is tracked as a +/-10% range. Daily-close data, not intraday. Calls are tracked for 182 days from publication, then frozen as a final record.
I would put my rating as a Sell because ASE Technology’s revenue growth is real, but the stock already prices in a recovery that has not yet shown up in free cash flow. Q2 2026 revenue reached $191.1B, up 26.8% year over year, and EBITDA rose to $47.6B, so the operating mix is improving; the problem is that levered free cash flow was -$104.7B over the trailing twelve months, which tells me the equity is still being funded by accounting earnings rather than cash.
I would raise my rating more towards a Hold if free cash flow turns positive and stays there for two to three quarters, because that would show the current capex cycle is translating into cash rather than just earnings. If FCF margin moved from -14.7% to a low single-digit positive level on the current revenue base, that would mean roughly NT$20B to NT$30B of annual cash generation swing, enough to change the deleveraging path and make the 20.7x forward P/E easier to justify.
Company Profile
ASE Technology Holding Co., Ltd. was formed on April 30, 2018 through a statutory share exchange that combined Advanced Semiconductor Engineering, Inc. and Siliconware Precision Industries Co., Ltd., both founded in 1984. It is a semiconductor assembly and test company that also provides electronic manufacturing services through USI Group, with 2025 operating revenue split of 47.8% packaging, 11.1% testing, and 39.9% EMS. The group directly controls ASE Group, SPIL Group, USI Group, ASE Social Enterprise Co., Ltd., and ASE Global Integrated Solutions Co., Ltd., and it completed the 100% acquisitions of ASEPCAYMAN and CHE in 2024 before taking control of EugenLight Technologies in January 2026. Its manufacturing footprint spans Taiwan, the P.R.C., South Korea, Japan, Singapore, Malaysia, the Philippines, Vietnam, Mexico, the U.S., and Europe, with principal facilities in Kaohsiung, Taichung, and Hsinchu. Common shares trade on the Taiwan Stock Exchange under 3711, and American Depositary Shares trade on the New York Stock Exchange under ASX.
Economic Moat
Business Model
The clearest advantage is the ability to deliver turnkey semiconductor packaging, testing, interconnect materials, and EMS through a dense footprint that sits close to foundries and fabless customers, with 25,001 wire bonders, 7,456 testers, and 205 SMT lines as of January 31, 2026. In my view, a rival cannot replicate that combination of scale, process qualification, and customer proximity within 3 years because each customer must qualify facilities separately, and the company already has 6,358 patents plus 2,249 pending patent applications supporting its packaging and EMS toolset. The strategic alliance with TSMC, in place since 1997 and described as a non-exclusive preferred-provider relationship for TSMC-manufactured semiconductors, adds a second moat layer because it ties ASE into the foundry ecosystem that many customers want to access through one supply chain. The 2025 mix also shows the business is moving toward more advanced work, with bumping, flip chip, wafer-level packaging, and SiP rising to 59.6% of packaging revenue in 2025 from 51.3% in 2023, which tells me the company is gaining content in higher-complexity sockets rather than losing relevance.
Business & Operating Risks
Packaging and testing concentration is the clearest risk because one customer still accounted for NT$161.3B of operating revenue in FY2025, down from NT$174.5B in FY2024 but still equal to roughly one quarter of group sales, so a design loss or volume cut from that account would hit revenue and factory loading quickly. The filing also shows the customer base is not truly diversified: the ten largest customers represented 50.0% of trade receivables in FY2025, which means a payment delay from a small set of accounts could pressure working capital even before it shows up in revenue. Capital intensity is the second pressure point. Property, plant and equipment rose to NT$421.1B in FY2025 from NT$312.5B in FY2024, and cash paid for property, plant and equipment jumped to NT$164.6B from NT$79.5B, which means the company is committing more cash to keep capacity ahead of demand. Goodwill and acquired intangibles are now a more visible impairment risk than they were three years ago. Goodwill was NT$52.5B at December 31, 2025, and the company already booked NT$132.8M of goodwill impairment in FY2025 plus NT$593.9M of total impairment losses in other operating income and expenses, so the risk has moved from disclosure language into reported results. Foreign exchange and hedging remain a material operating risk, but the company has not been passive. The filing discloses NT$245.996B of U.S. dollar monetary assets and NT$243.686B of U.S. dollar monetary liabilities at December 31, 2025, so currency swings can move reported earnings even when the underlying business is stable. These risks do not break the moat, but they do mean the scale advantage only matters if ASE keeps utilization high and keeps converting that scale into cash.
Management Discussion & Analysis
Management is signaling a heavy capacity build and a willingness to fund it with a mix of internal cash, credit lines, and future borrowings, and that posture is consistent with the moat only if utilization stays high enough to absorb the new depreciation load. Capital expenditures rose to NT$171.6B in 2025 from NT$96.2B in 2024, and management says 2026 capex will be financed through existing cash, expected operating cash flow, and existing credit lines. The operating data partly supports that stance: packaging revenue rose 17.8% in 2025 and testing revenue rose 31.8%, while packaging and testing gross margin improved to 23.8% from 22.9%, so the advanced-packaging mix is working. The gap is in EMS, where revenue fell 5.2% in 2025 because of the slow recovery of general communication and automotive products, so the growth narrative is not uniform across the portfolio. Management also says it may continue to evaluate equity offerings or borrowings and that additional equity could dilute shareholders, which means the balance sheet is flexible but not free. The 14,258-person research and development team and the 5.1% of operating revenues spent on research and development in 2025 show that the company is still paying up to stay ahead technologically, so investors should view the current margin uplift as tied to execution, not as a finished state.
Prior filings were broadly consistent on the direction of travel, but not always on the timing. In 2024’s 10-K, management emphasized continued investment in advanced packaging and capacity expansion, and 2025 results confirmed that with packaging revenue up 17.8% and capital expenditures up to NT$171.6B, so that commitment was delivered. The same prior filings also framed utilization and mix as the main margin levers, and 2025 gross margin improved to 17.7% from 16.3%, which supports the claim that mix and factory efficiency matter. By contrast, the slow recovery in general communication and automotive products has now been cited as the reason EMS revenue fell 5.2% in 2025, so the weakness in that segment looks less temporary than earlier tone may have implied. Leadership continuity appears stable in the current filing, which is a positive for credibility, but the provided history does not list prior-year CEO and CFO names, so I cannot verify management turnover from the materials here. Management is actively responding to the risks above by funding capacity, protecting technology spend, and leaning into higher-value packaging, but the customer-concentration and cash-conversion issues are still unresolved.
Recent Events
The most important recent development is the January 2026 control of EugenLight Technologies, which extends ASE’s manufacturing and technology footprint rather than changing the core model. That matters because the company’s moat depends on breadth of capability and proximity to customers, and the acquisition adds another node to that network. The 2024 acquisitions of ASEPCAYMAN, CHE, and Infineon Group’s manufacturing subsidiaries in the Philippines and South Korea point in the same direction: ASE is still building geographic redundancy and process depth, not retrenching. I view that as moat-positive, but it also reinforces the capital-intensity issue because each addition has to earn its keep through higher utilization and better mix.
Financial Analysis
Growth
ASX — Financial Growth (Quarterly, USD Mil)
| Metric | 2025-06-30 | 2025-09-30 | 2025-12-31 | 2026-03-31 | 2026-06-30 |
|---|---|---|---|---|---|
| REVENUE (USD Mil) | 150,750 | 168,569 | 177,915.7 | 173,662.2 | 191,064 |
| EBIT (USD Mil) | 10,458 | 15,404 | 21,853.5 | 20,247 | 27,553 |
| EBITDA (USD Mil) | 26,989 | 32,396 | 39,679.3 | 38,895.4 | 47,553 |
| NET INCOME (USD Mil) | 7,521 | 10,870 | 14,070.8 | 14,147.5 | 21,068 |
| DILUTED EPS | 3.4 | 4.8 | 6.5 | 6.2 | 9.2 |
Source: Yahoo Finance — Quarterly Financial Statements
Revenue accelerated from $150.8B in Q2 2025 to $191.1B in Q2 2026, a 26.8% year-over-year increase, after rising to $168.6B in Q3 2025 and $177.9B in Q4 2025. EBITDA grew faster than revenue in Q2 2026, reaching $47.6B versus $27B a year earlier, while net income rose to $21.1B from $7.5B, so earnings are outpacing sales. The Q1 2026 dip to $173.7B revenue from $178B in Q4 2025 looks like a normal sequential pause, but the rebound in Q2 2026 shows the trend is still upward. That is consistent with the advanced-packaging mix shift described above, and it matters because growth here is not just scale for its own sake — it is feeding a more profitable product mix.
Profitability
ASX — Profitability (TTM)
| Metric | TTM |
|---|---|
| Operating Margin (TTM) | 11.1% |
| Net Margin (TTM) | 8.5% |
| Return on Assets (TTM) | 4.7% |
| Return on Equity (TTM) | 17.0% |
| Gross Margin (TTM) | 19.5% |
| EBITDA Margin (TTM) | 19.7% |
Source: Yahoo Finance — Trailing Twelve Months (TTM)
TTM operating margin was 11.1%, net margin was 8.6%, gross margin was 19.5%, EBITDA margin was 19.7%, return on assets was 4.7%, and return on equity was 17.0%. The spread between gross margin and operating margin is only 8.4 percentage points, which tells me packaging and testing economics are not broken at the product level; the pressure sits in overhead, scale, and mix rather than in the cost of revenue. EBITDA margin is only 0.2 percentage points above gross margin, so depreciation and amortisation are not masking a much weaker operating base. The ROE and ROA gap is wide, which means returns are being amplified by leverage rather than by exceptionally efficient asset use. Profitability is positive, but I would want to see operating margin move higher before I call the cash conversion problem solved.
Valuation
ASX — Valuation Multiples
| Metric | Value |
|---|---|
| Current Share Price (USD) | 40.4 |
| Market Cap (USD Mil) | 105,253 |
| Enterprise Value (USD Mil) | 308,072 |
| Trailing P/E | 49.3 |
| Forward P/E | 20.7 |
| Price/Sales (TTM) | 0.1 |
| EV/Revenue | 0.4 |
| EV/EBITDA | 2.2 |
| FCF Yield % (TTM) | -99.5% |
| Forward EPS (USD) | 2 |
| Analyst Target Price – Low (USD) | 51 |
| Analyst Target Price – Mean (USD) | 51 |
| Analyst Target Price – High (USD) | 51 |
| # Analyst Opinions | 1 |
Source: Yahoo Finance
ASE Technology Holding trades at 0.4x EV/Revenue and 0.2x Price/Sales on TTM figures, with EV/EBITDA at 2.2x and trailing P/E at 49.3x. The primary read is the revenue multiple: at 0.4x enterprise value to revenue on a current share price of $40.4, the market is pricing a business with modest cyclicality and limited margin durability, not a high-growth compounder. Forward P/E falls to 20.7x, which implies investors are willing to pay for earnings normalization, but the 49.3x trailing P/E shows the latest twelve months still carry enough noise that current earnings are not the clean anchor. PEG ratio is 5.0x, so the stock is not cheap relative to its expected growth path. Price/Book is 7.3x against book value per share of $5.57 and cash per share of $48.05, which means the equity trades at a large premium to accounting book but below the cash on hand per share, a useful reminder that balance-sheet liquidity is supporting the valuation. FCF Yield is -99.5%, because levered free cash flow was negative in the latest twelve months, so cash generation is not yet backing the share price.
On the analysis here, I would put fair value in a range of $35-$45 per share. That sits below the $51 analyst target because there is only one analyst opinion, so I do not treat that as a meaningful consensus; I weight the negative free cash flow and thin current ratio more heavily than the market appears to. Forward EPS of $1.95 implies a 20.7x multiple at the current price, which is not demanding if earnings keep compounding, but it is still rich relative to a business that has not yet proven to me that cash conversion has turned. The valuation picture is therefore fair to slightly rich, not cheap.
Leverage
ASX — Leverage & Coverage (Quarterly)
| Metric | Value |
|---|---|
| Total Debt/Equity % (mrq) | 70.6 |
| Current Ratio (mrq) | 1.1 |
| Total Debt (mrq, USD Mil) | 295,792.4 |
| Operating Cash Flow (TTM, USD Mil) | 168,832.4 |
| Levered Free Cash Flow (TTM, USD Mil) | -104,674.5 |
| Net Debt/EBITDA (TTM) | 1.4 |
| FCF Margin % (TTM) | -14.7% |
Source: Yahoo Finance — Quarterly Financial Statements
ASE Technology’s leverage is moderate, not stretched: Total Debt/Equity % (mrq) was 70.6%, Current Ratio (mrq) was 1.1, and Total Debt (mrq, USD Mil) was $295.8B. The liquidity cushion is thin because current assets barely cover current liabilities, so refinancing or working-capital pressure would show up quickly if demand softens. Cash generation is mixed. Operating Cash Flow (TTM, USD Mil) was $168.8B, but Levered Free Cash Flow (TTM, USD Mil) was -$104.7B and FCF Margin % (TTM) was -14.7%, which means EBITDA is not converting cleanly into cash after capex, interest, and working-capital needs. Net Debt/EBITDA (TTM) was 1.4x, so the balance sheet is not overlevered, but the negative free cash flow leaves less room to absorb a downturn without tighter capital discipline. In my opinion, this is medium refinancing risk because leverage is manageable today, yet the weak cash conversion and 1.1 current ratio leave limited flexibility if funding markets tighten.
Insider Activity
The insider transaction record I see here is one-sided: 0 open-market purchases versus 29 open-market sales across 11 filings from 2026-04-08 to 2026-06-03, so insiders are net sellers. The selling is broad enough to matter, led by repeated sales from Chen Jeffrey and smaller sales from Uang Du-Tsuen, which suggests weak alignment between insiders and shareholders over this window. That does not change the operating thesis by itself, but it does reinforce my caution on valuation because management is not signaling conviction through buying.
Comparable Analysis
Growth
| Company | Revenue TTM (USD Mil) | Revenue Growth YoY % | Diluted EPS TTM |
|---|---|---|---|
| ASX | 711,209.8 | 26.7% | 0.8 |
| UMC | 250,707.1 | 17.0% | 1 |
| AMKR | 7,457.7 | 25.6% | 2.2 |
| AMAT | 30,837 | 24.8% | 11.7 |
| KLAC | 13,579.5 | 15.2% | 3.7 |
| TSM | 4,440,492.3 | 36.0% | 13.4 |
Source: Yahoo Finance
Growth is the clearest edge for ASX: revenue grew 26.7% TTM versus 17.0% for UMC, 25.6% for AMKR, 24.8% for AMAT, 15.2% for KLAC, and 36.0% for TSM, so ASX sits in the upper half of the peer set without being the fastest. I feel that growth premium is justified because ASX also posted 171.2% quarterly earnings growth YoY and 0.8 diluted EPS TTM, which suggests the top line is still converting into profit rather than just scale for its own sake.
Valuation
| Company | Current Share Price (USD) | Trailing P/E | Forward P/E | EV/Revenue | EV/EBITDA | Price/Sales (TTM) | Price/Book (mrq) | Beta (5Y Monthly) | FCF Yield % (TTM) | Forward EPS | Analyst Target Price – Low | Analyst Target Price – Mean | Analyst Target Price – High | # Analyst Opinions |
|---|---|---|---|---|---|---|---|---|---|---|---|---|---|---|
| ASX | 40.4 | 49.3 | 20.7 | 0.4 | 2.2 | 0.1 | 7.3 | 1.57 | -99.5% | 2 | 51 | 51 | 51 | 1 |
| UMC | 24.2 | 23.3 | 27.5 | -0.1 | -0.2 | 0.2 | 4.4 | 1.70 | 60.8% | 0.9 | 10.8 | 18.5 | 33.8 | 4 |
| AMKR | 48.9 | 21.9 | 17.4 | 1.6 | 9.1 | 1.6 | 2.6 | 2.23 | -3.1% | 2.8 | 65 | 76.4 | 92 | 10 |
| AMAT | 436.6 | 37.5 | 23.7 | 10.7 | 32.4 | 11.2 | 13.5 | 1.60 | 0.9% | 18.5 | 358 | 640.9 | 900 | 35 |
| KLAC | 173.6 | 47.3 | 25.9 | 16.4 | 36.7 | 16.7 | 35.7 | 1.44 | 1.2% | 6.7 | 175 | 233.8 | 325 | 26 |
| TSM | 431.2 | 32.1 | 19.7 | 3.5 | 4.9 | 0.5 | 88.3 | 1.25 | 32.7% | 21.9 | 440 | 552.3 | 700 | 20 |
Source: Yahoo Finance
Valuation is mixed, but the cash-flow lens is the right one here because ASX’s FCF Yield % (TTM) is -99.5%, far weaker than UMC’s 60.8%, AMAT’s 0.9%, KLAC’s 1.2%, AMKR’s -3.1%, and TSM’s 32.7%. That gap says ASX is not being priced on cash generation, and the 20.7x forward P/E versus UMC at 27.5x, AMKR at 17.4x, AMAT at 23.7x, KLAC at 25.9x, and TSM at 19.7x looks fair only if ASX can turn its -14.7% FCF margin into positive cash conversion. Forward EPS of $1.95 for ASX sits below AMKR’s $2.8 and far below AMAT’s $18.5 or TSM’s $21.9, so the current $40.4 share price is not cheap on earnings power alone. ASX’s 0.4x EV/Revenue also looks less compelling when paired with the negative FCF yield, because the market is paying for growth that still has to prove it can become cash.
Profitability
| Company | Operating Margin (TTM) | Net Margin (TTM) | Return on Assets (TTM) | Return on Equity (TTM) | Gross Margin (TTM) | EBITDA Margin (TTM) |
|---|---|---|---|---|---|---|
| ASX | 11.1% | 8.5% | 4.7% | 17.0% | 19.5% | 19.7% |
| UMC | 21.7% | 33.3% | 5.1% | 21.3% | 30.6% | 43.8% |
| AMKR | 10.5% | 7.4% | 4.6% | 12.5% | 15.5% | 17.8% |
| AMAT | 33.7% | 30.1% | 15.5% | 41.1% | 49.4% | 32.9% |
| KLAC | 42.5% | 35.6% | 20.8% | 87.5% | 61.3% | 44.6% |
| TSM | 60.3% | 49.9% | 19.0% | 40.0% | 64.2% | 71.3% |
Source: Yahoo Finance
Profitability is a relative weak spot. ASX’s gross margin of 19.5%, EBITDA margin of 19.7%, operating margin of 11.1%, and net margin of 8.6% all trail UMC’s 30.6%, 43.8%, 21.7%, and 33.3%, while also sitting below AMAT’s 49.4%, 32.9%, 33.7%, and 30.1% and KLAC’s 61.3%, 44.6%, 42.5%, and 35.6%. That pattern points more to a cost-of-revenue and scale gap than to a pure opex problem, because ASX’s gross margin is already well below the better peers before operating leverage even matters. On returns, ASX’s ROE of 17.0% and ROA of 4.7% are ahead of AMKR’s 12.5% and 4.6%, but below UMC’s 21.3% and 5.1%, AMAT’s 41.1% and 15.5%, KLAC’s 87.5% and 20.8%, and TSM’s 40.0% and 19.0%, which tells me the business is respectable rather than elite.
Leverage
| Company | Total Debt/Equity % (mrq) | Current Ratio (mrq) | Free Cash Flow TTM (USD Mil) | Net Debt/EBITDA (TTM) | FCF Margin % (TTM) |
|---|---|---|---|---|---|
| ASX | 70.6 | 1.1 | -104,674.5 | 1.4 | -14.7% |
| UMC | 14.3 | 2.2 | 36,890.6 | -0.8 | 14.7% |
| AMKR | 57.1 | 2.2 | -378.8 | 0.1 | -5.1% |
| AMAT | 28.7 | 2.4 | 3,075.4 | -0.2 | 10.0% |
| KLAC | 96.9 | 2.9 | 2,624.6 | 0.2 | 19.3% |
| TSM | 16.5 | 2.5 | 730,826 | -0.8 | 16.5% |
Source: Yahoo Finance
Leverage looks manageable, not a source of upside. ASX’s total debt to equity is 70.6% and net debt to EBITDA is 1.4x, which is higher than UMC’s 14.3% and -0.8x, AMKR’s 57.1% and 0.1x, AMAT’s 28.7% and -0.2x, KLAC’s 96.9% and 0.2x, and TSM’s 16.5% and -0.8x. The difference matters because ASX’s 1.1x current ratio and -14.7% FCF margin mean debt is funding a business that is still burning cash, while peers like UMC, AMAT, KLAC, and TSM are cash generative and can use balance-sheet strength as a competitive advantage. That is why ASX’s valuation should not be read in isolation: the multiple looks modest until you remember that the balance sheet is carrying a business that has not yet converted earnings into free cash flow.
Conclusion
The tension in this case is simple: ASE Technology is growing fast enough to justify attention, but not yet cash-generating enough to justify complacency. Revenue growth and margin improvement are real, and the advanced-packaging mix is still working, yet levered free cash flow remains negative and the current ratio is only 1.1, so the market is paying for a recovery that still needs to prove itself in cash.
I would raise my rating more towards a Buy if free cash flow turns positive and stays there for two to three quarters, because that would show the current capex cycle is translating into cash rather than just earnings. If FCF margin moved from -14.7% to a low single-digit positive level on the current revenue base, that would mean roughly NT$20B to NT$30B of annual cash generation swing, enough to change the deleveraging path and make the 20.7x forward P/E easier to justify. I would also become more constructive if the company can keep revenue growth in the mid-20% range while lifting operating margin toward the mid-teens, because that would show the scale advantage is finally feeding through to cash.
I would move from Sell to Hold if revenue growth slows back toward the low teens while capex stays near the FY2025 pace, because then the market would be paying for growth that is not converting into cash. A second warning sign would be another year of insider selling like the 29 open-market sales versus zero purchases in the latest window, since that would reinforce the view that management is not seeing enough near-term upside to add stock while the current ratio stays only 1.1x and net debt to EBITDA is still 1.4x.
Weighing both paths, I lean to the bull case arriving first, but only gradually. The business has enough scale, customer proximity, and advanced-packaging content to keep earnings moving higher, yet the negative free cash flow and thin liquidity cushion mean I do not want to pay up for that progress until cash conversion improves.
What to Watch Next
- Free cash flow turning positive for two to three quarters — would support a move toward Hold or Buy.
- FCF margin improving from -14.7% to a low single-digit positive level — would show capex is becoming self-funding.
- Operating margin moving toward the mid-teens — would confirm better operating leverage.
- Revenue growth staying in the mid-20% range — would support the earnings recovery case.
- Current ratio holding above 1.1x while capex remains elevated — would reduce near-term liquidity pressure.
What’s your take? I rated ASE Technology (ASX) SELL above — but the goal here is to get this right, not just to publish an opinion. What would you add to this analysis, or which risk or catalyst do you think I’m under- or over-weighting? Tell me in the comments.
Sources
- SEC Form 4 Insider Transaction (2026-06-03)
- SEC Form 4 Insider Transaction (2026-05-27)
- SEC Form 4 Insider Transaction (2026-05-21)
Data sourced from Yahoo Finance and SEC EDGAR. Not investment advice.
Leave a Comment