| Company | Jul 25 | Aug 25 | Sep 25 | Oct 25 | Nov 25 | Dec 25 | Jan 26 | Feb 26 | Mar 26 | Apr 26 | May 26 | Jun 26 | 12-Mo |
|---|---|---|---|---|---|---|---|---|---|---|---|---|---|
| AMKR | +7% | +7% | +18% | +14% | +13% | +9% | +22% | -1% | -6% | +55% | -0% | +24% | +314% |
| TSM | +7% | -4% | +21% | +8% | -3% | +5% | +9% | +13% | -10% | +17% | +6% | +14% | +113% |
| GFS | -2% | -11% | +7% | -1% | +1% | -3% | +21% | +13% | -6% | +45% | +24% | +3% | +116% |
| TSEM | +6% | +29% | +23% | +18% | +27% | +9% | +15% | -7% | +41% | +26% | +15% | +2% | +501% |
| STM | -16% | +6% | +5% | -13% | -6% | +13% | +8% | +21% | +3% | +60% | +26% | +8% | +149% |
| ASX | -5% | +4% | +12% | +44% | -7% | +8% | +18% | +28% | -11% | +45% | +22% | +18% | +352% |
Source: Yahoo Finance monthly adjusted close.
Quick Thesis
This Amkor Technology stock analysis reviews AMKR free cash flow, valuation, capex needs, customer concentration, margins, and semiconductor cycle risk.
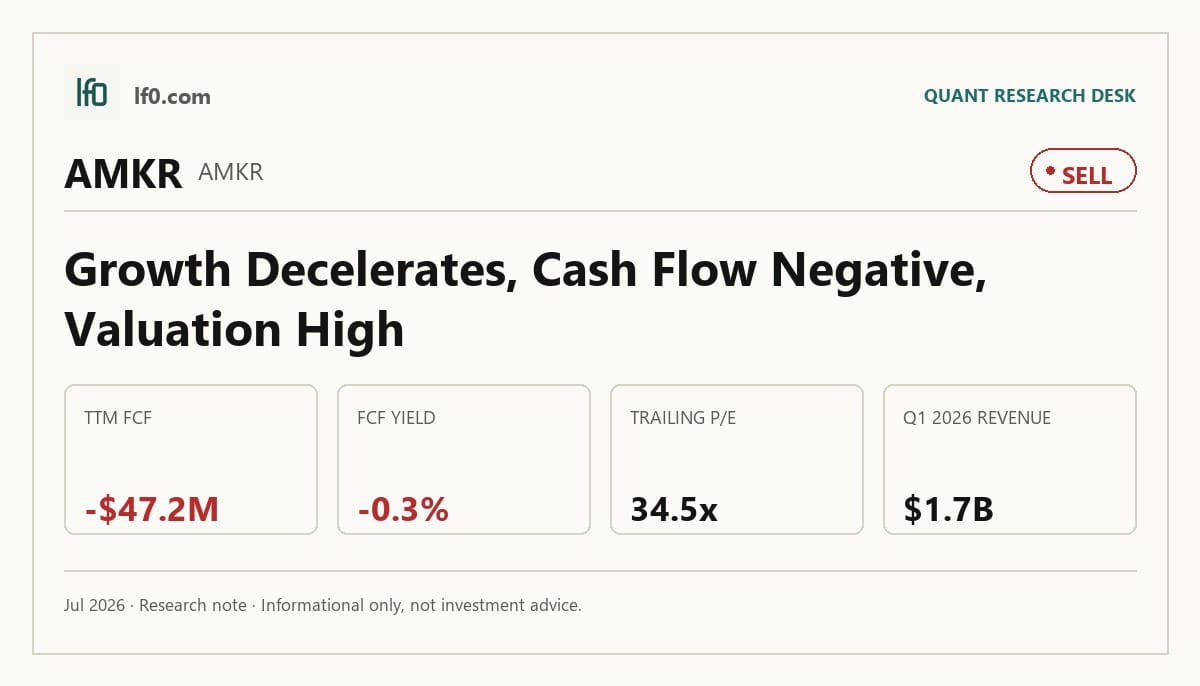
Quick thesis: AMKR is a semiconductor packaging business with negative free cash flow and a rich valuation, and the stock still depends on cycle timing, capex discipline, margin stability, and customer concentration risk.
| Factor | Why it matters |
|---|---|
| Free cash flow | Shows whether growth and capex are self-funded. |
| Valuation | Frames upside against semiconductor-cycle risk. |
| Customer concentration | Measures dependence on major customers. |
| Margins | Shows operating leverage through the cycle. |
| Capex | Determines cash conversion and balance-sheet flexibility. |
Executive Summary
Rating: SELL | AMKR
Measured from adjusted close on 2026-07-27 to 2026-10-23. Sell ratings are correct when the stock falls; Hold is tracked as a +/-10% range. Daily-close data, not intraday. Calls are tracked for 182 days from publication, then frozen as a final record.
Same call, re-affirmed: we have tracked this SELL since 2026-07-27, and the entry price above is that day’s close, not today’s price. This article re-affirms the call on 2026-10-21; the tracking window runs 182 days from then.
I would put my rating as a Sell because Amkor’s valuation already discounts a clean execution path, yet the company is still producing negative free cash flow and remains highly exposed to customer concentration. Revenue growth is real, but at 34.5x trailing P/E and 13.3x EV/EBITDA, I think the market is paying for a margin and cash conversion profile that has not fully arrived. The key catalyst is whether quarterly revenue can hold above $1.7B, roughly the Q1 2026 run rate, while free cash flow turns positive for two straight quarters; if that does not happen, the multiple looks vulnerable.
Company Profile
Amkor Technology Inc. is an outsourced semiconductor assembly and test provider that packages and tests chips for integrated device manufacturers, fabless semiconductor companies, original equipment manufacturers, and contract foundries. It earns revenue from wafer bump, wafer probe, wafer back grind, package design, packaging, burn in, system level test, final test, and drop shipment. The company was founded in 1968, went public in 1998, and now operates a global manufacturing footprint that includes Vietnam and a new Arizona facility under construction. Amkor is listed on Nasdaq under AMKR.
Economic Moat
Business Model
I think Amkor’s edge comes from the combination of advanced packaging know-how and a geographically diversified manufacturing base. The company’s portfolio includes high density fan out, 2.5D integration, advanced flip chip, wafer-level processing, and advanced system-in-package solutions, which are harder to qualify than commodity assembly work. That matters because customers are not just buying capacity; they are buying process depth, multi-site execution, and regional supply-chain resilience.
The moat is reinforced by customer stickiness. Amkor’s ten largest customers accounted for 72.0% of 2025 net sales, which is a concentration risk, but it also shows how embedded the company is with leading semiconductor names. I view that embeddedness as a real structural advantage, especially when customers want to outsource more of the flow to one vendor and shorten time to market.
Business & Operating Risks
The biggest disclosed risk is customer concentration and end-market dependence. Amkor’s ten largest customers accounted for 72.0% of 2025 net sales, and the filing flags dependence on mobile communications and automotive demand. A single customer loss, a pricing reset, or a design win shifting in-house could hit revenue and utilization at the same time.
Capacity utilization and pricing pressure are the next two risks, and they reinforce each other. The company has a high fixed-cost base, no material backlog, and customers can reduce, cancel, or delay orders, while packaging and test pricing has faced downward pressure over time. International trade exposure is also more prominent now, with BIS regulations, tariffs, export controls, and the risk that customers reroute business to less restricted competitors.
These risks do not break the moat, but they do test it. In my view, they threaten the utilization and pricing benefits that Amkor’s advanced-packaging footprint is supposed to deliver, rather than the technical know-how itself.
Management Discussion & Analysis
Management is responding to those risks by leaning harder into regional capacity and advanced packaging. The $2.5B to $3B capex plan, up from $904.6M in 2025, shows the Arizona build is the main capital priority, and the 2025 refinancing extended maturities to May 2030 while adding $500M of 5.875% notes due 2033. That helps funding flexibility, but it also means the near-term story is still about execution, not balance-sheet repair.
The operating numbers show why that matters. 2025 net sales rose 6.2% to $6.7B, and computing sales increased 16.0%, yet gross margin still fell to 14.0% from 14.8% because overhead, employee compensation, and Vietnam ramp costs outpaced utilization gains. I read that as a sign that management is still in the investment phase, with the payoff still ahead of the cash conversion.
The Vietnam ramp also needs a clearer read. Management said Vietnam would begin delivering advanced SiP modules in the second half of 2024, and the current filing still describes the facility as being in the early stages of high-volume manufacturing. That is not a contradiction, but it does tell me the ramp is taking longer to feed margins than earlier messaging implied.
Recent Events
The most important recent event is the $1.15B 0.00% Convertible Senior Notes due 2031 issued in May 2026. That financing gives Amkor more capital for capex and capped-call transactions, but it also introduces dilution risk if the stock trades through the $106.37 conversion price. I see that as a useful funding step, not a clean de-risking.
The May 2026 annual meeting was routine, with all 11 director nominees elected and say-on-pay approved. I read that as continuity rather than a strategic reset. The May 2026 Investor Day filing matters more because it signals management wants investors focused on execution and capital deployment, not governance noise.
Financial Analysis
Growth
AMKR — Financial Growth (Quarterly, USD Mil)
| Metric | 2025-03-31 | 2025-06-30 | 2025-09-30 | 2025-12-31 | 2026-03-31 |
|---|---|---|---|---|---|
| REVENUE (USD Mil) | 1,321.6 | 1,511.4 | 1,987 | 1,888 | 1,684.7 |
| EBIT (USD Mil) | 42.6 | 100 | 175.6 | 201.8 | 114 |
| EBITDA (USD Mil) | 196.4 | 258.9 | 339.2 | 367.5 | 284.9 |
| NET INCOME (USD Mil) | 21.1 | 54.4 | 126.6 | 171.8 | 83.4 |
| DILUTED EPS | 0.1 | 0.2 | 0.5 | 0.7 | 0.3 |
Source: Yahoo Finance — Quarterly Financial Statements
Revenue accelerated through Q3 2025 before easing in Q4 2025 and Q1 2026: $1.3B in Q1 2025, $1.5B in Q2 2025, $2B in Q3 2025, $1.9B in Q4 2025, and $1.7B in Q1 2026. That still leaves Q1 2026 revenue up 27.5% year over year, so the growth trend is intact even if the sequential path is choppy. EBITDA rose to $284.9M in Q1 2026 from $196.4M a year earlier, which tells me operating leverage is still working.
The pattern looks seasonal rather than broken, but I would not extrapolate the peak quarter mechanically. The business is tied to semiconductor customer timing, so the key question is whether the higher run rate can hold once the quarter-to-quarter noise settles.
Profitability
AMKR — Profitability (TTM)
| Metric | TTM |
|---|---|
| Operating Margin (TTM) | 6.0% |
| Net Margin (TTM) | 6.2% |
| Return on Assets (TTM) | 4.4% |
| Return on Equity (TTM) | 10.0% |
| Gross Margin (TTM) | 14.4% |
| EBITDA Margin (TTM) | 16.9% |
Source: Yahoo Finance — Trailing Twelve Months (TTM)
TTM gross margin was 14.4%, EBITDA margin was 16.9%, operating margin was 6.0%, and net margin was 6.2%. The spread between gross margin and operating margin shows Amkor still carries a heavy cost base, so the company is profitable but not yet generating strong scale economics. That is consistent with a capital-intensive packaging model.
Returns are acceptable, not exceptional. TTM return on assets was 4.4% and return on equity was 10%, which tells me the business is earning a decent return on capital but still sits well below the best semiconductor peers. The margin profile supports the moat thesis, but only modestly; it confirms the business can make money, not that it can do so at premium industry economics.
Valuation
AMKR — Valuation Multiples
| Metric | Value |
|---|---|
| Market Cap (USD Mil) | 14,878 |
| Enterprise Value (USD Mil) | 15,906 |
| Trailing P/E | 34.5 |
| Forward P/E | 22.9 |
| Price/Sales (TTM) | 2.1 |
| Price/Book (mrq) | 3.3 |
| EV/Revenue | 2.2 |
| EV/EBITDA | 13.3 |
| Beta (5Y Monthly) | 2.21 |
| FCF Yield % (TTM) | -0.3% |
| Forward EPS (USD) | 2.6 |
| Analyst Target Price – Low (USD) | 60 |
| Analyst Target Price – Mean (USD) | 79 |
| Analyst Target Price – High (USD) | 92 |
| # Analyst Opinions | 9 |
Source: Yahoo Finance
I would put fair value in a range of about $59-$76 per share based on the peer EV/revenue framework already discussed in this article, which is below the analyst mean target of 79 and only partly overlaps the 60–92 consensus range. That gap matters because the stock is not cheap on cash flow: FCF yield is -0.3%, so the market is paying for a recovery that has not yet shown up in free cash generation.
Forward EPS is 2.62, which is not weak, but it is also not enough by itself to justify 34.5x trailing P/E and 22.9x forward P/E unless margins keep improving. In my view, the valuation only works if the advanced-packaging ramp converts into cash, not just revenue, because the leverage profile leaves less room for disappointment than a pure growth multiple would imply.
Leverage
AMKR — Leverage & Coverage (Quarterly)
| Metric | Value |
|---|---|
| Total Debt/Equity % (mrq) | 35.4 |
| Current Ratio (mrq) | 2 |
| Total Debt (mrq, USD Mil) | 1,617.5 |
| Operating Cash Flow (TTM, USD Mil) | 1,216.5 |
| Levered Free Cash Flow (TTM, USD Mil) | -47.1 |
| Net Debt/EBITDA (TTM) | -0.2 |
| FCF Margin % (TTM) | -0.7% |
Source: Yahoo Finance — Quarterly Financial Statements
Amkor’s balance sheet is manageable, but the cash profile is still weak. Total debt/equity was 35.4% and the current ratio was 2.01, while total debt was $1.6B and operating cash flow was $1.2B TTM. Net debt/EBITDA was -0.2x, which means cash slightly exceeds debt on a net basis.
The problem is free cash flow. Levered free cash flow was -$47.15M TTM and FCF margin was -0.7%, so operating cash is being consumed by capex and other funding needs. That is why I do not treat the balance sheet as a source of upside on its own; it is a cushion, not a thesis.
Insider Activity
The insider tape is net selling. I see 23 open-market sales for $1.0B versus 5 open-market purchases for $95.0M over the period shown, and the activity is broad enough to matter because it includes multiple directors and executives. That does not prove anything by itself, but it does tell me insiders are not leaning into the stock at current levels.
Comparable Analysis
Growth
| Company | Revenue TTM (USD Mil) | Revenue Growth YoY % | EBITDA TTM (USD Mil) | Diluted EPS TTM |
|---|---|---|---|---|
| AMKR | 7,071.1 | 27.5% | 1,195.1 | 1.7 |
| TSM | 4,440,492.3 | 36.0% | 3,175,220.5 | 11.3 |
| GFS | 6,840 | 3.1% | 2,033 | 1.4 |
| TSEM | 1,621.6 | 15.5% | 537.6 | 2.2 |
| STM | 13,099 | 26.1% | 2,723 | 0.5 |
| ASX | 670,896.6 | 17.2% | 125,736.9 | 0.6 |
Source: Yahoo Finance
AMKR’s revenue growth of 27.5% TTM sits below TSM’s 36.0% and STM’s 26.1%, but well above GFS’s 3.1% and ahead of TSEM’s 15.5% and ASX’s 17.2%. EBITDA of $1.2B also compares favorably with TSEM’s $537.6M and GFS’s $2B scale, so Amkor is not the fastest grower, but it is clearly in the upper half of the group on momentum.
Valuation
| Company | Trailing P/E | Forward P/E | EV/Revenue | EV/EBITDA | Price/Sales (TTM) | Price/Book (mrq) | Market Cap (USD Mil) | Enterprise Value (USD Mil) | Beta (5Y Monthly) | FCF Yield % (TTM) | Forward EPS | Analyst Target Price – Low | Analyst Target Price – Mean | Analyst Target Price – High | # Analyst Opinions |
|---|---|---|---|---|---|---|---|---|---|---|---|---|---|---|---|
| AMKR | 34.5 | 22.9 | 2.2 | 13.3 | 2.1 | 3.3 | 14,878 | 15,906 | 2.21 | -0.3% | 2.6 | 60 | 79 | 92 | 9 |
| TSM | 34.8 | 18.3 | 3.2 | 4.5 | 0.5 | 82.1 | 2,044,093 | 14,244,352 | 1.25 | 36.2% | 21.6 | 430 | 537.4 | 700 | 18 |
| GFS | 37.4 | 20.6 | 4.1 | 13.8 | 4.2 | 2.4 | 28,494 | 28,133 | 1.76 | 4.2% | 2.5 | 60 | 81 | 125 | 21 |
| TSEM | 100.9 | 37.6 | 15.4 | 46.4 | 15.3 | 8.3 | 24,744 | 24,926 | 0.87 | 0.5% | 5.8 | 277 | 313.8 | 335 | 6 |
| STM | 103.5 | 20.6 | 3.4 | 16.3 | 3.6 | 2.6 | 47,085 | 44,401 | 1.56 | 0.4% | 2.6 | 32.8 | 72.3 | 97 | 13 |
| ASX | 56.8 | 18.4 | 0.4 | 2 | 0.1 | 7.2 | 78,532 | 255,244 | 1.46 | -84.2% | 1.9 | 36.9 | 42.5 | 48 | 2 |
Source: Yahoo Finance
AMKR trades at 34.5x trailing P/E, 22.9x forward P/E, 2.2x EV/revenue, and 13.3x EV/EBITDA. That is richer than TSM’s 4.5x EV/EBITDA and GFS’s 13.8x, while AMKR’s -0.3% FCF yield is the weakest in the set; in other words, the market is paying for growth without getting cash conversion yet. A $1 investment a year ago would be worth $3.10 in AMKR, versus $1.73 in TSM, $1.40 in GFS, $5.42 in TSEM, $2.77 in STM, and $3.77 in ASX, so the stock has already rerated hard and now needs fundamentals to catch up.
Profitability
| Company | Operating Margin (TTM) | Net Margin (TTM) | Return on Assets (TTM) | Return on Equity (TTM) | Gross Margin (TTM) | EBITDA Margin (TTM) |
|---|---|---|---|---|---|---|
| AMKR | 6.0% | 6.2% | 4.4% | 10.0% | 14.4% | 16.9% |
| TSM | 60.3% | 49.9% | 19.0% | 40.0% | 64.2% | 71.5% |
| GFS | 11.0% | 11.4% | 3.1% | 6.8% | 26.1% | 29.7% |
| TSEM | 15.6% | 15.1% | 4.1% | 8.7% | 24.8% | 33.2% |
| STM | 6.9% | 3.6% | 1.9% | 2.7% | 34.3% | 20.8% |
| ASX | 10.1% | 7.0% | 4.2% | 13.6% | 18.5% | 18.7% |
Source: Yahoo Finance
AMKR’s gross margin of 14.4%, EBITDA margin of 16.9%, operating margin of 6.0%, and net margin of 6.2% all trail TSM’s 64.2%, 71.5%, 60.3%, and 49.9% by a wide margin. It also sits below GFS on every major margin line except gross margin, which tells me Amkor is still a mid-tier profitability name rather than a best-in-class compounder. ROE of 10% and ROA of 4.4% are respectable, but they do not close the gap to the leaders.
Leverage
| Company | Total Debt/Equity % (mrq) | Current Ratio (mrq) | Total Debt (mrq, USD Mil) | Operating Cash Flow TTM (USD Mil) | Free Cash Flow TTM (USD Mil) | Net Debt/EBITDA (TTM) | FCF Margin % (TTM) |
|---|---|---|---|---|---|---|---|
| AMKR | 35.4 | 2 | 1,617.5 | 1,216.5 | -47.1 | -0.2 | -0.7% |
| TSM | 15.2 | 2.5 | 982,447 | 2,634,678.8 | 739,058 | -0.8 | 16.6% |
| GFS | 14.7 | 2.6 | 1,724 | 1,942 | 1,193 | -0.6 | 17.4% |
| TSEM | 5.2 | 5.6 | 155.9 | 811.5 | 128.9 | -2.5 | 8.0% |
| STM | 22.3 | 2.8 | 4,025 | 2,260 | 197.6 | -0.7 | 1.5% |
| ASX | 67.2 | 1.1 | 255,975.2 | 158,663.4 | -66,127.5 | 1.1 | -9.9% |
Source: Yahoo Finance
AMKR’s debt/equity of 35.4% is higher than TSM’s 15.2%, GFS’s 14.7%, and TSEM’s 5.2%, but net debt/EBITDA of -0.2x means the company is effectively in a net-cash position. That helps explain why AMKR can fund the Arizona and Vietnam buildouts without immediate refinancing pressure, even though its -0.7% FCF margin is weaker than the positive margins posted by most peers. The balance sheet is not the problem; the issue is whether the cash generated by operations can keep up with the capital intensity of the strategy.
Conclusion
I would put my rating as a Sell because the core tension is now clear: Amkor has real growth, but the market is already paying for a cash conversion profile that has not arrived. Revenue is up 27.5% year over year, EBITDA margin is 16.9% TTM, and the balance sheet is not stretched on a net basis, yet free cash flow remains negative and the stock still trades at 34.5x trailing earnings.
The bull case is straightforward. If quarterly revenue can stay above $1.7B, meaning the Q1 2026 run rate holds, and free cash flow turns positive for two consecutive quarters, I would become much more constructive because that would show the Vietnam and Arizona investments are finally converting into cash. A further 1.0-point expansion in EBITDA margin would also matter, because on a $6.7B sales base it would add about $67M of EBITDA and improve the deleveraging path.
The bear case is just as clear. If quarterly revenue slips back below $1.5B, the advanced-packaging cycle is losing momentum, and the current valuation would be hard to defend with negative FCF still in the background. I would also turn more negative if customer concentration starts to show up in lost orders or weaker utilization, because that would hit margins and cash flow at the same time.
I lean to Sell because the downside case needs only a normal pause in semiconductor demand to expose how much success is already priced in. The stock can work if execution stays strong, but I want to see positive free cash flow and steadier quarterly revenue before I would move up the scale.
What’s your take? I rated Amkor Technology (AMKR) SELL above — but the goal here is to get this right, not just to publish an opinion. What would you add to this analysis, or which risk or catalyst do you think I’m under- or over-weighting? Tell me in the comments.
Sources
- SEC 10-K Annual Report — filed 2026-02-20
- SEC 8-K Filing (2026-05-21)
- SEC 8-K Filing (2026-05-19)
- SEC 8-K Filing (2026-05-05)
- SEC 8-K Filing (2026-05-01)
- SEC 8-K Filing (2026-04-30)
- SEC 8-K Filing (2026-04-27)
- SEC Form 4 Insider Transaction (2026-05-20)
- SEC Form 4 Insider Transaction (2026-05-20)
- SEC Form 4 Insider Transaction (2026-05-15)
- SEC 10-K Annual Report — FY2026
- SEC 10-K Annual Report — FY2025
- SEC 10-K Annual Report — FY2024
- SEC 10-K Annual Report — FY2023
- SEC 10-K Annual Report — FY2022
Data sourced from Yahoo Finance and SEC EDGAR. Not investment advice.
Leave a Comment