
| Company | Aug 25 | Sep 25 | Oct 25 | Nov 25 | Dec 25 | Jan 26 | Feb 26 | Mar 26 | Apr 26 | May 26 | Jun 26 | Jul 26 | 12-Mo |
|---|---|---|---|---|---|---|---|---|---|---|---|---|---|
| STXS | +27% | +8% | -6% | -15% | -7% | -5% | -1% | -15% | +2% | +6% | -13% | -27% | -44% |
| AORT | +42% | -4% | +7% | +3% | -2% | -11% | -6% | -5% | -2% | -38% | +1% | +19% | -13% |
| ATRC | +5% | -5% | -2% | +5% | +10% | -7% | -15% | -9% | -1% | -2% | +1% | +35% | +8% |
| PEN | +8% | -7% | -10% | +29% | +6% | +15% | -4% | -5% | -1% | -3% | -1% | +2% | +27% |
| TCMD | +33% | +4% | +9% | +71% | +13% | -0% | +1% | -11% | -12% | +7% | +21% | -5% | +182% |
| RBOT | -31% | -10% | -3% | -44% | -28% | +1% | -7% | -65% | -31% | +80% | -84% | -47% | -99% |
Source: Yahoo Finance monthly adjusted close.
Quick Thesis
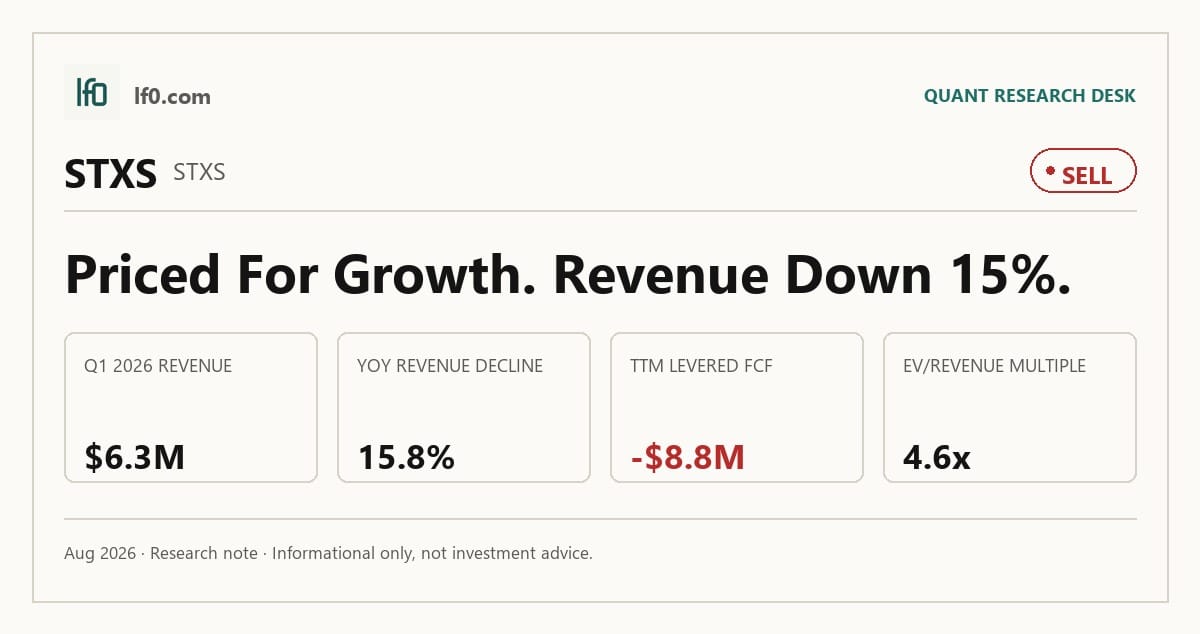
- Rated Sell — cash burn and uneven revenue still dominate the thesis.
- Gross margin is 55.6% TTM, showing the product layer still has value.
- Levered free cash flow is $-8.8M TTM, the clearest financial risk.
- STXS trades at 4.6x EV/Revenue, rich for a business with negative growth.
- I would turn more constructive if Q2 2026 revenue reclaims $8.8M and free cash flow improves.
Executive Summary
Rating: SELL | STXS
Measured from adjusted close on 2026-08-17 to 2026-10-01. Sell ratings are correct when the stock falls; Hold is tracked as a +/-10% range. Daily-close data, not intraday. Calls are tracked for 182 days from publication, then frozen as a final record.
I would put my rating as a Sell because STXS is still burning cash while revenue remains uneven, and the market is already paying for a recovery that has not yet shown up in the operating data. The company’s 55.6% gross margin TTM is the best sign that the robotic platform and disposable mix can still create value, but the $-8.8M levered free cash flow TTM shows that value is not yet reaching equity holders. I would raise my rating more towards a Buy if revenue holds above $8M for two consecutive quarters and operating margin turns positive, meaning gross profit is finally covering operating expense. Free cash flow turning positive would be the cleaner proof point, because it would show the business can fund growth without repeated equity issuance.
Company Profile
Stereotaxis designs, manufactures, and markets robotic systems, disposable interventional devices, and information systems for interventional laboratories. Revenue comes from capital system sales, disposable catheters and accessories, service and software maintenance, and recurring post-warranty support. Founded in 1990 and listed on NYSE American under STXS, it operates as one segment from St. Louis, Missouri, with employees in 11 countries as of December 31, 2025. The installed base spans more than 100 hospitals globally, and the company has supported over 150,000 arrhythmia procedures and more than 500 clinical publications. In July 2024, it acquired Access Point Technologies EP, Inc. (APT), a catheter maker in Rogers, Minnesota, adding in-house catheter manufacturing and the Map iT diagnostic portfolio. As of December 31, 2025, backlog was about $9.1M, and the company financed operations with common equity plus Series A Convertible Preferred Stock, which carries a 6.0% cumulative dividend.
Economic Moat
Business Model
The robotic magnetic navigation system is the most defensible part of Stereotaxis’ model because it controls the working tip of a catheter with computer-driven magnetic fields, and I feel that a well-funded competitor would struggle to replicate that combination of hardware, software, and clinical workflow within 3 years. According to their SEC 10-K, the system is already used by hundreds of electrophysiologists at more than 100 hospitals globally, with over 150,000 arrhythmia patients treated and more than 500 clinical publications behind it, which gives the platform real clinical proof rather than a theoretical claim. GenesisX RMN, the latest generation robotic magnetic navigation system, is designed to reduce installation time, while Synchrony with SynX adds 4K display and cloud-based remote connectivity to modernize lab workflow. The installed base matters because the company sells disposables, service, and software into that base, so each placement can create recurring pull-through rather than a one-time equipment sale. I also view the patent portfolio as meaningful, with 43 issued U.S. patents and 3 pending U.S. patent applications as of December 31, 2025, and the key patents extending until 2028 and beyond, although patents alone do not stop a faster or cheaper alternative from emerging.
The business has shifted materially over the last five years. In 2022, the model was still centered on the older Niobe platform and a narrower product set; today, the company has GenesisX RMN, Synchrony, SynX, MAGiC, MAGiC Sweep, and the APT acquisition completed on July 31, 2024, which added the Map iT catheter portfolio and in-house catheter manufacturing capability. That change matters because the company is no longer only selling a capital system, but is trying to own more of the disposable catheter stack that sits around it. The 2025 filing also shows a more explicit push beyond electrophysiology into coronary, neuro, and peripheral indications, so the addressable use case is broader than it was in prior filings. On balance, the business is structurally stronger than 5 years ago because it has a wider product set, more internal catheter capability, and a clearer recurring revenue path, even though adoption still depends on long sales cycles, regulatory approvals, and hospital capital budgets.
Business & Operating Risks
The most material risk is funding: according to the risk factors in their SEC 10-K, Stereotaxis “may not generate cash from operations or be able to raise the necessary capital to continue operations.” The financial data already shows the strain, with TTM operating losses and negative cash flow, so this is not a theoretical concern. If the company keeps burning cash at the current pace, the risk is not just dilution but a forced slowdown in product development, sales coverage, and manufacturing support, which would directly weaken the equity case.
A second risk is customer adoption and reimbursement. The filing says hospital decision-makers may not purchase the robotic magnetic navigation systems or may view them as too expensive, while reimbursement for procedures using the products may be insufficient to recoup the costs of purchasing the systems. That mechanism matters because the system is a capital purchase that depends on hospital budgets, certificate-of-need approvals in some states, and physician willingness to change practice. The article’s operating data, including long sales cycles and uneven quarterly results, is consistent with that risk already affecting revenue timing rather than sitting in the background.
Supply chain and manufacturing risk is also concrete, not boilerplate. The company relies on contract manufacturers and, in some cases, a single supplier, and the magnets used in the robotic magnetic navigation system are sourced overseas, with tariffs, trade barriers, and logistics delays flagged as risks. That can hit both availability and cost, and the issue appears materialized rather than hypothetical. A modest interruption can delay installations and push revenue into later quarters, which is especially damaging for a company with variable sales cycles.
The APT acquisition adds a newer layer of execution risk. The current 10-K says Stereotaxis may be unable to successfully integrate APT and may fail to realize the expected benefits, while the earnout structure can create significant additional dilution and up to $24M in total value through September 30, 2029. That is a real cross-section issue because the MD&A growth plan depends on integrating APT and managing catheter manufacturing, so the risk language and operating strategy are aligned, not contradictory. In my view, these disclosed risks threaten the moat less than they threaten execution: the platform advantage is intact, but the cash burn and integration burden make it harder to monetize.
Management Discussion & Analysis
Management is signaling a capital-light, equity-funded path rather than balance-sheet repair, and that is the right response to the funding risk disclosed above even if it is not a clean answer. Cash and cash equivalents were $13.4M at December 31, 2025, while the company also had $46.9M remaining under its at-the-market program, a sales agreement that lets it issue common stock over time. That tells investors the near-term funding plan is dilution, not debt, which is workable for liquidity but not accretive to per-share value. The company also says the cash on hand should fund operations for at least 12 months, yet it is still relying on past equity raises and may use more stock sales, strategic collaborations, or even debt financings, so the narrative is survival and optionality rather than self-funding scale. On growth, management is leaning on product approvals and the APT acquisition: GenesisX received U.S. Food and Drug Administration 510(k) clearance in the fourth quarter of 2025, MAGiC catheter received FDA 510(k) clearance in January 2026, and system backlog was 78% of the backlog expected to convert in 2026. Those milestones support a better 2026 setup, but the backlog is still small relative to the company’s cost base, so I read the ramp as early proof of demand rather than evidence of durable scale. The biggest gap is that management highlights broader endovascular expansion and APT integration, yet gross margin was 53.0% in 2025 versus 54.0% in 2024 and operating cash outflow widened to $13.7M in 2025, which means the strategy is not yet translating into operating leverage.
In prior filings, management repeatedly framed the business around regulatory milestones and broader adoption, and the results have only partially matched that promise. In 2024, the company pointed to GenesisX and the APT acquisition as the next growth drivers; by 2025, revenue did rise 20% to $32.4M, but operating cash use also widened to $13.7M, so the top line improved faster than cash generation. The 2025 filing also implied that APT would deepen device innovation, and the 2026 filing confirms that with in-house catheter development, but the continued 100% valuation allowance on deferred tax assets and the need for repeated equity issuance show the business is still far from self-funding. Leadership continuity is stable: the current filing does not indicate a CEO or CFO change from the prior year, so there is no governance disruption to flag. The tone has been consistently optimistic across 2022 to 2025, but the numbers have remained uneven, with backlog at $9.1M in 2025 and cash at $13.4M in 2025 still forcing reliance on external capital. Management’s signals are a neutral to slightly bearish input for the investment thesis because the product roadmap is progressing, but dilution and weak cash conversion still dominate the financial reality.
Recent Events
The most significant development I see here is the April 14, 2026 agreement to acquire Robocath, a French robotic cardiology and neurointervention company, for $20M of upfront consideration plus up to $25M of earnouts. In my view, that strengthens the product and technology stack because it adds a European robotic platform and next-generation device pipeline, but it also tests the thesis because the deal is contingent on debt restructuring, French regulatory clearance, and closing by December 31, 2026.
The financing terms are just as important. Stereotaxis also agreed to provide interim funding through monthly Robocath bonds, with initial principal expected at about €1.3M, and the share issuance is capped at 19.9% of pre-closing stock without stockholder approval. That structure tells me management is willing to use equity-linked currency to buy growth, which can expand the addressable market if execution is clean, but it also raises dilution and integration risk before any FDA milestone or commercial milestone is earned.
The March 9 and May 12, 2026 filings were routine quarterly earnings releases, and the May 14, 2026 annual meeting simply re-elected directors and approved auditor ratification and say-on-pay. Taken together, the recent 8-Ks leave the investment case modestly stronger on strategic reach, but the Robocath transaction is the real signal and it is only constructive if the debt restructuring and closing conditions are completed.
Financial Analysis
Growth
STXS — Financial Growth (Quarterly, USD Mil)
| Metric | 2025-03-31 | 2025-06-30 | 2025-09-30 | 2025-12-31 | 2026-03-31 |
|---|---|---|---|---|---|
| REVENUE (USD Mil) | 7.5 | 8.8 | 7.5 | 8.6 | 6.3 |
| EBIT (USD Mil) | -5.9 | -4 | -6.6 | -5.6 | -6 |
| EBITDA (USD Mil) | -5.6 | -3.6 | -6.2 | -5.3 | -5.6 |
| NET INCOME (USD Mil) | -5.8 | -3.8 | -6.5 | -5.5 | -5.9 |
| DILUTED EPS | -0.1 | -0.1 | -0.1 | -0.1 | -0.1 |
Source: Yahoo Finance — Quarterly Financial Statements
Revenue moved unevenly across the last five quarters: $7.5M in Q1 2025, $8.8M in Q2 2025, $7.5M in Q3 2025, $8.6M in Q4 2025, then $6.3M in Q1 2026. That is a 15.8% decline in Q1 2026 versus Q1 2025, and it breaks the prior quarter’s rebound. EBITDA was $-5.6M in Q1 2026, flat with the prior year but still far below the level needed to absorb the fixed cost base, so the growth profile remains choppy rather than compounding. I do not see a clean explanation for the Q1 step-down in the figures here, which is worth flagging because the thesis depends on a steadier run rate.
Profitability
STXS — Profitability (TTM)
| Metric | TTM |
|---|---|
| Operating Margin (TTM) | -59.6% |
| Net Margin (TTM) | -74.2% |
| Return on Assets (TTM) | -25.4% |
| Return on Equity (TTM) | -184.3% |
| Gross Margin (TTM) | 55.6% |
| EBITDA Margin (TTM) | -60.1% |
Source: Yahoo Finance — Trailing Twelve Months (TTM)
TTM gross margin was 55.6%, but TTM operating margin was -59.6% and TTM EBITDA margin was -60.1%, so the business still loses far more below the gross profit line than it earns on product economics. That gap says the issue is not manufacturing cost alone; it is heavy operating expense and scale inefficiency, which is typical for an early commercial medical device company still funding sales, R&D, and market development. TTM net margin was -74.2%, which is worse than operating margin and shows that interest and other below-the-line items are adding to the loss rather than narrowing it. TTM return on assets was -25.4% and TTM return on equity was -184%, so capital is still being consumed rather than compounded; the huge ROE versus ROA gap also tells me leverage is amplifying weak equity returns rather than creating durable profitability. Investors should watch for operating margin moving toward positive territory and, more importantly, net margin closing the gap to operating margin, because that would show the company is finally converting gross profit into real earnings. For now, the profitability profile is a bear signal because margins and returns remain deeply negative with no visible path to sustained profitability.
Valuation
STXS — Valuation Multiples
| Metric | Value |
|---|---|
| Market Cap (USD Mil) | 137 |
| Enterprise Value (USD Mil) | 138 |
| Forward P/E | -8.9 |
| Price/Sales (TTM) | 4.6 |
| Price/Book (mrq) | 9.4 |
| EV/Revenue | 4.6 |
| EV/EBITDA | -7.7 |
| Beta (5Y Monthly) | 1.40 |
| FCF Yield % (TTM) | -6.4% |
| Forward EPS (USD) | -0.2 |
| Analyst Target Price – Low (USD) | 3.5 |
| Analyst Target Price – Mean (USD) | 4.1 |
| Analyst Target Price – High (USD) | 5 |
| # Analyst Opinions | 4 |
Source: Yahoo Finance
STXS trades at 4.6x EV/Revenue and 4.57x price/sales TTM, versus 1.4x and 1.6x for TCMD, 3.7x and 3.0x for AORT, 3.8x and 4.0x for ATRC, and 8.3x and 8.6x for PEN. That is not a cheap multiple for a company with negative revenue growth, negative FCF, and no earnings power yet. The negative forward P/E of -8.9x and negative EV/EBITDA of -7.65x are not valuation support; they simply reflect losses. I would put fair value in a range of roughly $0.4-$2.4 per share on the analysis here, using peer EV/Revenue as a guide and then adjusting for STXS’s weaker growth and leverage profile. That range sits below the $3.5-$5.0 analyst target band from 4 opinions, which tells me the sell-side consensus is more optimistic than I am about the speed of recovery. On a like-for-like basis, the implied forward EPS of -$0.155 is also weaker than AORT’s $0.8, ATRC’s $0.4, PEN’s $6.1, and TCMD’s $1.5, so STXS is not cheap relative to peers on earnings power; it is simply earlier in the cycle and still funding the build-out. The stock performance framing reinforces that point: a $1 investment a year ago would be worth $0.51 in STXS versus $0.68 in AORT, $1.25 in ATRC, $1.27 in PEN, $2.82 in TCMD, and $0.01 in RBOT, so the market has already punished the name for weak execution.
Leverage
STXS — Leverage & Coverage (Quarterly)
| Metric | Value |
|---|---|
| Total Debt/Equity % (mrq) | 29.6 |
| Current Ratio (mrq) | 1.4 |
| Total Debt (mrq, USD Mil) | 5.2 |
| Operating Cash Flow (TTM, USD Mil) | -15.3 |
| Levered Free Cash Flow (TTM, USD Mil) | -8.8 |
| Net Debt/EBITDA (TTM) | 0.3 |
| FCF Margin % (TTM) | -29.4% |
Source: Yahoo Finance — Quarterly Financial Statements
Total debt was $5.173M in mrq, and total debt to equity was 29.6% in mrq, so the capital structure is not heavily levered in absolute terms. Current ratio was 1.418x in mrq, which gives some near-term liquidity cushion, but it is not large enough to offset weak cash generation. Operating cash flow was negative $15.29M in TTM, levered free cash flow was negative $8.831M in TTM, and FCF margin was negative 29.37% in TTM, so EBITDA is not converting into cash and the business is still consuming liquidity. Net debt to EBITDA was 0.294x in TTM, which looks modest, but that is less reassuring when cash flow is negative and the company has $10.49M of cash mrq. In my opinion, this is not a refinancing story so much as a cash-burn story: the balance sheet is serviceable today, but the cushion erodes unless profitability improves.
Insider Activity
The insider transaction record I see here is one-sided: 3 open-market purchases and 0 open-market sales in the 2025-01-02 to 2026-01-02 window, with all buying concentrated in Director Isaac Paul J. Because the sample is limited to 16 Form 4 filings and only one insider transacted in the market, the signal is supportive but not broad-based. In my view, this is a bull signal because insiders were net open-market buyers and there were no offsetting sales.
Comparable Analysis
Growth
| Company | Revenue TTM (USD Mil) | Revenue Growth YoY % | EBITDA TTM (USD Mil) | Diluted EPS TTM |
|---|---|---|---|---|
| STXS | 30.1 | -12.8% | -18.1 | -0.2 |
| AORT | 471.5 | 11.3% | 63.7 | -0.1 |
| ATRC | 569.6 | 12.8% | 33.8 | 0.2 |
| PEN | 1,504.9 | 14.9% | 204.3 | 4.1 |
| TCMD | 350.3 | 8.6% | 41.7 | 1.1 |
| RBOT | — | — | -41.5 | -6.6 |
Source: Yahoo Finance
STXS revenue fell 12.8% YoY in the TTM period to $30.1M, while AORT grew 11.3% on $471.5M, ATRC grew 12.8% on $569.6M, PEN grew 14.9% on $1.5B, and TCMD grew 8.6% on $350.3M. That gap says STXS is not being rewarded for a growth premium, and the stock’s valuation would need a clear earnings inflection to justify even a peer-average multiple.
Valuation
| Company | Forward P/E | EV/Revenue | EV/EBITDA | Price/Sales (TTM) | Price/Book (mrq) | Market Cap (USD Mil) | Enterprise Value (USD Mil) | Beta (5Y Monthly) | FCF Yield % (TTM) | Forward EPS | Analyst Target Price – Low | Analyst Target Price – Mean | Analyst Target Price – High | # Analyst Opinions |
|---|---|---|---|---|---|---|---|---|---|---|---|---|---|---|
| STXS | -8.9 | 4.6 | -7.7 | 4.6 | 9.4 | 137 | 138 | 1.40 | -6.4% | -0.2 | 3.5 | 4.1 | 5 | 4 |
| AORT | 37.4 | 3.7 | 27.5 | 3 | 3.2 | 1,421 | 1,751 | 1.25 | 0.9% | 0.8 | 38 | 42 | 48 | 8 |
| ATRC | 102.6 | 3.8 | 64 | 4 | 4.4 | 2,253 | 2,160 | 1.23 | 2.2% | 0.4 | 36 | 47.3 | 55 | 9 |
| PEN | 53.3 | 8.3 | 60.9 | 8.6 | 8.4 | 12,881 | 12,435 | 0.70 | 1.2% | 6.1 | 323 | 361.8 | 374 | 12 |
| TCMD | 16.6 | 1.4 | 11.8 | 1.6 | 2.5 | 548 | 493 | 0.82 | 2.6% | 1.5 | 36 | 38.2 | 40 | 4 |
| RBOT | 0 | — | -0.1 | — | 0.1 | 0 | 4 | 1.92 | -5,408.0% | -2.2 | — | — | — | — |
Source: Yahoo Finance
STXS trades at 4.6x EV/Revenue and 4.6x price/sales, versus 1.4x and 1.6x for TCMD, 3.7x and 3.0x for AORT, 3.8x and 4.0x for ATRC, and 8.3x and 8.6x for PEN. Using the peer EV/Revenue range of 1.4x to 8.3x on STXS’s $30.1M revenue gives an implied EV of $42.5M to $248.4M, or roughly $0.4 to $2.4 per share after netting $10.5M cash and $5.2M debt against 99.6M shares. That range is below the $3.5-$5.0 analyst target band, so I think the market is already more skeptical than the consensus about how fast the recovery can arrive. On a growth-adjusted basis, STXS also looks expensive because its 4.6x EV/Revenue multiple is attached to negative growth, while AORT and ATRC trade at lower multiples despite positive revenue growth.
Profitability
| Company | Operating Margin (TTM) | Net Margin (TTM) | Return on Assets (TTM) | Return on Equity (TTM) | Gross Margin (TTM) | EBITDA Margin (TTM) |
|---|---|---|---|---|---|---|
| STXS | -59.6% | -74.2% | -25.4% | -184.3% | 55.6% | -60.1% |
| AORT | 9.0% | -0.7% | 2.6% | -0.7% | 64.4% | 13.5% |
| ATRC | 6.3% | 1.9% | 1.3% | 2.2% | 76.3% | 5.9% |
| PEN | 10.5% | 10.7% | 6.4% | 11.4% | 67.8% | 13.6% |
| TCMD | 8.0% | 7.1% | 7.9% | 11.9% | 76.8% | 11.9% |
| RBOT | 0.0% | 0.0% | -79.0% | -223.8% | — | — |
Source: Yahoo Finance
STXS gross margin is 55.6%, below AORT’s 64.4%, ATRC’s 76.3%, PEN’s 67.8%, and TCMD’s 76.8%, while its operating margin of -59.6%, net margin of -74.2%, and EBITDA margin of -60.1% are far worse than AORT’s 9.0%, -0.7%, and 13.5%, ATRC’s 6.3%, 1.9%, and 5.9%, PEN’s 10.5%, 10.7%, and 13.6%, and TCMD’s 8.0%, 7.1%, and 11.9%. Because the gross margin gap is large and the operating gap is even larger, this looks like both a cost-of-revenue problem and an opex scale problem, not just a temporary investment phase. The negative ROE of -184.3% and ROA of -25.4% also trail every profitable peer here, which confirms that STXS is still destroying capital while the others are at least compounding it.
Leverage
| Company | Total Debt/Equity % (mrq) | Current Ratio (mrq) | Total Debt (mrq, USD Mil) | Operating Cash Flow TTM (USD Mil) | Free Cash Flow TTM (USD Mil) | Net Debt/EBITDA (TTM) | FCF Margin % (TTM) |
|---|---|---|---|---|---|---|---|
| STXS | 29.6 | 1.4 | 5.2 | -15.3 | -8.8 | 0.3 | -29.4% |
| AORT | 91.6 | 3.5 | 408 | 41.7 | 13.1 | 5.2 | 2.8% |
| ATRC | 14.4 | 4.2 | 74.2 | 64.9 | 48.8 | -2.8 | 8.6% |
| PEN | 13.9 | 5.8 | 212.7 | 277.8 | 161.1 | -2.2 | 10.7% |
| TCMD | 6.4 | 4.1 | 14.4 | 30.6 | 14.5 | -1.3 | 4.1% |
| RBOT | 201.5 | 1.5 | 7.2 | -39.6 | -23.1 | -0.1 | — |
Source: Yahoo Finance
STXS has only 29.6% debt/equity, $5.2M of debt, and net debt/EBITDA of 0.3x, which is far lighter than AORT’s 91.6% debt/equity and 5.2x net debt/EBITDA, and lighter than TCMD’s 6.4% debt/equity and -1.3x net debt/EBITDA because STXS has little debt but also little cash generation. The problem is that STXS still posted -$15.3M of operating cash flow and -$8.8M of free cash flow in the TTM period, or about -$0.15 and -$0.09 per share, so the balance sheet is stable today but not a source of financing advantage. Relative to peers, the current ratio of 1.4x is also only middling, well below PEN’s 5.8x and ATRC’s 4.2x, which means STXS does not have the liquidity cushion that would justify a premium on safety.
Conclusion
The key tension is simple: STXS has a defensible robotic platform and a 55.6% gross margin, but the company is still not converting that into cash, and the market is already pricing in a recovery. I would keep the rating at Sell because the $8.8M levered free cash flow TTM and the $6.3M Q1 2026 revenue print tell me the operating base is still too fragile to support the current 4.6x EV/Revenue multiple.
I would raise my rating more towards a Buy if Q2 2026 revenue gets back above $8.8M, meaning the business has at least reclaimed its prior peak quarter and shown that GenesisX, MAGiC, and APT are feeding a steadier run rate. The cleaner confirmation would be free cash flow turning positive, because that would show the company is no longer funding growth with external capital. If operating margin also moves into positive territory, the thesis would improve materially because gross profit would finally be covering the cost structure rather than leaking away below it.
The bear case is more likely if Q2 and Q3 2026 stay below $6.3M and operating cash flow remains negative, because that would confirm the backlog of $9.1M is too small to offset the cost base. If the company keeps burning roughly $15M of operating cash over the next year, the $10.5M of cash on hand would be consumed quickly and the equity would need fresh funding before any meaningful operating leverage appears.
Weighing both paths, I lean to the bear case because the company still has to prove that product approvals and the APT integration can translate into sustained revenue, not just isolated quarters of improvement. The insider buying is a useful signal, but it is not enough to offset the combination of negative FCF, weak growth, and a 4.6x EV/Revenue multiple on a business that is still not self-funding.
What to Watch Next
- Q2 2026 revenue above $8.8M — would support a more constructive view.
- Operating margin turning positive — would show gross profit is covering operating expense.
- Free cash flow turning positive — would reduce dilution risk and extend runway.
- Quarterly revenue staying above $6.3M — would argue the Q1 dip was temporary.
- Robocath closing by December 31, 2026 — would validate the expansion strategy.
What’s your take? I rated Stereotaxis (STXS) SELL above — but the goal here is to get this right, not just to publish an opinion. What would you add to this analysis, or which risk or catalyst do you think I’m under- or over-weighting? Tell me in the comments.
Sources
- SEC 10-K Annual Report — filed 2026-03-12
- SEC 8-K Filing (2026-05-15)
- SEC 8-K Filing (2026-05-12)
- SEC 8-K Filing (2026-04-15)
- SEC 8-K Filing (2026-03-09)
- SEC Form 4 Insider Transaction (2026-04-13)
- SEC Form 4 Insider Transaction (2026-01-02)
- SEC Form 4 Insider Transaction (2026-01-02)
- SEC 10-K Annual Report — FY2026
- SEC 10-K Annual Report — FY2025
- SEC 10-K Annual Report — FY2024
- SEC 10-K Annual Report — FY2023
- SEC 10-K Annual Report — FY2022
Data sourced from Yahoo Finance and SEC EDGAR. Not investment advice.
Leave a Comment