
| Company | Sep 25 | Oct 25 | Nov 25 | Dec 25 | Jan 26 | Feb 26 | Mar 26 | Apr 26 | May 26 | Jun 26 | Jul 26 | Aug 26 | 12-Mo |
|---|---|---|---|---|---|---|---|---|---|---|---|---|---|
| ZTS | -6% | -1% | -11% | -2% | -0% | +5% | -10% | -2% | -32% | -8% | +8% | -0% | -50% |
| ELAN | +10% | +10% | +5% | -3% | +6% | +10% | -9% | -7% | +7% | +3% | +7% | -9% | +30% |
| PAHC | +10% | +4% | -0% | -11% | +7% | +36% | +2% | -4% | -42% | +2% | +16% | +4% | +3% |
| IDXX | -1% | -1% | +20% | -10% | -1% | -2% | -14% | -0% | +0% | -7% | +6% | -0% | -14% |
| NEOG | -1% | +8% | -3% | +17% | +46% | +10% | -17% | +1% | -5% | +0% | +34% | -4% | +101% |
| MRK | +1% | +2% | +22% | +1% | +5% | +12% | -2% | -9% | +9% | +9% | +1% | +13% | +82% |
Source: Yahoo Finance monthly adjusted close.
Quick Thesis
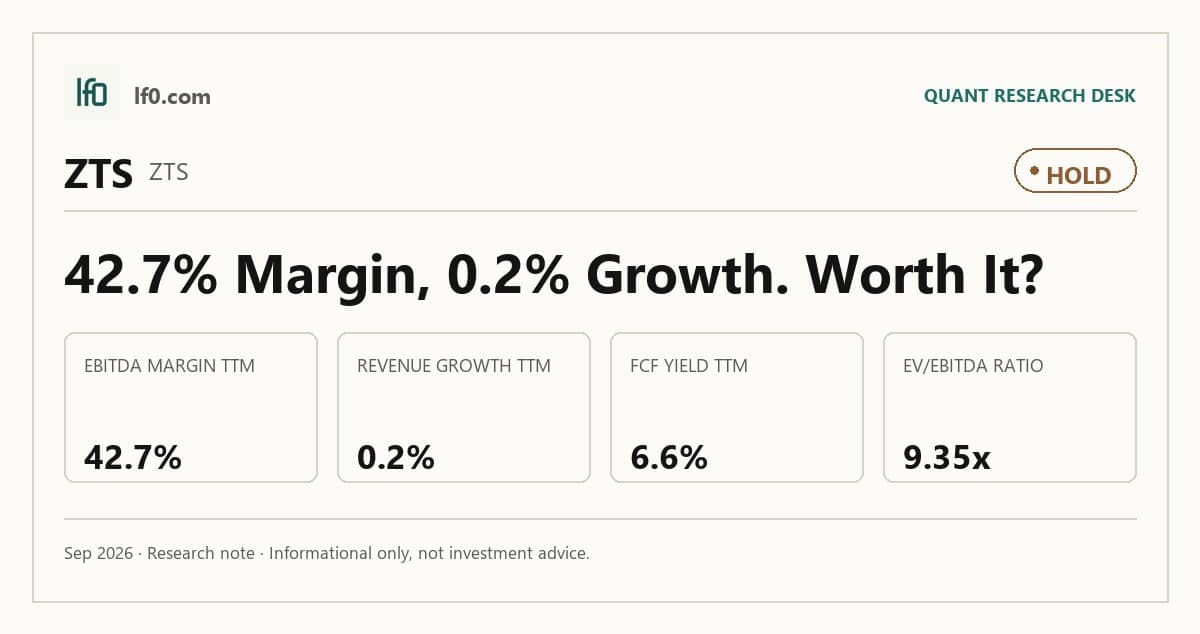
- Rated Hold — premium margins, but revenue growth is still flat.
- Strongest financial point: 42.7% TTM EBITDA margin and 6.6% TTM FCF yield.
- Main risk: 0.2% TTM revenue growth leaves little room for disappointment.
- Valuation is fair to slightly rich at 9.4x EV/EBITDA and 11.3x forward P/E.
- I would raise the rating if revenue growth turns positive for two to three quarters.
Executive Summary
Rating: HOLD | ZTS
Measured from adjusted close on 2026-09-15 to 2026-09-15. Sell ratings are correct when the stock falls; Hold is tracked as a +/-10% range. Daily-close data, not intraday. Calls are tracked for 182 days from publication, then frozen as a final record.
I would put my rating as a Hold because Zoetis has the margins and cash generation of a premium animal-health franchise, but the top line is not yet proving that the current valuation deserves a clear re-rating. TTM revenue was $9.5B, TTM net margin was 27.7%, and FCF yield was 6.6%, so the business is still converting sales into cash at a level that supports the share price; the issue is that TTM revenue was down 0.2%, which tells me the market is already paying for quality before growth has re-accelerated.
I would raise my rating more towards a Buy if revenue growth turns positive for two to three consecutive quarters and TTM revenue moves back above $9.6B, roughly the level that would show the 2025 mix shift is translating into real demand rather than just a timing benefit. If that happens while EBITDA margin stays near 42.7%, the company would add about about $100M of annual EBITDA for every 1.0% of margin expansion on the current $9.5B revenue base, which would strengthen the case for multiple expansion without needing a heroic growth assumption.
Company Profile
Zoetis develops, manufactures, and commercializes medicines, vaccines, diagnostics, biodevices, genetic tests, and precision animal health services for companion animals and livestock. Revenue comes mainly from parasiticides, vaccines, dermatology, anti-infectives, pain and sedation, other pharmaceuticals, and diagnostics, with companion animals generating $6.6B of 2025 revenue and livestock $2.8B. The company was spun out of Pfizer in 2012 and now sells into more than 100 countries, directly markets products in about 45 countries, and operates across the United States and International segments.
That geographic spread matters because it gives Zoetis a broad commercial base, but the business is still anchored in a few high-value channels and species. In my view, the mix is more attractive than a decade ago because it is less dependent on lower-value livestock products and more tied to recurring pet-health demand.
Economic Moat
Business Model
Zoetis’ broadest edge is its portfolio depth across approximately 300 product lines, because that breadth lets it sell medicines, vaccines, diagnostics, biodevices, and genetic tests across eight core species in more than 100 countries. I feel that is hard for a well-funded competitor to replicate quickly because it would require building a comparable regulatory, manufacturing, and commercial footprint, not just launching one product. The company’s U.S. and International split also reduces dependence on a single market, and the installed relationship with veterinarians and distributors supports scale access.
The moat looks stronger than it did a few years ago because the portfolio has shifted toward higher-value companion animal categories. That shift is consistent with the company’s broader pricing power and recurring demand profile, which is the structural advantage I think investors should focus on.
Business & Operating Risks
The most material disclosed risk is generic erosion of Draxxin, because the filing gives a concrete example of how exclusivity loss can reset an established franchise: since 2021, the first year of generic competition, U.S. Draxxin sales declined by 66%. That is not a theoretical patent-cliff risk. It shows that once a Zoetis product loses protection, revenue can fall sharply and quickly.
Manufacturing and supply are the second major risk. The filing warns that temperature excursions, improper package sealing, and other production interruptions can lead to delays, inventory shortages, recalls, and regulatory action. Zoetis also disclosed $68M of inventory provision expense in 2025 and $47M of asset write-offs and impairments in 2025, which tells me the operating friction is already visible in the numbers.
Channel power shifting toward internet retailers, big-box stores, and other over-the-counter outlets is another headwind. Zoetis says that shift could pressure margins because retailers have greater purchasing power than traditional veterinary practices, and it could also push customers toward generic or lower-cost substitutes. That risk does not break the moat, but it does threaten the pricing discipline that helps the moat earn its returns.
Tax and balance-sheet complexity add a fourth layer. Zoetis disclosed $221M of gross unrecognized tax benefits and an IRS proposed adjustment of about $450M, excluding interest and penalties, while ending 2025 with $9.3B of total debt. The risks do not directly undermine the portfolio breadth moat, but they do pressure the cash conversion that is supposed to make that moat valuable.
Management Discussion & Analysis
Management appears to be responding to the mix and channel risks by leaning further into diagnostics and higher-value animal health categories, but the current MD&A excerpt does not show a fresh capital-allocation move that would materially change the thesis. The divestiture of medicated feed additives and the acquisition of Veterinary Pathology Group point in the right direction, yet the filing does not show a new operating step that offsets the slower growth profile on its own.
That matters because the moat is intact, but management still has to prove that the portfolio shift can translate into faster reported growth rather than just a cleaner mix. I would want to see that in the numbers before giving full credit for the strategic repositioning.
Recent Events
The most important recent development is the May 20, 2026 annual meeting, where shareholders elected all 12 directors, approved the named executive officer pay program, and backed annual say-on-pay votes. That reinforces board continuity and keeps compensation oversight on a yearly cycle, which supports governance stability rather than signaling a strategic reset.
I also view the retirement of Louise M. Parent from the board, effective May 20, 2026, as orderly refreshment rather than disruption. The dividend actions are more important for capital allocation: Zoetis declared a $0.53 per share dividend for Q2 2026 on February 5, 2026 and repeated the same payout for Q3 2026 on May 20, 2026. In my view, that steady cadence signals management is still comfortable returning cash while preserving flexibility.
Financial Analysis
Growth
ZTS — Financial Growth (Quarterly, USD Mil)
| Metric | 2025-06-30 | 2025-09-30 | 2025-12-31 | 2026-03-31 | 2026-06-30 |
|---|---|---|---|---|---|
| REVENUE (USD Mil) | 2,474 | 2,400 | 2,387 | 2,262 | 2,468 |
| EBIT (USD Mil) | 965 | 945 | 818 | 820 | 927 |
| EBITDA (USD Mil) | 1,089 | 1,068 | 939 | 939 | 1,046 |
| NET INCOME (USD Mil) | 726 | 721 | 603 | 601 | 691 |
| DILUTED EPS | 1.6 | 1.6 | 1.4 | 1.4 | 1.6 |
Source: Yahoo Finance — Quarterly Financial Statements
Zoetis’ revenue was $2.5B in Q2 2025, $2.4B in Q3 2025, $2.4B in Q4 2025, $2.3B in Q1 2026, and $2.5B in Q2 2026, so the top line was broadly flat before a modest rebound. EBITDA followed the same pattern, easing from $1.1B in mid-2025 to $939M in Q4 2025 and Q1 2026 before recovering to $1B in Q2 2026. That tells me the business is stable, but it is not yet showing the kind of acceleration that would justify a higher multiple on growth alone.
Profitability
ZTS — Profitability (TTM)
| Metric | TTM |
|---|---|
| Operating Margin (TTM) | 40.7% |
| Net Margin (TTM) | 27.7% |
| Return on Assets (TTM) | 15.4% |
| Return on Equity (TTM) | 64.9% |
| Gross Margin (TTM) | 71.7% |
| EBITDA Margin (TTM) | 42.7% |
Source: Yahoo Finance — Trailing Twelve Months (TTM)
Zoetis’ profitability profile is already mature: TTM gross margin was 71.7%, EBITDA margin was 42.7%, operating margin was 40.7%, and net margin was 27.7%. The gap between gross and operating margin shows that overhead still absorbs a meaningful share of revenue, but the company is converting most of its gross profit into operating profit, which is exactly what a scaled animal-health franchise should do.
Returns are also strong, with TTM ROA at 15.4% and TTM ROE at 64.9%. The wide ROE-to-ROA spread means leverage is amplifying equity returns, so I would watch cash generation alongside the headline ROE. This profitability profile is the clearest support for the moat described above.
Valuation
ZTS — Valuation Multiples
| Metric | Value |
|---|---|
| Market Cap (USD Mil) | 30,442 |
| Enterprise Value (USD Mil) | 38,021 |
| Trailing P/E | 12 |
| Forward P/E | 11.3 |
| Price/Sales (TTM) | 3.2 |
| Price/Book (mrq) | — |
| EV/Revenue | 4 |
| EV/EBITDA | 9.4 |
| Beta (5Y Monthly) | 0.73 |
| FCF Yield % (TTM) | 6.6% |
| Forward EPS (USD) | 6.5 |
| Analyst Target Price – Low (USD) | 80 |
| Analyst Target Price – Mean (USD) | 96 |
| Analyst Target Price – High (USD) | 155 |
| # Analyst Opinions | 15 |
Source: Yahoo Finance
Zoetis screens as a quality-growth valuation, not a deep-value name. EV/Revenue is 4.0x, EV/EBITDA is 9.4x, trailing P/E is 12.0x, and forward P/E is 11.3x, which says the market is paying for durable earnings power and cash conversion rather than for rapid top-line growth. FCF yield is 6.6%, a solid cash return for a business with 21.2% FCF margin and 0.73 beta.
On my read, fair value sits in a range of roughly $80–$155 per share, which is the same band implied by the analyst target range and the peer multiple spread. That range sits inside the $80–$155 analyst consensus, with a $96 mean, so I do not need to fight the Street to justify the stock as fairly valued. Forward EPS is 6.5, which is rich relative to peers with weaker margins and lower cash conversion, but not cheap enough to call the shares a clear bargain given the flat growth profile.
Leverage
ZTS — Leverage & Coverage (Quarterly)
| Metric | Value |
|---|---|
| Total Debt/Equity % (mrq) | 294 |
| Current Ratio (mrq) | 3.1 |
| Total Debt (mrq, USD Mil) | 9,255 |
| Operating Cash Flow (TTM, USD Mil) | 2,840 |
| Levered Free Cash Flow (TTM, USD Mil) | 2,017 |
| Net Debt/EBITDA (TTM) | 1.9 |
| FCF Margin % (TTM) | 21.2% |
Source: Yahoo Finance — Quarterly Financial Statements
Zoetis has a manageable balance sheet, but leverage is not trivial. Total debt/equity is 294.0%, current ratio is 3.1, and total debt is $9.3B, so the company is not lightly levered even though near-term liquidity is comfortable. Net debt/EBITDA is 1.9x and levered free cash flow is $2B, which tells me the debt load is supported by real cash generation rather than just accounting earnings.
That leverage profile matters because it limits how much room the company has if generic erosion or channel pressure hits margins at the same time. In other words, the balance sheet is fine, but it does not give management unlimited time to wait for growth to recover.
Insider Activity
The latest insider record shows net buying in the open market, with director purchases from Frank A. Damelio, Paul Bisaro, and Michael B. McCallister in May 2026. That is supportive, but it is narrow because the broader sample still shows more sales than purchases. I read that as a neutral-to-slightly-positive signal rather than a strong conviction indicator.
Comparable Analysis
Growth
| Company | Revenue TTM (USD Mil) | Revenue Growth YoY % | EBITDA TTM (USD Mil) | Diluted EPS TTM |
|---|---|---|---|---|
| ZTS | 9,525 | -0.2% | 4,066 | 6.1 |
| ELAN | 5,020 | 10.2% | 1,007 | -0.4 |
| PAHC | 1,518.1 | 4.8% | 244.2 | 2.4 |
| IDXX | 4,553.2 | 9.7% | 1,621.7 | 14.2 |
| NEOG | 870.4 | -0.1% | 94.7 | 0 |
| MRK | 66,569 | 5.1% | 28,871 | 1.2 |
Source: Yahoo Finance
Zoetis’ revenue fell 0.2% in TTM, while ELAN grew 10.2%, PAHC 4.8%, IDXX 9.7%, and MRK 5.1%, with only NEOG close at -0.1%. That means ZTS is paying a premium for a flat top line, so the growth multiple is only defensible if investors are underwriting a rebound that has not shown up yet.
Valuation
| Company | Trailing P/E | Forward P/E | EV/Revenue | EV/EBITDA | Price/Sales (TTM) | Price/Book (mrq) | Market Cap (USD Mil) | Enterprise Value (USD Mil) | Beta (5Y Monthly) | FCF Yield % (TTM) | Forward EPS | Analyst Target Price – Low | Analyst Target Price – Mean | Analyst Target Price – High | # Analyst Opinions |
|---|---|---|---|---|---|---|---|---|---|---|---|---|---|---|---|
| ZTS | 12 | 11.3 | 4 | 9.4 | 3.2 | — | 30,442 | 38,021 | 0.73 | 6.6% | 6.5 | 80 | 96 | 155 | 15 |
| ELAN | — | 18 | 3 | 15.2 | 2.3 | 1.8 | 11,562 | 15,269 | 1.68 | 7.1% | 1.3 | 26 | 31.2 | 34 | 14 |
| PAHC | 14.8 | 9.3 | 1.4 | 8.9 | 1 | 3.8 | 1,459 | 2,171 | 0.47 | -1.3% | 3.9 | 35 | 44 | 55 | 5 |
| IDXX | 35.8 | 30.4 | 9 | 25.3 | 8.8 | 24.9 | 40,144 | 41,043 | 1.54 | 2.3% | 16.7 | 470 | 698.9 | 805 | 13 |
| NEOG | — | 31.4 | 3.7 | 34.1 | 3 | 1.2 | 2,606 | 3,233 | 1.76 | 2.7% | 0.4 | 12 | 13.3 | 14 | 3 |
| MRK | 115.9 | 15.2 | 6.1 | 14 | 5.4 | 8.5 | 357,370 | 404,191 | 0.23 | 4.2% | 9.6 | 105 | 153 | 186 | 26 |
Source: Yahoo Finance
ZTS trades at 4.0x EV/Revenue, 12.0x trailing P/E, 11.3x forward P/E, and a 6.6% FCF yield. ELAN is cheaper on EV/Revenue at 3.0x but has a 7.1% FCF yield, PAHC is at 1.4x but with negative FCF yield, IDXX is far richer at 9.0x, and MRK is at 6.1x. I feel the market is paying ZTS for margin durability and cash conversion, not for growth, and that is why the stock looks fair rather than cheap.
Profitability
| Company | Operating Margin (TTM) | Net Margin (TTM) | Return on Assets (TTM) | Return on Equity (TTM) | Gross Margin (TTM) | EBITDA Margin (TTM) |
|---|---|---|---|---|---|---|
| ZTS | 40.7% | 27.7% | 15.4% | 64.9% | 71.7% | 42.7% |
| ELAN | 8.6% | -4.0% | 1.6% | -3.0% | 55.4% | 20.1% |
| PAHC | 10.6% | 6.6% | 8.5% | 29.7% | 33.3% | 16.1% |
| IDXX | 35.0% | 25.0% | 27.1% | 74.2% | 62.5% | 35.6% |
| NEOG | 1.4% | -0.9% | -0.4% | -0.4% | 46.9% | 10.9% |
| MRK | -0.2% | 4.8% | 11.9% | 7.0% | 75.9% | 43.4% |
Source: Yahoo Finance
ZTS posts a 71.7% gross margin, 42.7% EBITDA margin, 40.7% operating margin, and 27.7% net margin, ahead of ELAN, PAHC, and NEOG on every major line, while IDXX is the only peer with clearly stronger economics. The gap looks structural rather than cyclical because ZTS combines high gross margin with a much wider operating margin than most peers, which says the model is not just cheaper to produce but also better scaled on overhead.
Leverage
| Company | Total Debt/Equity % (mrq) | Current Ratio (mrq) | Total Debt (mrq, USD Mil) | Operating Cash Flow TTM (USD Mil) | Free Cash Flow TTM (USD Mil) | Net Debt/EBITDA (TTM) | FCF Margin % (TTM) |
|---|---|---|---|---|---|---|---|
| ZTS | 294 | 3.1 | 9,255 | 2,840 | 2,017 | 1.9 | 21.2% |
| ELAN | 64.3 | 2 | 4,233 | 617 | 826.9 | 3.7 | 16.5% |
| PAHC | 206.4 | 3 | 795.6 | 69 | -19.3 | 2.9 | -1.3% |
| IDXX | 68 | 1.2 | 1,096.1 | 1,371.5 | 909.4 | 0.6 | 20.0% |
| NEOG | 38.8 | 3.8 | 812.6 | 83.2 | 69.5 | 6.6 | 8.0% |
| MRK | 128.4 | 1.3 | 53,911 | 19,967 | 15,171.5 | 1.6 | 22.8% |
Source: Yahoo Finance
ZTS has 294.0% debt/equity and 1.9x net debt/EBITDA, versus ELAN at 64.3% and 3.7x, PAHC at 206.4% and 2.9x, IDXX at 68.0% and 0.6x, NEOG at 38.8% and 6.6x, and MRK at 128.4% and 1.6x. The cleaner read is net debt/EBITDA: ZTS is more levered than IDXX and MRK but far safer than NEOG, while its 21.2% FCF margin and $2B of TTM free cash flow show the balance sheet is being supported by real cash generation.
Conclusion
The tension here is simple: Zoetis has premium margins and strong cash generation, but the revenue line is still not proving that the current valuation deserves a higher multiple. TTM revenue was $9.5B, TTM net margin was 27.7%, and FCF yield was 6.6%, so the business is still converting sales into cash at a level that supports the stock; the problem is that TTM revenue was down 0.2%, which tells me the market is already paying for quality before growth has re-accelerated.
I would raise my rating more towards a Buy if revenue growth turns positive for two to three consecutive quarters and TTM revenue moves back above $9.6B, roughly the level that would show the 2025 mix shift is translating into real demand rather than just a timing benefit. If that happens while EBITDA margin stays near 42.7%, the company would add about about $100M of annual EBITDA for every 1.0% of margin expansion on the current $9.5B revenue base, which would strengthen the case for multiple expansion without needing a heroic growth assumption.
I would move from Hold to Sell if TTM revenue slips below $9.2B, which would mean the business is losing more than 3.0% of sales from the current base, or if net margin falls back toward the low 20s, because that would show the current profitability profile is not holding up under channel pressure and generic erosion. A second warning line would be FCF yield dropping below 5.0%, since that would tell me the cash return is no longer enough to justify paying a premium multiple for a slower-growing franchise.
Weighing both paths, I lean to the Hold case because Zoetis still has the better balance sheet and profitability profile than most animal-health peers, but the market is already paying for that quality. I would rather wait for a clean quarter or two of renewed revenue growth than chase the stock on margin strength alone.
What to Watch Next
- Revenue growth above 0% for two to three quarters — would support a move toward Buy.
- TTM revenue above $9.6B — would show the mix shift is becoming real demand.
- EBITDA margin near 42.7% — would confirm the earnings base is still expanding.
- Net margin in the low 20s or worse — would argue for a downgrade toward Sell.
- FCF yield below 5.0% — would weaken the case for paying a premium multiple.
What’s your take? I rated Zoetis (ZTS) HOLD above — but the goal here is to get this right, not just to publish an opinion. What would you add to this analysis, or which risk or catalyst do you think I’m under- or over-weighting? Tell me in the comments.
Sources
- SEC 10-K Annual Report — filed 2026-02-12
- SEC 8-K Filing (2026-05-22)
- SEC 8-K Filing (2026-05-20)
- SEC 8-K Filing (2026-05-07)
- SEC 8-K Filing (2026-02-12)
- SEC 8-K Filing (2026-02-05)
- SEC Form 4 Insider Transaction (2026-05-26)
- SEC Form 4 Insider Transaction (2026-05-21)
- SEC Form 4 Insider Transaction (2026-05-13)
- SEC 10-K Annual Report — FY2026
- SEC 10-K Annual Report — FY2025
- SEC 10-K Annual Report — FY2024
- SEC 10-K Annual Report — FY2023
- SEC 10-K Annual Report — FY2022
Data sourced from Yahoo Finance and SEC EDGAR. Not investment advice.
Leave a Comment