
| Company | Aug 25 | Sep 25 | Oct 25 | Nov 25 | Dec 25 | Jan 26 | Feb 26 | Mar 26 | Apr 26 | May 26 | Jun 26 | Jul 26 | 12-Mo |
|---|---|---|---|---|---|---|---|---|---|---|---|---|---|
| LNTH | -23% | -7% | +12% | +2% | +13% | +1% | +12% | +1% | +12% | +17% | +12% | -10% | +40% |
| TLX | -30% | +0% | +11% | -7% | -25% | -3% | -0% | +32% | +15% | -14% | +22% | -14% | -27% |
| GEHC | +3% | +2% | -0% | +7% | +3% | -4% | +7% | -16% | -14% | +2% | +3% | +6% | -4% |
| NTRA | +26% | -4% | +24% | +20% | -4% | +1% | -10% | -4% | +3% | +8% | +22% | -1% | +100% |
| QGEN | -6% | -4% | +5% | +2% | -6% | +19% | -7% | -20% | -14% | +6% | +7% | +7% | -15% |
| GH | +65% | -7% | +49% | +17% | -6% | +12% | -18% | -2% | -6% | +49% | +16% | +8% | +295% |
Source: Yahoo Finance monthly adjusted close.
Quick Thesis
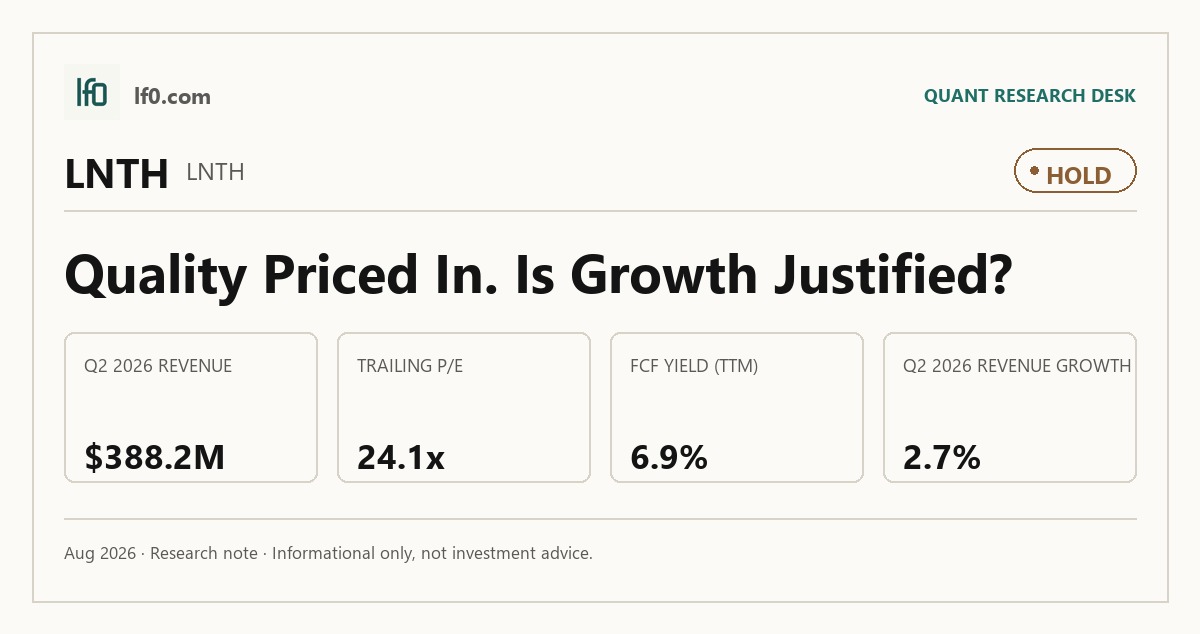
- Rated Hold — profitable and cash-generative, but growth is too uneven for a higher multiple.
- Strongest financial point: 29.0% TTM FCF margin and 0.08x net debt/EBITDA.
- Main risk: quarterly revenue was only 388.2M in Q2 2026, with choppy sequential growth.
- Valuation is fair to slightly rich at 24.1x trailing P/E and 16.9x EV/EBITDA.
- I would raise the rating if quarterly revenue holds above 400M and operating margin stays above 25.0%.
Executive Summary
Rating: HOLD | LNTH
Measured from adjusted close on 2026-08-18 to 2026-10-01. Sell ratings are correct when the stock falls; Hold is tracked as a +/-10% range. Daily-close data, not intraday. Calls are tracked for 182 days from publication, then frozen as a final record.
I would put my rating as a Hold because Lantheus combines high margins and strong cash conversion with a revenue path that is still too uneven to support a higher multiple. TTM free cash flow margin is 29.0% and net debt/EBITDA is 0.08x, so the balance sheet is not the problem; the issue is that quarterly revenue only reached 388.2M in Q2 2026 after a 406.8M peak in Q4 2025. In my view, the market is already paying for quality at 24.1x trailing P/E and 16.9x EV/EBITDA, so I need steadier top-line execution before I would move more constructive. I would raise my rating more towards a Buy if quarterly revenue holds above 400M and operating margin stays above 25.0%, because that would show the earnings base is holding after the portfolio reshaping.
Company Profile
Lantheus develops and commercializes radiopharmaceutical diagnostics and related products, with PYLARIFY as the core commercial engine and a broader portfolio that includes precision diagnostics and newer pipeline assets. The business earns revenue from imaging agents, strategic partnerships, and other product sales, so its economics depend on both product adoption and reimbursement support. That mix gives the company exposure to a growing molecular imaging market, but it also makes execution on pricing, supply, and launch timing central to the investment case.
Economic Moat
Business Model
Lantheus’ moat rests on a specialized radiopharmaceutical platform that is hard to replicate quickly because it combines product approval, manufacturing logistics, and reimbursement access. PYLARIFY is the anchor asset, and the company’s network of positron emission tomography manufacturing facilities supports just-in-time delivery for a product with a short half-life, which is a real operational barrier rather than a generic scale advantage. I also think the portfolio is becoming more durable as management adds newer agents and precision diagnostics, because that broadens the revenue base beyond a single product cycle.
Business & Operating Risks
The biggest disclosed risk is reimbursement pressure on PYLARIFY, because the product’s economics now depend on coding, coverage, and payment after TPT Status expired on December 31, 2024. The company also faces generic-entry risk as its five-year new chemical entity exclusivity expires on May 26, 2026, and an ANDA or 505(b)(2) filing could trigger litigation that delays launch, but the key distinction is that filing risk is immediate while launch risk depends on whether a stay is actually imposed. Supply-chain and PMF qualification risk remains material because the business relies on approved manufacturing sites and short-lived isotopes, so any bottleneck can interrupt volume. In my view, these risks do threaten the moat, but they threaten the reimbursement and manufacturing advantages around PYLARIFY more than the broader radiopharmaceutical platform itself.
Management Discussion & Analysis
Management is responding to those risks by simplifying the portfolio, expanding manufacturing flexibility, and pushing new launches, but the numbers show that the response is still in progress. The SPECT business sale, the 2025 buybacks, and the 2022 Revolving Facility expansion to $750M all point to a stronger capital structure and more focus on higher-return assets, yet the company still spent heavily on acquisitions and development while revenue growth stayed modest. That tells me management is actively defending the moat, but it has not yet proven to me that the new mix can offset reimbursement pressure and generic timing risk.
Recent Events
The most important recent event was the shareholder-approved governance reset in April 2026, which declassified the board over three years and moved say-on-pay to an annual vote. I view that as a modest governance improvement, but the 2.0 million-share expansion of the 2026 Equity Incentive Plan also means dilution remains part of the story. The May 2026 business update was routine rather than transformative, so recent filings have not changed the structural thesis: the moat is still intact, but it is being tested by reimbursement and product-cycle pressure.
Financial Analysis
Growth
LNTH — Financial Growth (Quarterly, USD Mil)
| Metric | 2025-06-30 | 2025-09-30 | 2025-12-31 | 2026-03-31 | 2026-06-30 |
|---|---|---|---|---|---|
| REVENUE (USD Mil) | 378 | 384 | 406.8 | 377.3 | 388.2 |
| EBIT (USD Mil) | 109.4 | 47.3 | 75.4 | 161.3 | 98.7 |
| EBITDA (USD Mil) | 122.7 | 67.7 | 98.3 | 184 | 121.3 |
| NET INCOME (USD Mil) | 78.8 | 27.8 | 54.1 | 118.4 | 75 |
| DILUTED EPS | 1.1 | 0.4 | 0.8 | 1.8 | 1.1 |
Source: Yahoo Finance — Quarterly Financial Statements
Revenue was 378M in Q2 2025, 384M in Q3 2025, 406.8M in Q4 2025, 377.3M in Q1 2026, and 388.2M in Q2 2026. That is only 2.7% growth from Q2 2025 to Q2 2026, and the quarter-to-quarter pattern is choppy enough that I would not call this a clean growth story. EBITDA moved from 122.7M in Q2 2025 to 121.3M in Q2 2026, so the business is holding profitability, but it is not accelerating in a way that would justify a faster multiple expansion.
Profitability
LNTH — Profitability (TTM)
| Metric | TTM |
|---|---|
| Operating Margin (TTM) | 25.8% |
| Net Margin (TTM) | 17.7% |
| Return on Assets (TTM) | 8.4% |
| Return on Equity (TTM) | 22.2% |
| Gross Margin (TTM) | 60.1% |
| EBITDA Margin (TTM) | 25.2% |
Source: Yahoo Finance — Trailing Twelve Months (TTM)
TTM gross margin was 60.1%, operating margin was 25.8%, EBITDA margin was 25.2%, net margin was 17.7%, return on assets was 8.4%, and return on equity was 22.2%. Those are strong figures, and they matter because they show the company is converting a specialized product mix into real earnings rather than just revenue. The gap between ROE and ROA also tells me returns are being supported by a sensible capital structure, which fits the low-net-debt profile and the moat described above. The key threshold I am watching is operating margin staying above 25.0%, meaning the core earnings engine remains intact after the portfolio changes.
Valuation
LNTH — Valuation Multiples
| Metric | Value |
|---|---|
| Market Cap (USD Mil) | 6,587 |
| Enterprise Value (USD Mil) | 6,618 |
| Trailing P/E | 24.1 |
| Forward P/E | 16 |
| Price/Sales (TTM) | 4.2 |
| Price/Book (mrq) | 5.4 |
| EV/Revenue | 4.3 |
| EV/EBITDA | 16.9 |
| Beta (5Y Monthly) | -0.03 |
| FCF Yield % (TTM) | 6.9% |
| Forward EPS (USD) | 6.3 |
| Analyst Target Price – Low (USD) | 102.5 |
| Analyst Target Price – Mean (USD) | 107 |
| Analyst Target Price – High (USD) | 115 |
| # Analyst Opinions | 10 |
Source: Yahoo Finance
Lantheus trades at 24.1x trailing P/E, 16x forward P/E, 4.2x price/sales, 4.3x EV/revenue, and 16.9x EV/EBITDA, with a 6.9% TTM FCF yield. In my view, that is a fair-to-slightly-rich valuation for a business with strong margins and a clean balance sheet, but not one I would call cheap. On the analysis here, I would put fair value in a range of roughly $95–$115 per share, which sits around the analyst mean target of $107 and inside the $102.5–$115 consensus range from 10 opinions. Forward EPS of 6.3 looks solid versus peers such as GEHC at 5.4 and QGEN at 2.6, but I do not think the market is underestimating that earnings power; it is already paying for it. The valuation case is therefore balanced: the cash yield and leverage profile support the stock, yet the current multiple already reflects much of that quality.
Leverage
LNTH — Leverage & Coverage (Quarterly)
| Metric | Value |
|---|---|
| Total Debt/Equity % (mrq) | 47.6 |
| Current Ratio (mrq) | 3.1 |
| Total Debt (mrq, USD Mil) | 625 |
| Operating Cash Flow (TTM, USD Mil) | 412.8 |
| Levered Free Cash Flow (TTM, USD Mil) | 451.7 |
| Net Debt/EBITDA (TTM) | 0.1 |
| FCF Margin % (TTM) | 29.0% |
Source: Yahoo Finance — Quarterly Financial Statements
Total debt was $625M, total debt/equity was 47.6%, current ratio was 3.1x, operating cash flow was $412.8M, levered free cash flow was $451.7M, net debt/EBITDA was 0.08x, and FCF margin was 29.0%. That is a very strong balance sheet, and I think net debt/EBITDA is the more important lens here because cash nearly offsets debt. The leverage profile matters across the thesis: it gives management room to fund launches and absorb reimbursement pressure, but it also means the stock’s upside now depends more on growth and margin execution than on financial repair.
Insider Activity
The insider record is one-sided, with 0 open-market purchases and 12 open-market sales totaling $8.3M over the last year. Mary Anne Heino’s 3,140-share sale at $74.90 is not large on its own, but the broader pattern is still directional. I read that as a mild bear signal on alignment, especially because the shares have already rerated strongly over the past year.
Comparable Analysis
Growth
| Company | Revenue TTM (USD Mil) | Revenue Growth YoY % | EBITDA TTM (USD Mil) | Diluted EPS TTM |
|---|---|---|---|---|
| LNTH | 1,556.3 | 2.7% | 392.2 | 4.2 |
| TLX | 803.8 | 49.3% | 32.5 | 0 |
| GEHC | 21,266 | 5.8% | 3,593 | 4.3 |
| NTRA | 2,707.1 | 37.7% | -224.4 | -1.4 |
| QGEN | 2,100.4 | 0.3% | 734.2 | 2 |
| GH | 1,183.1 | 44.3% | -430.6 | -3.5 |
Source: Yahoo Finance
LNTH’s 2.7% TTM revenue growth trails TLX at 49.3%, NTRA at 37.7%, and GH at 44.3%, while GEHC is at 5.8% and QGEN is essentially flat at 0.3%. That puts Lantheus in the middle of the group on growth, but closer to the mature diagnostics names than to the faster-growing molecular peers. The implication is straightforward: the stock deserves some premium for profitability, yet not a growth multiple that assumes a major acceleration.
Valuation
| Company | Trailing P/E | Forward P/E | EV/Revenue | EV/EBITDA | Price/Sales (TTM) | Price/Book (mrq) | Market Cap (USD Mil) | Enterprise Value (USD Mil) | Beta (5Y Monthly) | FCF Yield % (TTM) | Forward EPS | Analyst Target Price – Low | Analyst Target Price – Mean | Analyst Target Price – High | # Analyst Opinions |
|---|---|---|---|---|---|---|---|---|---|---|---|---|---|---|---|
| LNTH | 24.1 | 16 | 4.3 | 16.9 | 4.2 | 5.4 | 6,587 | 6,618 | -0.03 | 6.9% | 6.3 | 102.5 | 107 | 115 | 10 |
| TLX | — | 63.9 | 5.3 | 132.4 | 4.9 | 9.6 | 3,974 | 4,299 | 0.60 | -0.9% | 0.2 | 19.9 | 21.2 | 22.4 | 4 |
| GEHC | 16.7 | 13.4 | 1.9 | 11.5 | 1.5 | 3 | 32,921 | 41,394 | 0.82 | 4.8% | 5.4 | 70 | 82.5 | 96 | 18 |
| NTRA | — | -2,825.4 | 16.4 | -198 | 16.7 | 25.3 | 45,287 | 44,434 | 1.51 | 0.2% | -0.1 | 193 | 330.6 | 375 | 21 |
| QGEN | 21.6 | 16.3 | 4.6 | 13.2 | 4.2 | 2.6 | 8,797 | 9,657 | 0.62 | 4.2% | 2.6 | 40 | 46.1 | 50 | 14 |
| GH | — | -359.2 | 18.9 | -51.9 | 18.3 | -96.9 | 21,695 | 22,339 | 1.59 | 0.1% | -0.5 | 105 | 194.3 | 225 | 24 |
Source: Yahoo Finance
LNTH’s 24.1x trailing P/E, 16x forward P/E, 4.3x EV/revenue, and 16.9x EV/EBITDA sit above GEHC at 16.7x, 13.4x, 1.9x, and 11.5x, but below TLX’s 63.9x forward P/E and 132.4x EV/EBITDA. LNTH also screens better than TLX and NTRA on FCF yield, which tells me the market is paying for cleaner cash conversion rather than just headline growth. The peer set is split enough that I would not anchor on a single implied range, but LNTH clearly trades as a quality name rather than a bargain.
Profitability
| Company | Operating Margin (TTM) | Net Margin (TTM) | Return on Assets (TTM) | Return on Equity (TTM) | Gross Margin (TTM) | EBITDA Margin (TTM) |
|---|---|---|---|---|---|---|
| LNTH | 25.8% | 17.7% | 8.4% | 22.2% | 60.1% | 25.2% |
| TLX | 1.9% | -0.9% | 1.1% | -1.9% | 47.5% | 4.0% |
| GEHC | 15.0% | 9.3% | 5.1% | 19.4% | 39.5% | 16.9% |
| NTRA | -10.3% | -7.1% | -8.1% | -12.5% | 65.2% | -8.3% |
| QGEN | 26.3% | 19.5% | 5.9% | 11.9% | 66.4% | 35.0% |
| GH | -38.2% | -38.3% | -18.1% | — | 65.0% | -36.4% |
Source: Yahoo Finance
LNTH’s 25.8% operating margin, 17.7% net margin, 8.4% ROA, 22.2% ROE, 60.1% gross margin, and 25.2% EBITDA margin compare well with GEHC’s 15.0%, 9.3%, 5.1%, 19.4%, 39.5%, and 16.9%. QGEN is the closest peer on operating efficiency, but LNTH still holds up well across the full stack, which supports the premium multiple better than growth alone does. I think the profitability gap is the clearest reason the stock can trade above the slower peers without looking obviously stretched.
Leverage
| Company | Total Debt/Equity % (mrq) | Current Ratio (mrq) | Total Debt (mrq, USD Mil) | Operating Cash Flow TTM (USD Mil) | Free Cash Flow TTM (USD Mil) | Net Debt/EBITDA (TTM) | FCF Margin % (TTM) |
|---|---|---|---|---|---|---|---|
| LNTH | 47.6 | 3.1 | 625 | 412.8 | 451.7 | 0.1 | 29.0% |
| TLX | 112.5 | 1.4 | 467.1 | -17.3 | -36.7 | 10 | -4.6% |
| GEHC | 94 | 1.3 | 10,541 | 2,101 | 1,573.1 | 2.4 | 7.4% |
| NTRA | 13.1 | 3 | 238.5 | 228.2 | 104 | 3.8 | 3.8% |
| QGEN | 49.2 | 2.8 | 1,653.7 | 654.5 | 372.9 | 1.2 | 17.8% |
| GH | — | 4 | 1,697 | -185.2 | 26.6 | -1.5 | 2.2% |
Source: Yahoo Finance
LNTH’s 47.6% debt/equity, 3.1x current ratio, 0.08x net debt/EBITDA, and 29.0% FCF margin are much stronger than TLX’s 112.5%, 1.4x, 10.0x, and -4.6%, and also better than GEHC’s 94.0%, 1.3x, 2.4x, and 7.4%. That balance-sheet strength helps explain why LNTH can command a higher valuation than some peers even without the fastest growth. In other words, the market is paying for earnings quality and liquidity, not just for revenue expansion.
Conclusion
I would put my rating as a Hold because the key tension is now between a high-quality balance sheet and a revenue base that is still too uneven to justify a higher multiple. The business is profitable, cash generative, and lightly levered, but the latest quarter only showed 388.2M of revenue and the growth path has been choppy enough that I do not yet see the kind of sustained acceleration that would make the current valuation look cheap. That is why I think the stock can stay supported, but not re-rate aggressively from here unless execution improves.
I would raise my rating more towards a Buy if quarterly revenue can hold above 400M, meaning the company is sustaining the Q4 2025 level rather than slipping back into the high-$370M range, and if operating margin stays above 25.0%, which would show the earnings engine is still intact after the portfolio reshaping. I would also want to see that the reimbursement pressure around PYLARIFY is not translating into a sharper revenue break, because that is the risk most likely to hit the numbers first.
I would move from Hold to Sell if quarterly revenue falls below 380M for two straight quarters or if operating margin drops under 25.0% and stays there, because either outcome would tell me the current cash-generation profile is less durable than it looks today. A second warning sign would be any clear deterioration in the net cash profile, since the 0.08x net debt/EBITDA cushion is one of the main reasons the equity can absorb a slowdown.
Weighing both sides, I think the bear case is more likely to show up first because the valuation already assumes the current earnings base is stable. The balance sheet gives Lantheus time, but the stock still needs cleaner top-line proof before I would pay up for it.
What to Watch Next
- Quarterly revenue above 400M — would support a move toward Buy.
- Operating margin above 25.0% — would confirm the earnings base is holding.
- Revenue below 380M for two straight quarters — would strengthen the Sell case.
- Net debt/EBITDA staying near 0.1x — would keep the balance-sheet cushion intact.
- PYLARIFY reimbursement and generic timing — would be the first place to look for pressure on the thesis.
What’s your take? I rated Lantheus (LNTH) HOLD above — but the goal here is to get this right, not just to publish an opinion. What would you add to this analysis, or which risk or catalyst do you think I’m under- or over-weighting? Tell me in the comments.
Sources
- SEC 10-K Annual Report — filed 2026-02-26
- SEC 8-K Filing (2026-05-07)
- SEC 8-K Filing (2026-05-01)
- SEC 8-K Filing (2026-02-26)
- SEC Form 4 Insider Transaction (2026-06-03)
- SEC Form 4 Insider Transaction (2026-06-03)
- SEC Form 4 Insider Transaction (2026-05-18)
- SEC 10-K Annual Report — FY2026
- SEC 10-K Annual Report — FY2025
- SEC 10-K Annual Report — FY2024
- SEC 10-K Annual Report — FY2023
- SEC 10-K Annual Report — FY2022
Data sourced from Yahoo Finance and SEC EDGAR. Not investment advice.
Leave a Comment