
| Company | Sep 25 | Oct 25 | Nov 25 | Dec 25 | Jan 26 | Feb 26 | Mar 26 | Apr 26 | May 26 | Jun 26 | Jul 26 | Aug 26 | 12-Mo |
|---|---|---|---|---|---|---|---|---|---|---|---|---|---|
| RXT | +12% | +13% | -34% | -8% | -37% | +219% | -50% | +49% | +254% | +26% | -37% | -24% | +148% |
| DOCN | +5% | +19% | +9% | +8% | +15% | +1% | +53% | +12% | +62% | +1% | -25% | -6% | +239% |
| DXC | -6% | +4% | -7% | +11% | -2% | -13% | -0% | -10% | -12% | -11% | +27% | +1% | -22% |
| CTSH | -7% | +9% | +7% | +7% | -1% | -21% | -5% | -14% | +6% | -31% | +43% | +17% | -9% |
| EPAM | -14% | +8% | +14% | +10% | +2% | -32% | -4% | -16% | -10% | -23% | +33% | +12% | -33% |
| KD | -6% | -4% | -11% | +3% | -13% | -46% | +6% | +5% | -10% | -9% | +20% | -1% | -58% |
Source: Yahoo Finance monthly adjusted close.
Quick Thesis
- Rated sell — leverage and weak earnings conversion outweigh the hybrid-cloud niche.
- Strongest support: $186.6M of levered free cash flow TTM.
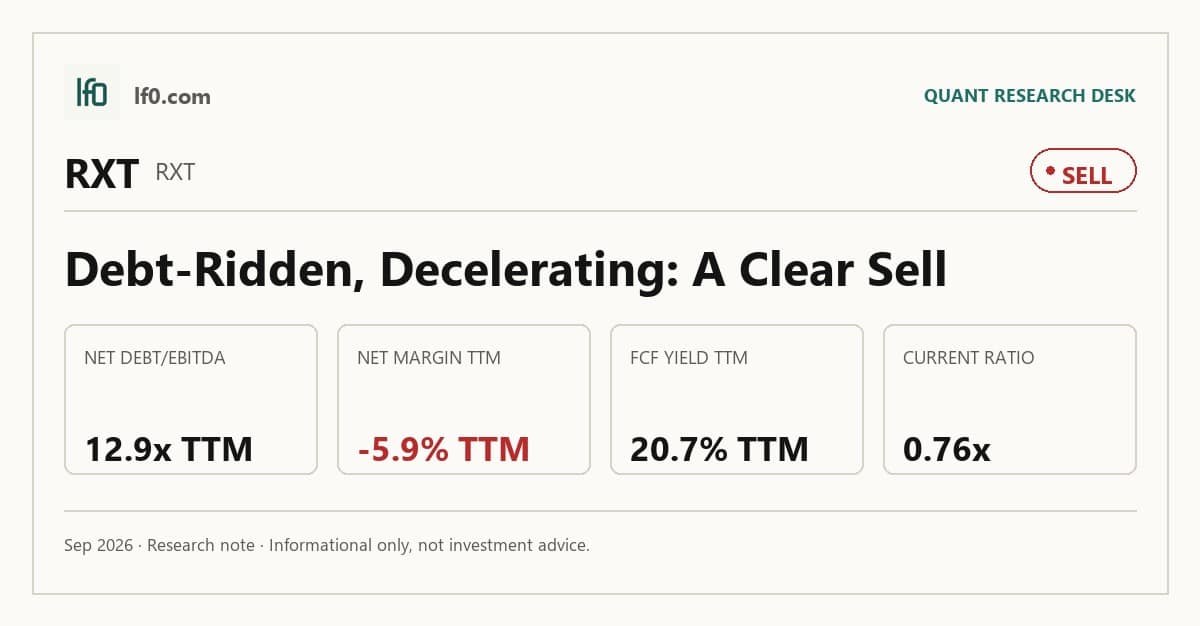
- Biggest risk: net debt/EBITDA of 12.9x, with a 0.8x current ratio.
- Valuation is mixed: 16.2x EV/EBITDA, but 20.7% FCF yield.
- I would move toward hold only if operating margin turns positive and growth reaccelerates.
Executive Summary
Rating: SELL | RXT
We’ll begin tracking this call’s performance since publication once sufficient adjusted-close data is available.
I would put my rating as a Sell because Rackspace Technology still has too much debt for a business with negative operating margin and only modest top-line growth. The company does have a defensible niche in governed hybrid cloud, but that advantage is not yet translating into enough earnings power to offset 12.9x net debt/EBITDA and a 0.8x current ratio.
What matters most is whether management can turn the current cost discipline into real operating leverage. I would raise my rating more toward a Hold if revenue growth moves back above 5.0% year over year, meaning the current 0.6% TTM growth is no longer the right base case, and if operating margin turns positive, which would show overhead is finally being absorbed by the existing customer base.
Company Profile
Rackspace Technology provides hybrid cloud and artificial intelligence services by designing, integrating, and operating private cloud, public cloud, and sovereign environments for regulated and mission-critical workloads. Revenue comes from professional services, managed services, colocation, managed hosting, and recurring cloud operations across AWS, Microsoft Azure, Google Cloud, VMware by Broadcom, and related platforms.
The company traces its roots to 1998, returned to the public markets in August 2020, and now serves more than 75,000 customers in over 120 countries. It operates in more than 60 cities and employs about 5,000 Rackers across 22 countries, so the footprint is broad even though the business still depends on a relatively concentrated set of cloud and infrastructure relationships.
Economic Moat
Business Model
The hardest thing for a well funded competitor to copy within 3 years is Rackspace Technology’s ability to operate governed hybrid cloud environments across private cloud, AWS, Google Cloud, Microsoft Azure, and sovereign setups through one customer interface. I feel that this is the most defensible element because the 2026 10-K ties it to 25+ years of operating mission-critical workloads, 5,000 Rackers, more than 350 quota-bearing representatives, and over 600 service delivery managers, which is a mix of technical depth and delivery scale that a new entrant cannot assemble quickly.
The company also has support from its automation stack, including AIOps, self-service APIs, unified billing, and 24x7x365 security operations, all of which make the operating model stickier once a customer is embedded. Its partnerships with AWS, Google Cloud, Microsoft Azure, VMware by Broadcom, Dell Technologies, and Palantir Technologies matter too, because they position Rackspace as an orchestrator rather than a single-platform reseller, and that is harder to displace in regulated workloads where data sovereignty and compliance are central.
Business & Operating Risks
The biggest disclosed risk is leverage. According to the risk factors in their SEC 10-K, Rackspace Technology had $2.4B of outstanding indebtedness as of December 31, 2025, and $150.1M of debt service payments in FY2025, which was 99.2% of cash flow from operations. That leaves very little room for execution slippage, so any revenue miss or margin compression can quickly turn into a refinancing problem rather than just an earnings problem.
Customer retention and mix are the next pressure point. The filing warns that Rackspace must attract new customers, retain existing customers, and sell additional services at comparable gross margins, while many Private Cloud contracts run only 12 to 36 months and most Public Cloud and legacy OpenStack services can be canceled at any time without penalty. That means revenue visibility is short and churn can hit quickly if customers migrate to internal IT teams, third-party cloud infrastructure, or colocation providers such as Equinix, CyrusOne, and QTS.
Cybersecurity and service uptime remain material because they can trigger customer loss, credits, and legal claims in one event. The filing cites a ransomware incident that disrupted Hosted Exchange customers and a ScienceLogic breach that exposed some customer information, then warns that a failure to meet service-level commitments could force service credits and customer churn. In my view, these risks do threaten the moat: the managed hybrid-cloud advantage is only valuable if Rackspace can keep systems secure, available, and trusted.
Management Discussion & Analysis
Management is signalling a clear capital-preservation and simplification agenda, and that is the right response to the leverage and churn risks above. In 2025 the company completed the March 2024 refinancing transactions, issued the FLSO Term Loan Facility with $1.687B of aggregate principal, the FLFO Term Loan Facility with $275M, and the New Revolving Credit Facility with $375M of commitments, then ended 2025 with $60M drawn.
That said, this is liquidity management rather than balance-sheet repair. The next major maturity wall is May 15, 2028, which buys time for execution but does not reduce the $2.429B of aggregate principal still outstanding at December 31, 2025. Management is also steering Public Cloud toward higher-margin services and cost efficiencies, and the numbers partly support that with Public Cloud segment operating profit rising to $67.6M in 2025 from $44.2M in 2024, while Private Cloud revenue fell to $989.7M from $1.055B and segment operating profit slipped to $252.4M from $294.4M.
Cost actions are real, not cosmetic, because SG&A fell to $607.1M in 2025 from $707.6M in 2024 and adjusted EBITDA rose to $275.7M from $244.8M. Even so, gross margin eased to 18.9% from 19.5%, so the savings are cushioning the model rather than creating durable operating leverage. The company also says it will continue to use the Receivables Purchase Facility, which had a $300M aggregate maximum limit and helped operating cash flow rise to $151.4M in 2025 from $39.9M in 2024, but that improvement was helped by $35M more cash proceeds from accounts receivable sales.
Recent Events
The most important recent developments were the February 26, 2026 earnings release for the quarter and year ended December 31, 2025, followed by the May 7, 2026 release for the quarter ended March 31, 2026. Those updates keep the market focused on execution rather than strategy changes, so they test the moat through operating performance instead of altering it.
The only non-earnings item was Betsy Atkins’ resignation from the board on March 31, 2026, disclosed on April 3, 2026. Because the filing says the departure was not tied to any dispute, I read it as a governance change rather than a red flag, and it does not by itself weaken the competitive position.
Taken together, the recent 8-Ks leave the structural thesis intact but still under pressure: Rackspace has not announced a product, financing, or strategic event that would materially reset the moat, so the burden remains on operating execution.
Financial Analysis
Growth
RXT — Financial Growth (Quarterly, USD Mil)
| Metric | 2025-06-30 | 2025-09-30 | 2025-12-31 | 2026-03-31 | 2026-06-30 |
|---|---|---|---|---|---|
| REVENUE (USD Mil) | 666.3 | 671.2 | 682.8 | 678.1 | 670.1 |
| EBIT (USD Mil) | -28.6 | -37.8 | -8.8 | 34.4 | -31.5 |
| EBITDA (USD Mil) | 46.4 | 85.8 | 81.3 | 106.2 | 38.4 |
| NET INCOME (USD Mil) | -54.5 | -67.1 | -32.7 | 8.3 | -67.5 |
| DILUTED EPS | -0.2 | -0.3 | -0.1 | 0 | -0.3 |
Source: Yahoo Finance — Quarterly Financial Statements
RXT’s revenue has been essentially flat across the last five reported quarters: $666M in Q2 2025, $671M in Q3 2025, $683M in Q4 2025, $678M in Q1 2026, and $670M in Q2 2026. The latest quarter was down 1.2% sequentially from Q1 2026, which tells me the business is not building momentum into the year.
EBITDA moved more sharply, from $46.4M in Q2 2025 to $106M in Q1 2026 before falling back to $38.4M in Q2 2026, so earnings are more volatile than revenue and the Q2 2026 drop looks like a swing that needs to be read alongside the company’s working-capital and cost actions. Growth is still a bear signal because the top line is stagnant and the moat is not yet showing up as sustained acceleration.
Profitability
RXT — Profitability (TTM)
| Metric | TTM |
|---|---|
| Operating Margin (TTM) | -2.1% |
| Net Margin (TTM) | -5.9% |
| Return on Assets (TTM) | -1.0% |
| Return on Equity (TTM) | — |
| Gross Margin (TTM) | 18.6% |
| EBITDA Margin (TTM) | 9.2% |
Source: Yahoo Finance — Trailing Twelve Months (TTM)
TTM gross margin was 18.6%, EBITDA margin was 9.17%, operating margin was -2.13%, net margin was -5.88%, and return on assets was -0.96%. The spread between gross margin and operating margin is wide, which tells me the core service layer still covers direct delivery costs but leaves too little after overhead, sales, and platform expense.
EBITDA margin staying positive while operating margin is negative points to depreciation and amortisation plus other below-EBITDA charges still absorbing most of the economics. That makes this a scale and cost-structure problem rather than a pricing-power problem, and it also explains why the hybrid-cloud moat has not yet converted into durable GAAP earnings.
Valuation
RXT — Valuation Multiples
| Metric | Value |
|---|---|
| Market Cap (USD Mil) | 904 |
| Enterprise Value (USD Mil) | 4,018 |
| Trailing P/E | — |
| Forward P/E | 26.1 |
| Price/Sales (TTM) | 0.3 |
| Price/Book (mrq) | -0.7 |
| EV/Revenue | 1.5 |
| EV/EBITDA | 16.2 |
| Beta (5Y Monthly) | 3.06 |
| FCF Yield % (TTM) | 20.7% |
| Forward EPS (USD) | 0.1 |
| Analyst Target Price – Low (USD) | 4 |
| Analyst Target Price – Mean (USD) | 4.8 |
| Analyst Target Price – High (USD) | 5.3 |
| # Analyst Opinions | 3 |
Source: Yahoo Finance
RXT screens as a value and special situations name, but the primary signal is still mixed rather than cheap in a clean sense. EV/Revenue is 1.49x and EV/EBITDA is 16.2x, while Price/Sales (TTM) is 0.334x and FCF Yield (TTM) is 20.7%, so the market is paying about $4B of enterprise value for a business with only $186.6M of levered free cash flow over the last twelve months.
On the analysis here, I would put fair value in a broad $4.0-$5.3 range, which lines up with the analyst target range of $4–$5.3 from 3 opinions. That consensus is thin rather than broad, so I would not treat it as a strong anchor, but it does tell me my range is not far from where the small coverage set already sits.
I would also frame EPS in a narrow $0.1-$0.2 range, based on the current margin profile and the company’s own Forward EPS of 0.136. That is still far below peers such as CTSH at $6.3 and EPAM at $14.1, which means RXT is not being valued on near-term earnings power; it is being valued on whether cash generation can stay positive while leverage comes down.
Leverage
RXT — Leverage & Coverage (Quarterly)
| Metric | Value |
|---|---|
| Total Debt/Equity % (mrq) | — |
| Current Ratio (mrq) | 0.8 |
| Total Debt (mrq, USD Mil) | 3,308.4 |
| Operating Cash Flow (TTM, USD Mil) | 104 |
| Levered Free Cash Flow (TTM, USD Mil) | 186.6 |
| Net Debt/EBITDA (TTM) | 12.9 |
| FCF Margin % (TTM) | 6.9% |
Source: Yahoo Finance — Quarterly Financial Statements
Rackspace Technology carries $3.308B of total debt against a current ratio of 0.756x and a net debt/EBITDA of 12.9x, which leaves very little balance-sheet cushion if cash generation weakens. Operating cash flow TTM was $104M and levered free cash flow TTM was $186.6M, while FCF margin was 6.91%.
That cash profile is not enough to offset the leverage load comfortably, especially with total cash of $110.6M and debt still more than 17 times levered free cash flow. EBITDA is converting to cash, but the spread is thin relative to $3.3B of debt, so most flexibility depends on keeping cash flow stable and refinancing on acceptable terms.
Insider Activity
The insider transaction record I see here is one-sided: 22 open-market sales and 0 open-market purchases over 2024-02-25 to 2026-06-04, so insiders are net sellers. The selling is also broad, not just one person, with multiple executives transacting across several dates, which suggests weak alignment with outside shareholders at the margin.
Comparable Analysis
Growth
| Company | Revenue TTM (USD Mil) | Revenue Growth YoY % | EBITDA TTM (USD Mil) | Diluted EPS TTM |
|---|---|---|---|---|
| RXT | 2,702.2 | 0.6% | 247.8 | -0.7 |
| DOCN | 1,011.1 | 28.6% | 308.6 | 2.2 |
| DXC | 12,484 | -5.1% | 1,367 | 0.7 |
| CTSH | 21,642 | 4.5% | 4,036 | 4.7 |
| EPAM | 5,616.8 | 4.5% | 753.4 | 7.4 |
| KD | 14,967 | -3.3% | 1,310 | 0.4 |
Source: Yahoo Finance
RXT’s revenue growth was 0.6% TTM, far below DOCN at 28.6%, CTSH at 4.5%, EPAM at 4.5%, and even DXC at -5.1% and KD at -3.3%. That gap says the stock is not being backed by a growth premium, so any valuation support has to come from cash generation or a recovery that still needs to show up in the numbers.
Valuation
| Company | Trailing P/E | Forward P/E | EV/Revenue | EV/EBITDA | Price/Sales (TTM) | Price/Book (mrq) | Market Cap (USD Mil) | Enterprise Value (USD Mil) | Beta (5Y Monthly) | FCF Yield % (TTM) | Forward EPS | Analyst Target Price – Low | Analyst Target Price – Mean | Analyst Target Price – High | # Analyst Opinions |
|---|---|---|---|---|---|---|---|---|---|---|---|---|---|---|---|
| RXT | — | 26.1 | 1.5 | 16.2 | 0.3 | -0.7 | 904 | 4,018 | 3.06 | 20.7% | 0.1 | 4 | 4.8 | 5.3 | 3 |
| DOCN | 54 | 64.5 | 15.5 | 50.8 | 13.8 | 13.4 | 13,969 | 15,667 | 1.57 | -0.2% | 1.8 | 140 | 175.2 | 200 | 15 |
| DXC | 16.3 | 4.1 | 0.3 | 3.2 | 0.2 | 0.6 | 1,925 | 4,308 | 0.80 | 45.6% | 3 | 9 | 11.2 | 14 | 7 |
| CTSH | 13.8 | 10.1 | 1.3 | 7 | 1.3 | 2 | 28,876 | 28,070 | 0.83 | 7.7% | 6.3 | 42 | 64.2 | 84 | 25 |
| EPAM | 17 | 8.9 | 1 | 7.2 | 1.2 | 1.8 | 6,471 | 5,446 | 1.38 | 10.1% | 14.1 | 94 | 122.8 | 200 | 17 |
| KD | 37 | 5.5 | 0.4 | 4.4 | 0.2 | 2.8 | 2,981 | 5,787 | 1.71 | 89.0% | 2.5 | 13 | 14.2 | 16 | 5 |
Source: Yahoo Finance
RXT’s FCF Yield (TTM) of 20.7% is the most important figure here because it is richer than DOCN at -0.2%, CTSH at 7.7%, and EPAM at 10.1%, though still below DXC at 45.6% and KD at 89.0%. RXT’s EV/Revenue of 1.49x and EV/EBITDA of 16.2x are above CTSH at 1.3x and 7.0x, EPAM at 1.0x and 7.2x, DXC at 0.3x and 3.2x, and KD at 0.4x and 4.4x, so the market is paying up for a cash profile that is better than some peers but not for superior growth.
Using peer EV/Revenue of 0.3x to 15.5x on RXT’s $2.7B TTM revenue gives an implied enterprise value range that is too wide to be useful as a target, which is exactly why I lean on the actual cash yield and leverage profile instead. The stock’s 135% 1-year total return also matters: the market has already rerated the shares hard, so the burden is now on earnings to justify that move rather than on sentiment alone.
Profitability
| Company | Operating Margin (TTM) | Net Margin (TTM) | Return on Assets (TTM) | Return on Equity (TTM) | Gross Margin (TTM) | EBITDA Margin (TTM) |
|---|---|---|---|---|---|---|
| RXT | -2.1% | -5.9% | -1.0% | — | 18.6% | 9.2% |
| DOCN | 10.4% | 23.3% | 3.9% | 62.3% | 57.2% | 30.5% |
| DXC | 2.0% | 1.0% | 1.8% | 4.0% | 23.0% | 10.9% |
| CTSH | 17.5% | 10.3% | 10.7% | 14.9% | 33.4% | 18.6% |
| EPAM | 10.9% | 7.2% | 8.5% | 11.2% | 29.4% | 13.4% |
| KD | 2.9% | 0.6% | 3.0% | 6.9% | 21.8% | 8.8% |
Source: Yahoo Finance
Profitability is the main drag. RXT’s gross margin of 18.6%, EBITDA margin of 9.17%, operating margin of -2.13%, and net margin of -5.88% all trail CTSH at 33.4%, 18.6%, 17.5%, and 10.3%, EPAM at 29.4%, 13.4%, 10.9%, and 7.2%, and DOCN at 57.2%, 30.5%, 10.4%, and 23.3%.
The gap looks more like a scale and opex problem than a pure cost-of-revenue issue because RXT’s gross margin is already positive, but operating losses show the overhead base is still too heavy for the revenue run-rate. That also means the moat is not yet showing up in peer-relative profitability, which is the clearest reason I stay cautious.
Leverage
| Company | Total Debt/Equity % (mrq) | Current Ratio (mrq) | Total Debt (mrq, USD Mil) | Operating Cash Flow TTM (USD Mil) | Free Cash Flow TTM (USD Mil) | Net Debt/EBITDA (TTM) | FCF Margin % (TTM) |
|---|---|---|---|---|---|---|---|
| RXT | — | 0.8 | 3,308.4 | 104 | 186.6 | 12.9 | 6.9% |
| DOCN | 212.5 | 1.3 | 1,977.9 | 310 | -23.8 | 3.9 | -2.4% |
| DXC | 125.4 | 1.4 | 4,174 | 1,480 | 877 | 1.6 | 7.0% |
| CTSH | 14.5 | 2.2 | 2,094 | 2,917 | 2,215.5 | 0.3 | 10.2% |
| EPAM | 4.3 | 2.8 | 152.2 | 538.8 | 650.2 | -0.8 | 11.6% |
| KD | 422.5 | 0.8 | 4,930 | 762 | 2,652.6 | 2.2 | 17.7% |
Source: Yahoo Finance
Leverage is the biggest balance-sheet concern. RXT’s net debt/EBITDA is 12.9x, versus DOCN at 3.9x, DXC at 1.6x, CTSH at 0.3x, EPAM at -0.8x, and KD at 2.2x, while its current ratio of 0.756x is weaker than every peer except KD at 0.8x.
Free cash flow margin of 6.91% is positive, but it is not enough to offset $3.3B of debt, so the capital structure still looks like a financing choice that limits equity flexibility rather than a competitive advantage. That is why the market can reward the cash yield and still discount the equity: the leverage profile keeps the equity story tied to refinancing discipline, not just operating performance.
Conclusion
I would put my rating as a Sell because Rackspace Technology’s cash generation is improving, but the balance sheet still dominates the equity story. The company has a defensible niche in governed hybrid cloud, yet 12.9x net debt/EBITDA and a 0.8x current ratio leave too little room for error, and the latest quarters have not shown enough growth or margin expansion to make that leverage feel manageable.
The bull case is straightforward: if revenue growth moves back above 5.0% year over year, meaning the current 0.6% TTM growth is no longer the right base case, and if operating margin turns positive, then I would move my rating more toward a Hold because the business would finally be showing operating leverage. I would also want FCF margin to hold above 8.0%, which would imply roughly $216M of annual free cash flow on the current revenue base and would start to reduce refinancing risk instead of just servicing it.
The bear case is just as clear. If net debt/EBITDA stays above 10.0x, meaning leverage remains well above a level lenders would view as comfortable for a software and services business, and if operating margin stays negative for another two quarters, then the market will keep treating the stock as a financing risk rather than a cash compounder. In that case, the recent share price strength would look like a rerating without the earnings support to hold it.
Weighing both paths, I lean to the bear case because the company has already shown that cost cuts can lift EBITDA, but not yet that the core revenue base can grow fast enough to make the capital structure manageable. I would become more constructive only after a clear quarter of positive operating margin and a sustained step-up in growth, because until then the balance sheet still has more influence on the equity than the operating model does.
What to Watch Next
- Revenue growth above 5.0% YoY — would support a move toward Hold.
- Operating margin turning positive — would show overhead absorption is finally working.
- FCF margin holding above 8.0% — would imply enough cash to start easing refinancing risk.
- Net debt/EBITDA below 10.0x — would reduce the balance-sheet overhang.
- Two more quarters of negative operating margin — would keep the stock in financing-risk territory.
What’s your take? I rated Rackspace Technology (RXT) SELL above — but the goal here is to get this right, not just to publish an opinion. What would you add to this analysis, or which risk or catalyst do you think I’m under- or over-weighting? Tell me in the comments.
Sources
- SEC 10-K Annual Report — filed 2026-03-06
- SEC 8-K Filing (2026-05-07)
- SEC 8-K Filing (2026-04-03)
- SEC 8-K Filing (2026-02-26)
- SEC Form 4 Insider Transaction (2026-06-04)
- SEC Form 4 Insider Transaction (2026-06-04)
- SEC Form 4 Insider Transaction (2026-06-04)
- SEC 10-K Annual Report — FY2026
- SEC 10-K Annual Report — FY2025
- SEC 10-K Annual Report — FY2024
- SEC 10-K Annual Report — FY2023
- SEC 10-K Annual Report — FY2022
Data sourced from Yahoo Finance and SEC EDGAR. Not investment advice.
Leave a Comment