
| Company | Sep 25 | Oct 25 | Nov 25 | Dec 25 | Jan 26 | Feb 26 | Mar 26 | Apr 26 | May 26 | Jun 26 | Jul 26 | Aug 26 | 12-Mo |
|---|---|---|---|---|---|---|---|---|---|---|---|---|---|
| MCD | -3% | -2% | +4% | -1% | +3% | +8% | -8% | -6% | -5% | -3% | +0% | -3% | -14% |
| SBUX | -4% | -4% | +8% | -3% | +9% | +7% | -9% | +18% | -5% | +3% | +3% | +2% | +24% |
| CMG | -7% | -19% | +9% | +7% | +5% | -4% | -14% | +6% | -6% | +7% | +9% | +2% | -10% |
| DPZ | -5% | -8% | +5% | -0% | -2% | -2% | -10% | -5% | -8% | -4% | +17% | -2% | -24% |
| YUM | +4% | -9% | +11% | -1% | +3% | +9% | -8% | +3% | -7% | +8% | -4% | +0% | +6% |
| QSR | +2% | +2% | +10% | -5% | -2% | +7% | +4% | +9% | -7% | -2% | +2% | +5% | +28% |
Source: Yahoo Finance monthly adjusted close.
Quick Thesis
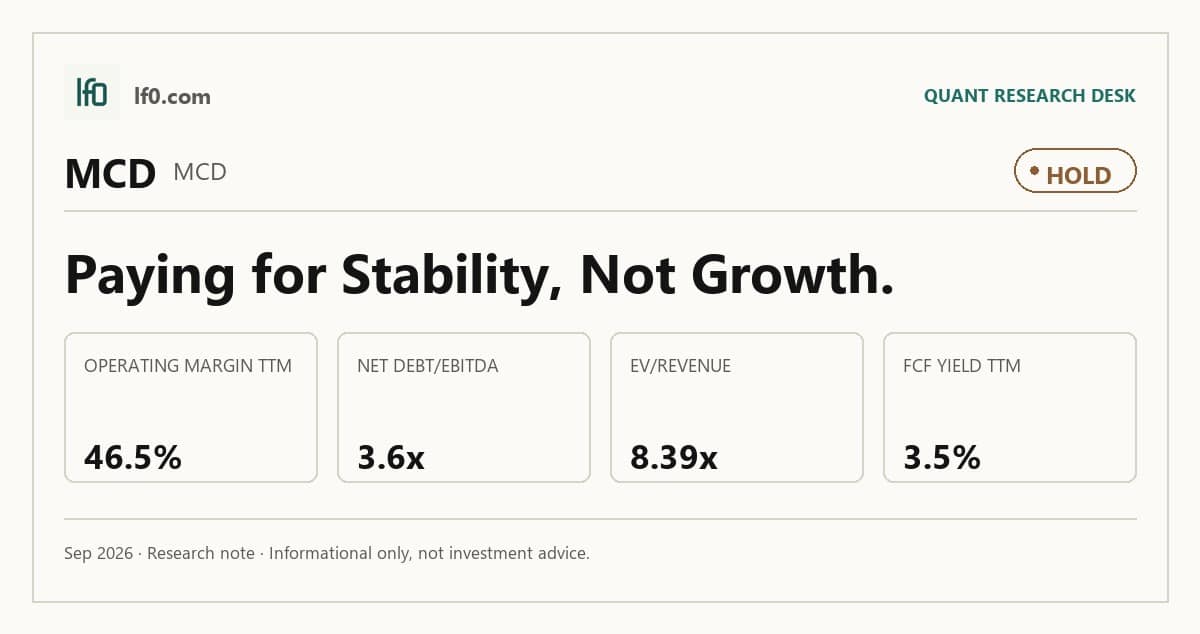
- Rated hold because quality is already priced in.
- Best strength: 46.5% TTM operating margin and 53.9% EBITDA margin.
- Main risk: $54.6B of debt, or 3.6x net debt/EBITDA.
- Valuation is rich at 8.4x EV/revenue and 20.5x trailing P/E.
- I would turn more constructive if operating margin stays above 46.0% and net debt/EBITDA falls below 3.3x.
Executive Summary
Rating: HOLD | MCD
Measured from adjusted close on 2026-09-14 to 2026-09-14. Sell ratings are correct when the stock falls; Hold is tracked as a +/-10% range. Daily-close data, not intraday. Calls are tracked for 182 days from publication, then frozen as a final record.
I would put my rating as a Hold because McDonald’s combines best-in-class profitability with a valuation that already discounts that quality, and I do not see a fresh operating catalyst large enough to justify paying 8.4x EV/revenue for 3.7% TTM revenue growth. The business still converts 22.6% of TTM sales into levered free cash flow and runs a 46.5% operating margin, so this is not a weak operator, but the stock also carries $54.6B of debt and a 20.5x trailing P/E, which leaves limited room for multiple expansion from here. I would raise my rating more towards a Buy if revenue growth moved above 5.0% TTM, meaning the company is clearly reaccelerating faster than the current peer median, while operating margin stayed above 45.0% and free cash flow remained above $6B TTM.
Company Profile
McDonald’s is a global quick-service restaurant operator that earns most of its revenue from franchised and company-operated restaurants, with the model built around high-margin brand licensing, rent, and food sales. The company’s scale matters because it lets it spread fixed corporate and supply-chain costs across a very large system, which is one reason its margin profile remains well ahead of most restaurant peers. In my view, that scale advantage is the core operating asset the rest of the article is testing.
Economic Moat
Business Model
McDonald’s moat is built on scale, brand recognition, and a system that turns a large restaurant footprint into recurring cash flow. The key point is not just size, but the way that size supports 46.5% operating margin and 53.9% EBITDA margin, which is consistent with a structurally advantaged cost base rather than a one-quarter spike. That margin profile is the clearest sign that the brand and operating system still matter economically.
Business & Operating Risks
The main disclosed risks are execution, franchisee health, and the usual pressure points around food, labor, and consumer demand, but none of them looks like an immediate threat to the scale advantage itself. The bigger issue is that a mature system can absorb shocks for a long time and still look healthy on the surface, so I would watch whether margin pressure starts to show up in the quarterly trend rather than in the headline model. The shareholder rejection of the independent chair and written-consent proposals suggests governance reform is not the near-term lever here, so the moat is being tested more by operating discipline than by board structure.
Management Discussion & Analysis
Management appears to be responding through steady execution rather than a strategic reset, which is the right response if the core risk is margin durability rather than business-model disruption. The board expansion and new independent director are a modest governance positive, but the failed governance proposals show shareholders were not asking for a broader overhaul. That leaves the operating thesis intact, with management still judged mainly on whether it can keep cash generation and margins near current levels.
Recent Events
The February 4, 2026 board expansion added James D. Farley, Jr. as an independent director, and I read that as a small governance improvement rather than a change in strategy. The May 20, 2026 annual meeting matters more for what it did not do: shareholders rejected both the independent chair proposal and the written-consent proposal, which tells me there is no broad push for structural change. Taken together, the recent events reinforce a stable but unspectacular moat story, with governance moving only at the margin.
Financial Analysis
Growth
MCD — Financial Growth (Quarterly, USD Mil)
| Metric | 2025-06-30 | 2025-09-30 | 2025-12-31 | 2026-03-31 | 2026-06-30 |
|---|---|---|---|---|---|
| REVENUE (USD Mil) | 6,843 | 7,077 | 7,008 | 6,517 | 7,100 |
| EBIT (USD Mil) | 3,251 | 3,355 | 3,167 | 2,942 | 3,345 |
| EBITDA (USD Mil) | 3,795 | 3,914 | 3,743 | 3,508 | 3,910 |
| NET INCOME (USD Mil) | 2,253 | 2,278 | 2,164 | 1,983 | 2,362 |
| DILUTED EPS | 3.1 | 3.2 | 3 | 2.8 | 3.3 |
Source: Yahoo Finance — Quarterly Financial Statements
Revenue rose to $7.1B in the latest quarter from $6.8B a year earlier, while EBITDA increased to $3.9B from $3.8B. That is a solid but not explosive top line, and the quarter-to-quarter dip to $6.5B before the rebound tells me this is a steady consumer business rather than a name with a new growth leg. The growth profile supports the moat, but not enough to justify a premium on its own.
Profitability
MCD — Profitability (TTM)
| Metric | TTM |
|---|---|
| Operating Margin (TTM) | 46.5% |
| Net Margin (TTM) | 31.7% |
| Return on Assets (TTM) | 13.2% |
| Return on Equity (TTM) | — |
| Gross Margin (TTM) | 57.4% |
| EBITDA Margin (TTM) | 53.9% |
Source: Yahoo Finance — Trailing Twelve Months (TTM)
TTM operating margin was 46.5%, net margin was 31.7%, gross margin was 57.4%, EBITDA margin was 53.9%, and return on assets was 13.3%. The 10.9-point gap between gross margin and operating margin shows a meaningful operating expense load, yet the company still converts more than half of sales into EBITDA, which is exactly why the model deserves respect. I also think the 31.7% net margin confirms that the earnings power survives below the line, so this is a quality business even if the stock is not cheap.
Valuation
MCD — Valuation Multiples
| Metric | Value |
|---|---|
| Market Cap (USD Mil) | 178,701 |
| Enterprise Value (USD Mil) | 232,483 |
| Trailing P/E | 20.5 |
| Forward P/E | 18.1 |
| Price/Sales (TTM) | 6.5 |
| Price/Book (mrq) | -174.6 |
| EV/Revenue | 8.4 |
| EV/EBITDA | 15.6 |
| Beta (5Y Monthly) | 0.41 |
| FCF Yield % (TTM) | 3.5% |
| Forward EPS (USD) | 14 |
| Analyst Target Price – Low (USD) | 250 |
| Analyst Target Price – Mean (USD) | 314.8 |
| Analyst Target Price – High (USD) | 407 |
| # Analyst Opinions | 31 |
Source: Yahoo Finance
McDonald’s trades at 8.4x EV/revenue, 15.6x EV/EBITDA, 20.5x trailing P/E, and 18.1x forward P/E, with a 3.5% FCF yield and a 0.41 beta. In my view, the market is paying for durable cash generation rather than near-term earnings acceleration, but the premium is still real: the stock’s EV/revenue multiple is well above the peer set, while growth is only mid-pack. On the analysis here, I would put fair value in a broad range of $250–$315, which sits around the low end of the analyst target range and below the $314.8 mean because I weight the 3.7% growth rate and 3.6x net debt/EBITDA more heavily than the consensus appears to. Forward EPS of 14.0 also implies a solid earnings base, but it is not rich enough relative to peers to offset the valuation premium on revenue and cash flow. I would not call that a deep-value setup; it is a high-quality business priced like one.
Leverage
MCD — Leverage & Coverage (Quarterly)
| Metric | Value |
|---|---|
| Total Debt/Equity % (mrq) | — |
| Current Ratio (mrq) | 1.1 |
| Total Debt (mrq, USD Mil) | 54,604 |
| Operating Cash Flow (TTM, USD Mil) | 11,347 |
| Levered Free Cash Flow (TTM, USD Mil) | 6,262.4 |
| Net Debt/EBITDA (TTM) | 3.6 |
| FCF Margin % (TTM) | 22.6% |
Source: Yahoo Finance — Quarterly Financial Statements
McDonald’s carries $54.6B of total debt, with a current ratio of 1.1 and net debt/EBITDA of 3.6x. That is manageable for a company with $11.3B of operating cash flow and $6.3B of levered free cash flow, but it is still a meaningful claim on future flexibility. The 22.6% FCF margin is the key offset, because it shows the debt is supported by strong cash conversion rather than by accounting earnings alone.
Insider Activity
The insider record is clearly net selling: 29 open-market sales versus 5 purchases from 2022-11-03 to 2026-05-28, with $40.8M of sales against only $40,074 of purchases. Joseph M. Erlinger accounts for multiple recent sales, so the pattern is not broad-based insider accumulation. I read that as a mild negative for sentiment and alignment, although it does not by itself change the operating thesis.
Comparable Analysis
Growth
| Company | Revenue TTM (USD Mil) | Revenue Growth YoY % | EBITDA TTM (USD Mil) | Diluted EPS TTM |
|---|---|---|---|---|
| MCD | 27,702 | 3.7% | 14,930 | 12.3 |
| SBUX | 38,338.3 | -1.4% | 5,642.3 | 1.7 |
| CMG | 12,423.8 | 9.3% | 2,275 | 1.1 |
| DPZ | 5,027.8 | 4.3% | 1,023.5 | 17.6 |
| YUM | 8,722 | 12.2% | 3,068 | 8 |
| QSR | 9,699 | 4.6% | 2,924 | 4 |
Source: Yahoo Finance
McDonald’s 3.7% revenue growth trails YUM at 12.2% and CMG at 9.3%, but it is ahead of SBUX at -1.4% and close to DPZ at 4.3% and QSR at 4.6%. That puts MCD in the middle of the pack, which is why I do not think the market should pay a growth premium for it. The better read is that McDonald’s is compounding steadily while Starbucks is still shrinking.
Valuation
| Company | Trailing P/E | Forward P/E | EV/Revenue | EV/EBITDA | Price/Sales (TTM) | Price/Book (mrq) | Market Cap (USD Mil) | Enterprise Value (USD Mil) | Beta (5Y Monthly) | FCF Yield % (TTM) | Forward EPS | Analyst Target Price – Low | Analyst Target Price – Mean | Analyst Target Price – High | # Analyst Opinions |
|---|---|---|---|---|---|---|---|---|---|---|---|---|---|---|---|
| MCD | 20.5 | 18.1 | 8.4 | 15.6 | 6.5 | -174.6 | 178,701 | 232,483 | 0.41 | 3.5% | 14 | 250 | 314.8 | 407 | 31 |
| SBUX | 57.1 | 31.6 | 3.4 | 23.3 | 2.9 | -14.7 | 112,564 | 131,414 | 0.96 | 2.7% | 3.1 | 81 | 112.2 | 143 | 31 |
| CMG | 33.5 | 26.4 | 4.1 | 22.2 | 3.7 | 20.9 | 45,808 | 50,549 | 0.94 | 2.4% | 1.4 | 35 | 43.9 | 53 | 32 |
| DPZ | 17.7 | 14.9 | 3 | 14.9 | 2.1 | -2.6 | 10,308 | 15,266 | 0.95 | 5.2% | 20.9 | 270 | 381 | 450 | 28 |
| YUM | 17.7 | 20.1 | 5.9 | 16.7 | 4.4 | -5.3 | 38,444 | 51,175 | 0.55 | 2.2% | 7 | 147 | 173.8 | 200 | 22 |
| QSR | 19.3 | 17.4 | 4.4 | 14.7 | 3.6 | 7 | 35,256 | 42,934 | 0.53 | 4.9% | 4.4 | 79 | 85.9 | 104 | 24 |
Source: Yahoo Finance
MCD’s 8.4x EV/revenue stands well above DPZ at 3.0x, SBUX at 3.4x, CMG at 4.1x, QSR at 4.4x, and YUM at 5.9x, so the market is clearly paying up for quality. On a $1 invested basis, MCD would have been worth $0.86 over the past year, versus $1.25 for YUM, $1.24 for QSR, and $1.23 for SBUX, which tells me the premium has not translated into better recent share performance. The valuation gap is harder to defend when growth is only mid-pack and leverage is still 3.6x net debt/EBITDA.
Profitability
| Company | Operating Margin (TTM) | Net Margin (TTM) | Return on Assets (TTM) | Return on Equity (TTM) | Gross Margin (TTM) | EBITDA Margin (TTM) |
|---|---|---|---|---|---|---|
| MCD | 46.5% | 31.7% | 13.2% | — | 57.4% | 53.9% |
| SBUX | 12.9% | 5.2% | 8.0% | — | 22.3% | 14.7% |
| CMG | 16.1% | 11.4% | 13.1% | 49.6% | 39.4% | 18.3% |
| DPZ | 19.1% | 11.9% | 33.9% | — | 28.7% | 20.4% |
| YUM | 32.8% | 25.4% | 22.7% | — | 45.3% | 35.2% |
| QSR | 27.7% | 13.1% | 6.4% | 34.8% | 34.1% | 30.1% |
Source: Yahoo Finance
McDonald’s 46.5% operating margin and 53.9% EBITDA margin are the best in the peer set, ahead of YUM at 32.8% and 35.2%, QSR at 27.7% and 30.1%, DPZ at 19.1% and 20.4%, CMG at 16.1% and 18.3%, and SBUX at 12.9% and 14.7%. That margin lead is the main reason I think the stock deserves a premium multiple, but it also explains why the market already prices in a lot of good news. In other words, profitability supports the moat, yet it also limits upside from here unless growth improves.
Leverage
| Company | Total Debt/Equity % (mrq) | Current Ratio (mrq) | Total Debt (mrq, USD Mil) | Operating Cash Flow TTM (USD Mil) | Free Cash Flow TTM (USD Mil) | Net Debt/EBITDA (TTM) | FCF Margin % (TTM) |
|---|---|---|---|---|---|---|---|
| MCD | — | 1.1 | 54,604 | 11,347 | 6,262.4 | 3.6 | 22.6% |
| SBUX | — | 0.8 | 22,453.1 | 4,985.9 | 3,065.5 | 3.3 | 8.0% |
| CMG | 246.3 | 0.7 | 5,419.2 | 2,327.5 | 1,116.5 | 2.1 | 9.0% |
| DPZ | — | 1.5 | 5,122.9 | 777.8 | 531.5 | 4.8 | 10.6% |
| YUM | — | 0.6 | 13,414 | 2,083 | 833.2 | 4.2 | 9.6% |
| QSR | 290.1 | 1 | 15,651 | 1,858 | 1,713.4 | 5 | 17.7% |
Source: Yahoo Finance
MCD’s 3.6x net debt/EBITDA is lower than DPZ at 4.8x, YUM at 4.2x, and QSR at 5.0x, but higher than CMG at 2.1x and SBUX at 3.3x. Its 22.6% FCF margin is the strongest in the group, which is why I view the balance sheet as a financing choice rather than a distress signal. The combination of strong cash conversion and moderate leverage helps explain why MCD can sustain a premium valuation even without standout growth.
Conclusion
I would put my rating as a Hold because the main tension is between a moat that still shows up in 46.5% operating margin and 22.6% FCF margin, and a valuation that already prices in that quality. The numbers do not show a business under strain, but they also do not show enough acceleration to justify paying 8.4x EV/revenue and 20.5x trailing earnings for a 3.7% grower. That is why I see the stock as good, but not obviously mispriced.
The upside case is straightforward: if revenue growth moves above 5.0% TTM, meaning the company is clearly reaccelerating faster than the current peer median, while operating margin stays above 45.0% and free cash flow remains above $6B TTM, I would move more towards a Buy. That would tell me the cash engine is improving faster than the balance sheet is aging, and it would make the current 3.5% FCF yield look more like a floor than a ceiling.
The downside case is just as clear. If growth stays near 3% to 4% TTM while net debt/EBITDA drifts above 4.0x, meaning leverage is moving one turn worse than today, or if FCF margin slips below 20.0%, the premium would become harder to defend and I would move from Hold toward Sell. Insider selling would matter more in that scenario because it would line up with weaker operating momentum rather than sitting beside it.
Weighing both paths, I think the more likely outcome is continued steady cash generation rather than a re-rating catalyst. That leaves the shares supported, but not compelling, and I would want either faster growth or a cheaper entry point before changing the call.
What to Watch Next
- Revenue growth above 5.0% TTM — would support moving the rating more towards Buy.
- Operating margin staying above 45.0% — would confirm the moat is still intact.
- Free cash flow above $6B TTM — would support the current dividend and buyback base.
- Net debt/EBITDA above 4.0x — would raise balance-sheet pressure and weaken the case.
- FCF margin below 20.0% — would make the premium valuation harder to defend.
What’s your take? I rated McDonald’s (MCD) HOLD above — but the goal here is to get this right, not just to publish an opinion. What would you add to this analysis, or which risk or catalyst do you think I’m under- or over-weighting? Tell me in the comments.
Sources
- SEC 8-K Filing (2026-05-22)
- SEC 8-K Filing (2026-05-07)
- SEC 8-K Filing (2026-02-11)
- SEC 8-K Filing (2026-02-10)
- SEC Form 4 Insider Transaction (2026-06-01)
- SEC Form 4 Insider Transaction (2026-05-27)
- SEC Form 4 Insider Transaction (2026-04-23)
Data sourced from Yahoo Finance and SEC EDGAR. Not investment advice.
Leave a Comment