
| Company | Sep 25 | Oct 25 | Nov 25 | Dec 25 | Jan 26 | Feb 26 | Mar 26 | Apr 26 | May 26 | Jun 26 | Jul 26 | Aug 26 | 12-Mo |
|---|---|---|---|---|---|---|---|---|---|---|---|---|---|
| ANET | +7% | +8% | -17% | +0% | +8% | -6% | -8% | +41% | -8% | +7% | +6% | +9% | +43% |
| AVGO | +11% | +12% | +9% | -14% | -4% | -4% | -3% | +35% | +7% | -15% | +3% | -5% | +25% |
| CSCO | -1% | +7% | +5% | +0% | +2% | +1% | -2% | +19% | +32% | -2% | -1% | -5% | +63% |
| EXTR | -3% | -8% | -8% | -5% | -12% | -4% | +8% | +46% | +20% | +22% | -7% | -25% | +5% |
| NOK | +12% | +44% | -12% | +6% | -1% | +20% | +4% | +61% | +15% | -11% | -31% | +11% | +136% |
| ALAB | +7% | -5% | -16% | +6% | -9% | -21% | -8% | +78% | +76% | +41% | -36% | -5% | +63% |
Source: Yahoo Finance monthly adjusted close.
Quick Thesis
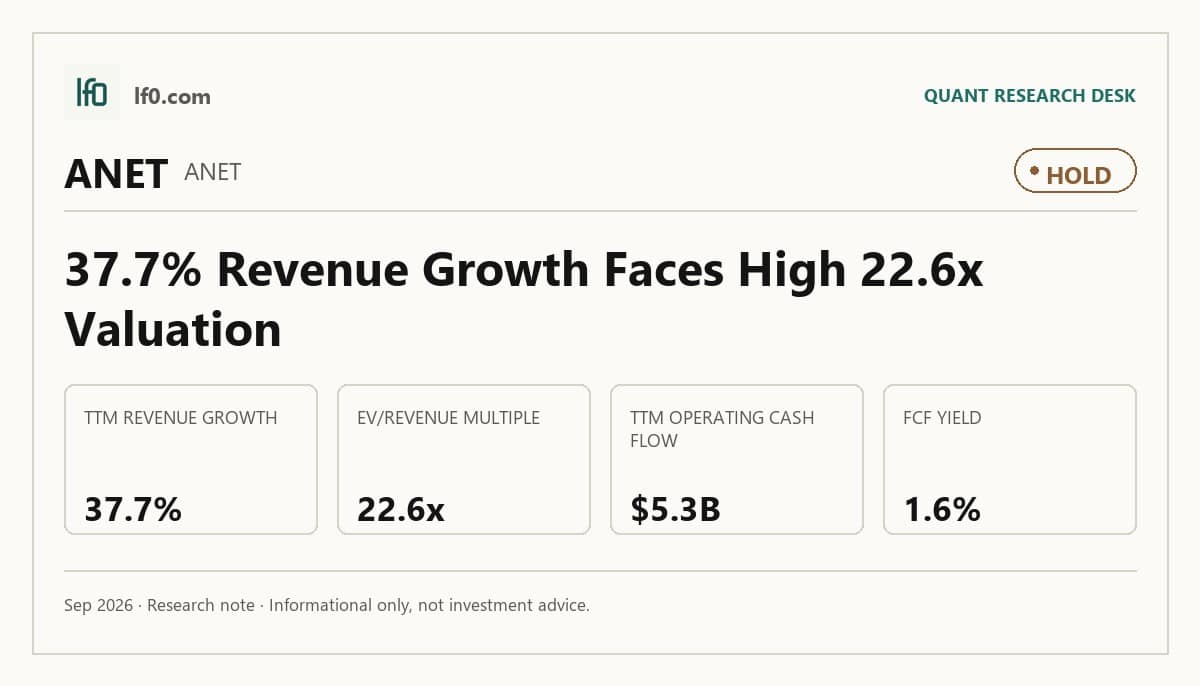
- Rated hold because valuation already discounts strong AI and cloud demand.
- Strongest support: $5.3B TTM operating cash flow and $3.9B TTM free cash flow.
- Main risk: customer concentration, with one customer at 26.0% of FY2025 revenue.
- Valuation is rich at 22.6x EV/revenue and 38.7x forward P/E.
- I would turn more constructive if revenue stays above $3B and gross margin holds above 63.0%.
Executive Summary
Rating: HOLD | ANET
Measured from adjusted close on 2026-09-14 to 2026-09-14. Sell ratings are correct when the stock falls; Hold is tracked as a +/-10% range. Daily-close data, not intraday. Calls are tracked for 182 days from publication, then frozen as a final record.
I would put my rating as a Hold because Arista’s premium multiple already prices in several quarters of strong AI and cloud demand, while the latest numbers still leave room for execution risk. Revenue grew 37.7% year over year to $3B in the latest quarter, and TTM free cash flow margin was 36.9%, so the business is still compounding well; the issue is that the stock trades at 22.6x EV/revenue and 38.7x forward P/E, which leaves little room for a slowdown if hyperscaler spending pauses. I would raise my rating more towards a Buy if revenue growth stays above 30.0% for the next two quarters, meaning the AI buildout is still broadening rather than peaking, and if FCF margin remains above 35.0%, which would confirm that growth is still converting into cash.
Company Profile
Arista Networks designs and sells high-speed Ethernet switching and software for AI centers, data centers, campus networks, and wide-area networks. Revenue comes from hardware switches, routing platforms, wireless access points, and recurring software and services built around Extensible Operating System (EOS), Network Data Lake (NetDL), CloudVision, and Arista A-Care Services. The company also expanded its campus and branch portfolio with VeloCloud Software-Defined Wide Area Network (SD-WAN), a cloud-delivered branch networking platform, and it now serves cloud and AI titans, AI and specialty providers, and enterprise customers worldwide. As of December 31, 2025, it had about 5,115 employees, 4 direct fulfillment facilities, and support parts stocked in over 200 locations globally. Arista is financed through public equity and operating cash flow, with no debt.
Economic Moat
Business Model
Arista’s hardest-to-copy advantage is the combination of EOS and NetDL, because that stack gives customers one operating system, one data lake, and one management layer across AI centers, data centers, campus centers, and WAN centers. In my view, a competitor would need more than a better switch to match that architecture; it would have to rebuild the software base, telemetry model, and operating workflow that sit behind it. CloudVision, AVA, and A-Care Services deepen the moat by adding automation, observability, and support, while the open, standards-based design reduces vendor lock-in without weakening the platform. That matters for the moat because the company’s 45.4% operating margin and 63.0% gross margin show the software-led model is already monetizing the installed base rather than just shipping hardware.
Business & Operating Risks
The most material disclosed risk is dependence on Broadcom for switching chips, because Arista says it is primarily reliant on its predominant merchant silicon vendor for those chips. That concentration can hit revenue, gross margin, and product timing at once if supply slips or pricing moves against Arista, and the filing warns that redesigns could lead to lost sales and lower gross margins. Customer concentration is the second clear headwind: one end customer represented 26.0% of FY2025 revenue and another 16.0%, so a capex pause from a hyperscaler could move both growth and margin in the same quarter. Tariffs and export controls add a third layer of pressure, especially because Arista manufactures mainly in Malaysia, Vietnam, and Mexico while sourcing some products from China and other Asian markets. I do not think these risks threaten the core EOS and NetDL moat directly, but they do threaten the speed at which that moat can convert into revenue and cash.
Management Discussion & Analysis
Management is still responding to those risks by keeping liquidity high and investing behind demand rather than pulling back. Cash, cash equivalents, and marketable securities were $10.7B as of December 31, 2025, while stock repurchases consumed $1.6B in 2025 and the board authorized a new $1.5B repurchase program, which tells me management sees the shares as worth buying back even after a strong run. Purchase obligations were $6.8B, with $6.3B expected within 12 months, so the working-capital burden is rising, but that also shows the company is preparing for continued AI network deployment. According to management’s discussion in the 10-K, existing liquidity should fund working capital and growth for at least the next 12 months. In my view, that is credible on liquidity, but it also means the company is choosing scale over near-term capital efficiency.
Recent Events
The May 29, 2026 annual meeting, where Arista’s three Class III directors were elected, and the June 2, 2026 advisory pay vote both point to governance continuity rather than disruption. The February 12, 2026 and May 5, 2026 earnings releases were routine operating updates, so they do not change the structural thesis, but they do reinforce that the market is still judging Arista mainly on product demand and execution. The June 2, 2026 ratification of Ernst & Young LLP as auditor is similarly routine. Taken together, these events leave the moat intact and the strategic direction unchanged.
Financial Analysis
Growth
ANET — Financial Growth (Quarterly, USD Mil)
| Metric | 2025-06-30 | 2025-09-30 | 2025-12-31 | 2026-03-31 | 2026-06-30 |
|---|---|---|---|---|---|
| REVENUE (USD Mil) | 2,204.8 | 2,308.3 | 2,487.8 | 2,709 | 3,035.7 |
| EBIT (USD Mil) | 986.2 | 978.2 | 1,032.9 | 1,157.8 | 1,378 |
| EBITDA (USD Mil) | 999 | 1,001.4 | 1,055.7 | 1,181.1 | 1,401.4 |
| NET INCOME (USD Mil) | 888.8 | 853 | 955.8 | 1,022.9 | 1,212.9 |
| DILUTED EPS | 0.7 | 0.7 | 0.8 | 0.8 | 0.9 |
Source: Yahoo Finance — Quarterly Financial Statements
Revenue rose from $2.2B to $3B in the latest reported quarter, a 37.7% increase, and EBITDA climbed from $999M to $1.4B over the same span. That is not just top-line growth; it shows the platform is still scaling with operating leverage, which is consistent with the software-led moat described above. Diluted EPS moved from $0.70 to $0.95, so earnings are still keeping pace with sales rather than lagging behind them.
Profitability
ANET — Profitability (TTM)
| Metric | TTM |
|---|---|
| Operating Margin (TTM) | 45.4% |
| Net Margin (TTM) | 38.4% |
| Return on Assets (TTM) | 14.1% |
| Return on Equity (TTM) | 31.5% |
| Gross Margin (TTM) | 63.0% |
| EBITDA Margin (TTM) | 44.0% |
Source: Yahoo Finance — Trailing Twelve Months (TTM)
TTM gross margin was 63.0%, EBITDA margin was 44.0%, operating margin was 45.4%, and net margin was 38.4%. The spread between gross margin and operating margin is only 17.6 percentage points, which tells me Arista is converting a large share of gross profit into operating profit instead of spending heavily just to maintain scale. ROA was 14.1% and ROE was 31.5%, so equity returns are being amplified by a capital-light balance sheet rather than by debt. That is the cleaner form of capital efficiency I want to see in a premium networking name.
Valuation
ANET — Valuation Multiples
| Metric | Value |
|---|---|
| Market Cap (USD Mil) | 251,728 |
| Enterprise Value (USD Mil) | 238,385 |
| Trailing P/E | 63.4 |
| Forward P/E | 38.7 |
| Price/Sales (TTM) | 23.9 |
| Price/Book (mrq) | 17 |
| EV/Revenue | 22.6 |
| EV/EBITDA | 51.4 |
| Beta (5Y Monthly) | 1.62 |
| FCF Yield % (TTM) | 1.6% |
| Forward EPS (USD) | 5.2 |
| Analyst Target Price – Low (USD) | 185 |
| Analyst Target Price – Mean (USD) | 241 |
| Analyst Target Price – High (USD) | 289 |
| # Analyst Opinions | 28 |
Source: Yahoo Finance
Arista trades at 22.6x EV/revenue, 51.4x EV/EBITDA, 63.4x trailing P/E, and 38.7x forward P/E, with a 1.6% TTM FCF yield. Those are not distressed multiples; they imply the market is paying for durable growth and strong margins, not for balance-sheet repair. On my read, fair value sits in a broad $185–$289 range, which is consistent with the analyst target range and the fact that 28 analysts cover the name with a $241 mean target. I would place the stock in the upper half of that range only if revenue growth stays above 30.0% and FCF margin holds above 35.0%, because that would show the premium multiple is still backed by cash conversion. Forward EPS is 5.16, which is rich versus the legacy networking peers on growth-adjusted terms, but it is still below the scale leaders, so the market is paying for a high-quality compounder rather than a dominant mega-cap.
Leverage
ANET — Leverage & Coverage (Quarterly)
| Metric | Value |
|---|---|
| Current Ratio (mrq) | 3 |
| Operating Cash Flow (TTM, USD Mil) | 5,306.6 |
| Levered Free Cash Flow (TTM, USD Mil) | 3,891.5 |
| Net Debt/EBITDA (TTM) | -2.9 |
| FCF Margin % (TTM) | 36.9% |
Source: Yahoo Finance — Quarterly Financial Statements
Arista’s leverage profile is exceptionally conservative. Total debt was 0, current ratio was 3.0x, and net debt/EBITDA was -2.9x, meaning cash exceeds debt by a wide margin. Operating cash flow was $5.3B TTM and levered free cash flow was $3.9B TTM, so the company is turning earnings into cash at a high rate. Total cash was $13.3B, which gives management room to fund growth, buy back stock, and absorb a downturn without balance-sheet strain.
Insider Activity
The insider transaction record is one-sided: 324 open-market sales and 0 open-market purchases across 115 filings from 2025-01-02 to 2026-06-04. Andreas Bechtolsheim accounted for the largest recent block, with smaller sales from Charles H. Giancarlo, so the pattern leans toward distribution rather than accumulation. I would not overread that as a thesis breaker, but it does tell me insiders are comfortable monetizing strength rather than signaling that the stock is obviously cheap.
Comparable Analysis
Growth
| Company | Revenue TTM (USD Mil) | Revenue Growth YoY % | Diluted EPS TTM |
|---|---|---|---|
| ANET | 10,540.8 | 37.7% | 3.1 |
| AVGO | 89,104 | 85.5% | 7.9 |
| CSCO | 63,325 | 17.6% | 3.3 |
| EXTR | 1,283.6 | 10.3% | 0.3 |
| NOK | 20,394 | 8.4% | 0.1 |
| ALAB | 1,201.9 | 104.5% | 2 |
Source: Yahoo Finance
Arista’s 37.7% revenue growth sits below ALAB’s 104.5% and AVGO’s 85.5%, but above CSCO’s 17.6%, NOK’s 8.4%, and EXTR’s 10.3%. That puts ANET in the premium-growth tier of the peer set without the extreme valuation profile of ALAB. The combination of 37.7% growth and 44.0% EBITDA margin is what makes the name stand out: it is growing faster than the mature peers without giving up profitability.
Valuation
| Company | Trailing P/E | Forward P/E | EV/Revenue | EV/EBITDA | Price/Sales (TTM) | Price/Book (mrq) | Beta (5Y Monthly) | FCF Yield % (TTM) | Forward EPS | Analyst Target Price – Low | Analyst Target Price – Mean | Analyst Target Price – High | # Analyst Opinions |
|---|---|---|---|---|---|---|---|---|---|---|---|---|---|
| ANET | 63.4 | 38.7 | 22.6 | 51.4 | 23.9 | 17 | 1.62 | 1.6% | 5.2 | 185 | 241 | 289 | 28 |
| AVGO | 46.1 | 18.7 | 19.8 | 33.7 | 19.4 | 17.3 | 1.46 | 1.8% | 19.4 | 215.9 | 531.8 | 715 | 47 |
| CSCO | 33.7 | 20 | 7.2 | 24.5 | 7 | 8.8 | 0.99 | 2.5% | 5.6 | 115 | 137.6 | 170 | 24 |
| EXTR | 71.6 | 14.6 | 2.2 | 34.6 | 2.3 | 32.9 | 1.76 | 2.8% | 1.5 | 28 | 33.5 | 38 | 8 |
| NOK | 79.5 | 22.4 | 3 | 23.3 | 3.1 | 2.5 | 0.77 | 1.9% | 0.5 | 8.5 | 15 | 21 | 10 |
| ALAB | 142.8 | 45.5 | 41 | 172.8 | 42 | 29.3 | 3.78 | 0.2% | 6.4 | 190 | 390 | 500 | 23 |
Source: Yahoo Finance
ANET trades at 22.6x EV/revenue and 1.6% FCF yield, versus AVGO at 19.8x and 1.8%, CSCO at 7.2x and 2.5%, EXTR at 2.2x and 2.8%, NOK at 3.0x and 1.9%, and ALAB at 41.0x and 0.2%. On a growth-adjusted basis, ANET looks expensive versus Cisco and Extreme, but much more reasonable than ALAB, and its cleaner leverage profile helps explain part of the premium. A $1 investment a year ago would be worth $1.43 in ANET, versus $1.25 in AVGO, $1.72 in CSCO, $1.05 in EXTR, $2.36 in NOK, and $1.27 in ALAB, so the market has already rewarded the stock for execution. In my view, that is why the valuation debate is really about whether 37.7% growth can persist, not whether the business quality is high.
Profitability
| Company | Operating Margin (TTM) | Net Margin (TTM) | Return on Assets (TTM) | Return on Equity (TTM) | Gross Margin (TTM) | EBITDA Margin (TTM) |
|---|---|---|---|---|---|---|
| ANET | 45.4% | 38.4% | 14.1% | 31.5% | 63.0% | 44.0% |
| AVGO | 54.3% | 42.9% | 15.4% | 44.2% | 75.5% | 58.7% |
| CSCO | 27.7% | 21.0% | 8.0% | 27.3% | 64.5% | 29.4% |
| EXTR | 6.4% | 3.3% | 3.4% | 54.6% | 61.5% | 6.5% |
| NOK | 7.9% | 3.5% | 3.1% | 3.5% | 45.5% | 12.8% |
| ALAB | 22.7% | 30.7% | 10.7% | 25.8% | 75.1% | 23.8% |
Source: Yahoo Finance
ANET’s 63.0% gross margin, 44.0% EBITDA margin, 45.4% operating margin, and 38.4% net margin trail AVGO’s 75.5%, 58.7%, 54.3%, and 42.9%, but they are well ahead of CSCO’s 64.5%, 29.4%, 27.7%, and 21.0%, EXTR’s 61.5%, 6.5%, 6.4%, and 3.3%, and NOK’s 45.5%, 12.8%, 7.9%, and 3.5%. That margin stack looks like a software-enabled networking model rather than a commodity hardware business, and it is close enough to Broadcom’s profile to justify a premium. ROE of 31.5% and ROA of 14.1% also compare well with the group, which tells me the returns are being earned, not engineered.
Leverage
| Company | Total Debt/Equity % (mrq) | Current Ratio (mrq) | Total Debt (mrq, USD Mil) | Net Debt/EBITDA (TTM) | FCF Margin % (TTM) |
|---|---|---|---|---|---|
| ANET | — | 3 | 0 | -2.9 | 36.9% |
| AVGO | 59.6 | 2.5 | 59,419 | 0.7 | 34.3% |
| CSCO | 62 | 0.9 | 31,185 | 0.8 | 17.7% |
| EXTR | 219.6 | 0.9 | 194.6 | -0.2 | 6.3% |
| NOK | 15.8 | 1.5 | 3,359 | -0.7 | 5.8% |
| ALAB | 2.6 | 10.1 | 44.4 | -4.2 | 7.6% |
Source: Yahoo Finance
ANET’s zero debt, -2.9x net debt/EBITDA, 36.9% FCF margin, and 3.0x current ratio are cleaner than AVGO’s 59.6% debt/equity and 0.7x net debt/EBITDA, and much stronger than CSCO’s 62.0% debt/equity and 17.7% FCF margin. That cash-rich profile matters because it lets Arista fund growth and buybacks without balance-sheet strain, while EXTR and NOK carry weaker cash conversion and less flexibility. In other words, the market is not paying ANET for leverage; it is paying for growth and cash generation together.
Conclusion
I would put my rating as a Hold because the stock already discounts a lot of good news, while the main risk is that hyperscaler spending normalizes before Arista can keep compounding at this pace. The key tension is that the business is still delivering 37.7% revenue growth and 36.9% TTM free cash flow margin, but the shares trade at 22.6x EV/revenue and 38.7x forward P/E, so the market is asking for continued execution with very little margin for error.
I would raise my rating more towards a Buy if revenue growth stays above 30.0% for the next two quarters, meaning the AI buildout is still broadening rather than peaking, and if gross margin holds above 63.0%, which would tell me merchant silicon costs and customer concessions are not eroding the model. I would also want to see FCF margin stay above 35.0%, because that would confirm the growth is still turning into cash rather than just more revenue. On the other side, I would move from Hold to Sell if revenue growth falls below 20.0% for two consecutive quarters, or if gross margin slips materially below 63.0%, because that would suggest the current premium is no longer supported by the operating model.
The balance of evidence still favors execution over deterioration, but the valuation already reflects that view. What I would watch most closely is whether the next two quarters keep revenue above 30.0% growth while preserving margin discipline; if they do, the stock can justify a higher rung, and if they do not, the current Hold will look too generous.
What to Watch Next
- Revenue growth above 30.0% for two quarters — would support a move toward Buy.
- Gross margin holding above 63.0% — would show the model is still absorbing silicon costs.
- FCF margin staying above 35.0% — would confirm growth is still converting into cash.
- Revenue growth below 20.0% for two quarters — would argue for a lower rating.
- Gross margin slipping materially below 63.0% — would signal pricing or cost pressure.
What’s your take? I rated Arista Networks (ANET) HOLD above — but the goal here is to get this right, not just to publish an opinion. What would you add to this analysis, or which risk or catalyst do you think I’m under- or over-weighting? Tell me in the comments.
Sources
- SEC 10-K Annual Report — filed 2026-02-17
- SEC 8-K Filing (2026-06-02)
- SEC 8-K Filing (2026-05-05)
- SEC 8-K Filing (2026-02-12)
- SEC Form 4 Insider Transaction (2026-06-08)
- SEC Form 4 Insider Transaction (2026-06-03)
- SEC Form 4 Insider Transaction (2026-06-02)
- SEC 10-K Annual Report — FY2026
- SEC 10-K Annual Report — FY2025
- SEC 10-K Annual Report — FY2024
- SEC 10-K Annual Report — FY2023
- SEC 10-K Annual Report — FY2022
Data sourced from Yahoo Finance and SEC EDGAR. Not investment advice.
Leave a Comment